By Joseph D’Aleo, AMS Fellow, CCM
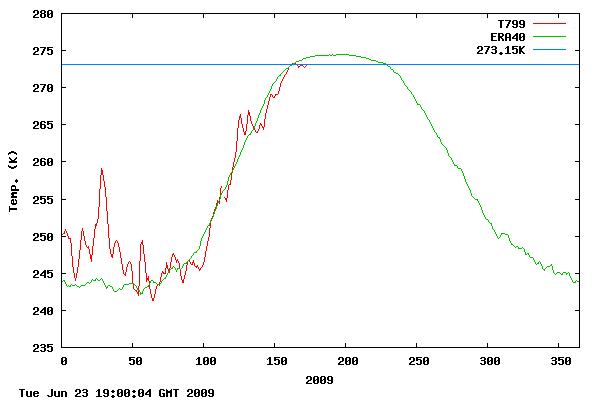
The average arctic temperature is still not above (take your pick) 32°F 0°C 273.15°K–this the latest date in fifty years of record keeping that this has happened. Usually it is beginning to level off now and if it does so, it will stay near freezing on average in the arctic leading to still less melting than last summer which saw a 9% increase in arctic ice than in 2007. H/T to FredM and MarcM

Data from DMI (Danish Meteorological Institute)
See larger image here. Compare with DMI charts in other years here.
[NOTE: as a second source to Joe’s article I’ve added this weather station data from the “North Pole Cam” operated by NOAA. Link is here: http://www.arctic.noaa.gov/gallery_np.html
There is a webcam at the “North Pole” (at least it starts out very near there) that reports via satellite data uplink at regular intervals. They also have a weather station with a once weekly data plot. Note it is still below zero centigrade there.

Latest data (updated approximately weekly) Readers should note that the station really isn’t at the north pole anymore due to significant ice drift. – Anthony ]
The AMSR-E shows the ice situation on June 23rd:

See where we stand relative to recent years in terms of total extent here. We are using JAXA-IJIS AMSR-E data to track ice as NSIDC is using older satellites and the new director Mark Serreze has proven untrustworthy. The next two months will be interesting. Temperatures usually begin flatlining in late June which would suggest less ice loss, although the water temperature beneath plays a key role and all of the warm water that entered the Arctic when the Atlantic was very warm in the middle 2000s (now is nearer normal) may not have circulated out yet.
The other question is what effect the early spring Mt. Redoubt eruptions may be having. Are the sulfate aerosols trapped in the arctic stratosphere reflecting back some of what sunlight reaches the high latitudes?

Along the edge of the arctic, Ross Hays who worked for CNN and then NASA who last year posted from Antartica sent this note to me “They have me working in arctic Sweden until mid July. One of the Esrange staff members told me that so far Kiruna had had the coldest June in 150 years!”
See PDF here.
Here are the temps for Alert at the top of the Canadian Arctic. Below freezing in Alert.
http://www.climate.weatheroffice.ec.gc.ca/climateData/dailydata_e.html?timeframe=2&Prov=CA&StationID=42463&Year=2009&Month=6&Day=24
will (05:05:51) :
You just demonstrated the point I made: It all depends…
Could you do me a favour and post the same temp data but with a starting point somewhere in 1999 (to make it a full decade) and bet we will see a warming trend. But did you note my caveat?: “for what it is worth”
@VG
You have confused Danish and Nansen.
Go back and look at what engineer wrote.
Morgan T (06:02:03) :
“…most people in the AGW crowd will probably not admit a cooling trend at all.”
You’re right. It’s even better than that though because the temperature is obviously dropping globally – obvious to me anyway – even with all the thermometers located in places which should be getting hotter! parking lots and roofs and under air conditioning units etc. etc….
I agree only in part, but I see the process in a different way.
When ice melts, it takes energy from the environment to change its physical state, and while ice is melting the temperature in equilibrium should be 0º Celsius. I believe thermometers used to be calibrated by submerging them in a mixture of ice and water and the thermometer should read 0º Celsius in those conditions.
If melting is brutal, it only means that ice melts faster, not that more heat is taken from the environment and then the environment cools down below 0º Celsius (32º Fahrenheit)
That is, of course in equilibrium conditions, which I highly doubt they exist in the Arctic, with all those winds and currents and all.
Let’s say that you cannot prove there was a warming trend during the last decade. And it is difficult to support AGW when you can prove an increment of GHG but not an increment of temperatures.
To all: the volume of melted ice should be approximately the same as the previous years – only this time it happened quite fast. I also gave an answer to the other questions, but the message isn’t there yet.
For those who wonder where I got the idea that the sea ice extent is lower than last year, it simply comes from the JAXA results: simply follow the widgets on the right of this page.
Again: the temperature DID exceed 273 K several times earlier this year and is now higher, so why keep this post? It’s totally wrong…
REPLY: No Flanagan, the post is not wrong, you are. Confirmation bias on your part Flanagan, you see what you want. The title:
“Arctic temperature is still not above 0°C – the latest date in fifty years of record keeping”
Refers to the current condition, not the first excursion. The temperature has remained below 0C at this late date, if you go back through previous charts you won’t find a year where it remains below 0°C on Jun23rd. The important thing is that flat top of the 2009 graph hovering right at below 0°C at this late date. You won’t find a similar scenario in looking at every graph since 1958.
Though I’m sure you will be thrilled to know that with the June24th data update (posted today), it has ticked above 0°C again. Will it stay above, or go back down? It is certainly worth watching. The climate normal line in green doesn’t seem to be followed this year.
I think I’ll add it to sidebar widgets. – Anthony
will (05:05:51) :
Try this one, it’s hillarious; (Hint, notice which one of these is not like the others, and notice who would be the soul responsible for THAT data.)
http://www.woodfortrees.org/plot/hadcrut3vgl/last:140/trend/plot/gistemp/last:130/trend/plot/uah/last:140/trend/plot/rss/last:140/trend/plot/hadcrut3vgl/last:140/plot/gistemp/last:140/plot/uah/last:140/plot/rss/last:140
I was having a thought; couldn’t we have some kind of institution who’s members/employees were charged with accurately recording and maintaining data? No punditry or promulgation of ideas allowed; simply record the data accurately and maintain it’s integrity. Wouldn’t that be worth funding, instead of GISS, NOAA, etc?
Just a thought.
My mistake; I wrote the graph, but I didn’t change the GIS to 140, like the others. The problem still exists where Jim’s data exhibits an opposite trend when it’s corrected, just not nearly as pronounced.
Here’s the corrected;
http://www.woodfortrees.org/plot/hadcrut3vgl/last:140/trend/plot/gistemp/last:140/trend/plot/uah/last:140/trend/plot/rss/last:140/trend/plot/hadcrut3vgl/last:140/plot/gistemp/last:140/plot/uah/last:140/plot/rss/last:140
Sorry for the (unintentional) obfuscation.
Tom in Florida,
No Sir Flanagan does mean ”hot” he is one of those that in 10 years time is going to die from the heat.
Joe D’Aleo’s post is excellent observational science; thanks. Fine addition to my Arctic folders. I have a dear friend trying to build a house in Homer, Alaska. Cooler than usual in the Alaskan sun belt — plus it keeps raining.
Also, re Alan M R MacRae’s comment (3:10 and 3:30) on the Woods Hole Research Center scientists’ letter demanding action to undo global warming because settled science said we (rich) human’s dunit.
Anthony, when the names of these Un-scientists are outed on your blog, would you be interested (in your spare time) in some kind of an Unscientist Dumb-A$$ Award? (Sorry, crude I know, but I am not very imaginative at present.) We, your many, many readers could send the Award banner along with article that explains the scientific truths directly to each Un-scientist. In my imagination, their names could grace your award area “permanently”, perhaps recalled with a button on the top. The world should know who, EXACTLY WHO, is altering data, making up analyses, and, in effect, lying to us. These individuals are responsible for attempting to impoverish developed societies and tax its citizens to the hilt for the rich living of “global elites”.
Flanagan (01:58:17) :
I agree that the majority of melting would occur at the ice-ocean interface at the bottom, although some would still occurr at the ice-air interface on the top. The ice-ocean melting cannot possibly cause below freezing temps in the air (first law of thermo). So it would have to be the ice-air interface. Yes, the process of melting obsorbs heat, but it still has to melt first, so the air has to first exceed 0 deg. C before any melting on the ice-air inteface can occurr. So the endothermic process might explain why the air temps normally go over 0 deg. C then taper off, but it cannot explain why it hasn’t even hit 0 deg. C yet this year.
Will & Bob (Kutz)……
I guess we should forgive Chris for his Mann’err’isms.
Bob,… RE: Wouldn’t that be worth funding, instead of GISS, NOAA, etc?
WE could suggest that to the Obama administration. They would love to establish yet another governmental office (job creation you know). I would not be surprised however if they appointed James Hansen to head it.
__________________
The Arctic could yet experience an increase in rate of ‘melt’. I don’t, personally, see any reason to expect it. Should it not occur and multi-year ice levels improve again next year I expect that part of the reason for it will be declared, by some, to be due to the decrease in CO2 emissions during the global economic recession. It will be spun. Count on it.
@Per Strandberg
Amundsen went throught he NE Passage in the early 1900’s and others went through long before that. The Russians were more of a problem than the ice.
“I was having a thought; couldn’t we have some kind of institution who’s members/employees were charged with accurately recording and maintaining data?”
There’s a basic conceptual problem here (on the part of almost everyone) that is going to have to change before these biases can be addressed.
This instant a task becomes taken over by an “institution” it becomes subject to bias and eventual organizational capture by those groups who realize it is in their interest to slant the outcome in a desired direction. Put in a simpler way, all institutions will become corrupted over time, this cannot be stopped. The more money and perks are at stake, the faster they will be corrupted. If those with much to gain are involved at the startup phase, they will be corrupt from the very instant of their creation.
So is there an answer? YES!! Distributed record keeping with only fractional responsibility spread among hundreds if not thousands of independant agents, all responsible for cross checking each other. The internet now makes this possible.
Anthony’s surface station project is the perfect example of this concept in action. It is the wave of the future, and the only mode of data collecting that can be truly trusted from now on.
Al Gore will be revising his North Pole melt predictions again. I’m sure he will be lowering the % of probability of an ice free North Pole in 5 years forecast–for the dwindling number of those who are still listening to him.
woodfortrees.org provides good temperature information. I started with the UAH graphs from 1978. The interesting part for me was to see the temperatures rise with a very active sun and now starting to drop with an inactive sun. It also says we are not as cool as the mid 1970s. There is still plenty of reserve heat in the oceans from the warm years. Good thing
Leif, are you sure there is no correlation between the sun and earth climate?
Not necessarily. Rectifying the cause of an effect does not necessarily reverse the effect unless you have data or proof to support it. Even if the current data on man-made CO2 were proof of AGW, there is simply no data (that I’m aware of, because how could it be observed?) that reducing CO2 emissions would allow global cooling to occur. We’d be spending trillions of $s on a leap of faith with no scientific basis whatsoever.
Data points are nice, but there are other indicators:
http://www.winnipegfreepress.com/opinion/westview/big-chill-in-churchill-47992231.html
I’d say, ‘ask the local fauna’, but I’m no Dr. Dolittle.
Lucky for you, eh Flanagan?
“For those who wonder where I got the idea that the sea ice extent is lower than last year, it simply comes from the JAXA results: simply follow the widgets on the right of this page.”
The AMSR-E data which is used by JAXA does not support this conclusion.
http://www.iup.uni-bremen.de:8084/amsr/amsre.html
http://www.ijis.iarc.uaf.edu/cgi-bin/seaice-monitor.cgi
Therefore, Flanagan is just Making It Up, which is why he won’t show any actual source that makes this claim.
Funny how the largest erruption *this year* could induce the coldest June in *150 years* in some places. Climate is a funny thing, and like Quantum Mechanics, I guess if you are going to understand it, you leave intuition at the door. Or, possibly, people are grasping at straws.
Arctic temps last 3 days:
http://www.klimadebat.dk/forum/vedhaeftninger/arktisjuni25.gif
Especially, notice fig5.
Here you see that South East Greenland had much less ice floating down from the Arctic. This indicates that the Arctic is not at all likely to get near record low ice extend of 2007.
On top of that cold temperatures.
“I was having a thought; couldn’t we have some kind of institution who’s members/employees were charged with accurately recording and maintaining data?”
In the Dune series, by Frank Herber, I think, the scientific class and the political class were strictly forbidden from interfering in each the other’s domain. This was due to a near apocolypse that resulted from the two meddling in each other’s business. Seems kind of prescient.
“The ‘heads I win, tails you lose’ argument is a non-starter with me.”
When somebody is wrong on the facts, and refuses to admit it, being confronted with logic often looks like “heads I win, tails, you lose” Checkmate can be “Move here I win, move there you lose.” Of course, checkmate is based on a strict set of logical rules and empirical evidence, not on some model of how you assumed the match would go.
Plot the data of the last decade and you could even argue for a warming trend, for what it is worth:
I’ve said it before and I’ll say it again. You need to “include” both the 1998 El Nino and 1999-2000 La Nina IN or include both OUT. A starting point anywhere in between is cherrypicking (Especially from 1999).