By Joseph D’Aleo, AMS Fellow, CCM
The average arctic temperature is still not above (take your pick) 32°F 0°C 273.15°K–this the latest date in fifty years of record keeping that this has happened. Usually it is beginning to level off now and if it does so, it will stay near freezing on average in the arctic leading to still less melting than last summer which saw a 9% increase in arctic ice than in 2007. H/T to FredM and MarcM
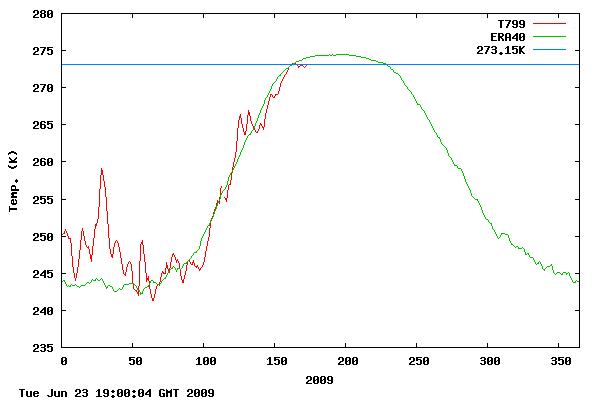
Data from DMI (Danish Meteorological Institute)
See larger image here. Compare with DMI charts in other years here.
[NOTE: as a second source to Joe’s article I’ve added this weather station data from the “North Pole Cam” operated by NOAA. Link is here: http://www.arctic.noaa.gov/gallery_np.html
There is a webcam at the “North Pole” (at least it starts out very near there) that reports via satellite data uplink at regular intervals. They also have a weather station with a once weekly data plot. Note it is still below zero centigrade there.

Latest data (updated approximately weekly) Readers should note that the station really isn’t at the north pole anymore due to significant ice drift. – Anthony ]
The AMSR-E shows the ice situation on June 23rd:
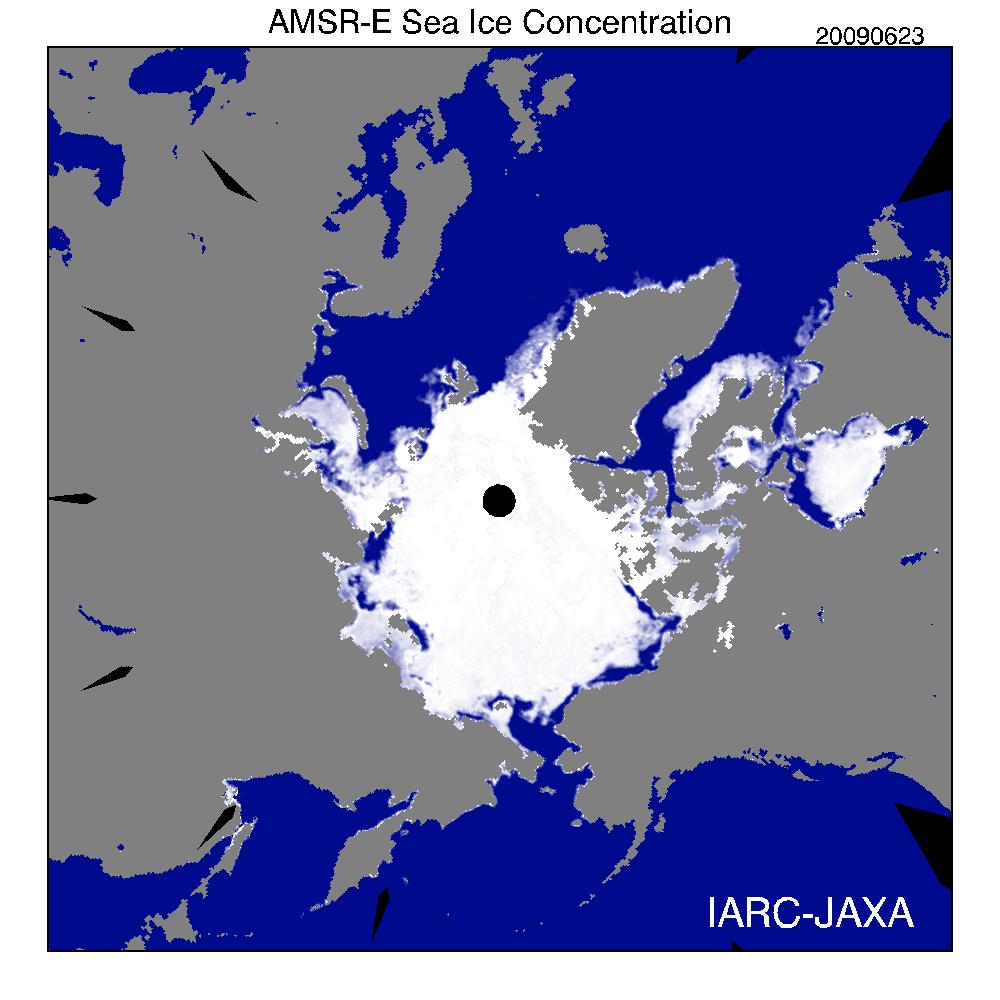
See where we stand relative to recent years in terms of total extent here. We are using JAXA-IJIS AMSR-E data to track ice as NSIDC is using older satellites and the new director Mark Serreze has proven untrustworthy. The next two months will be interesting. Temperatures usually begin flatlining in late June which would suggest less ice loss, although the water temperature beneath plays a key role and all of the warm water that entered the Arctic when the Atlantic was very warm in the middle 2000s (now is nearer normal) may not have circulated out yet.
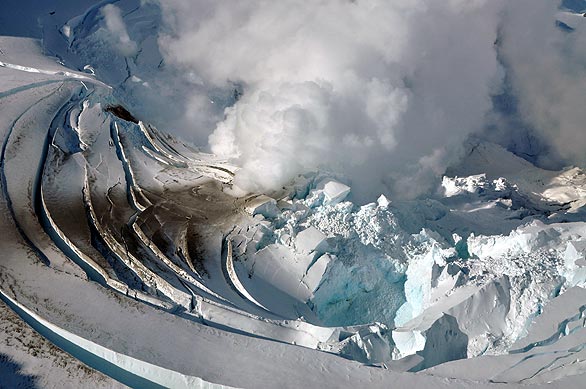
The other question is what effect the early spring Mt. Redoubt eruptions may be having. Are the sulfate aerosols trapped in the arctic stratosphere reflecting back some of what sunlight reaches the high latitudes?
Along the edge of the arctic, Ross Hays who worked for CNN and then NASA who last year posted from Antartica sent this note to me “They have me working in arctic Sweden until mid July. One of the Esrange staff members told me that so far Kiruna had had the coldest June in 150 years!”
See PDF here.
Allan M R MacRae (03:10:21):
“But Earth is not warming, it is cooling, and has been for a decade or
so, despite increasing CO2 levels. It is by now obvious that increasing CO2
is not a significant driver of global temperature.”
Alan, please we are as not buying these arguments of cooling for more than a decade. Yes it has been cooler the last two years or so and before that (5 years or so) the trend has been flat. Plot the data of the last decade and you could even argue for a warming trend, for what it is worth:
http://www.woodfortrees.org/plot/rss/from:1999/plot/rss/from:1999/
Physicist grumble: there is no degree sign with Kelvin, 0º C = 273.15 K
After checking the link, the last data points are slightly over 273.15 K, but still below the green line.
“The ‘heads I win, tails you lose’ argument is a non-starter with me.”
I agree 100%. Show me where the IPCC specifically predicted lower arctic surface temperatures and I will be interested.
‘this is exactly what is to be expected’ is often a prelude to a just-so story.
Flanagan, if arctic surface temperatures rise and start exceeding 0 C earlier than usual, is that also consistent with global warming? Or would that be evidence against the hypothesis?
(Actually, I recall a Realclimate piece a year or two ago trumpeting abnormally high temperatures on the arctic island of Svaalbard. )
To the question of where does the hot water come from, I’m pretty sure that “from the South” would be a good answer :0)
Now, something else is annoying me. If you take a look at the link given by the author
http://ocean.dmi.dk/arctic/meant80n.uk.php
It clearly looks like the temperature exceeded 273 K several times around days 160-170, which is the average date for surpassing 0°C it seems. Can anyone else confirm my visual impression? Does anyone know where to get the data?
Flanagan (01:58:17) :
Actually, if this was really expected then why wouldn’t it have occured greatest in 2007 and then to a slightly lesser extent last year during a similar very large melt.
Using your own theory, since we actually started with thinner and therefore less total ice this year and therefore less “endothermic reaction” with less ice to melt, it should have been a warmer than normal arctic ?
Please explain more ?
Interesting graphic. North Greenland coast looks ice-locked. Hudson Bay ditto – is this frequent? Will the AGW promoters simply claim volcanic activity has produced this “slight” cooling of global temps, despite Dr Vicky Pope pointing out that ice decrease could be perfectly natural?
IPCC spokesmen claimed volcanic activity, plus reduced solar output plus natural variation in the climate system last year caused the cooling temperature, two-faced hypocracy & mendacity clearly sits easy on their minds such is their integrity. I seem to recall from the last two SPM’s that variations in solar output were enphatically not the cause of the modern warming of the climate system. The main reason they gave was pretty much what sceptical scientists were claiming all along, principally “natural variations of the climate system”.
Allan M R MacRae 😉
Climate Change = Head I Win Tails You Lose! Don’t let them off the hook at any stage. The warmers have claimed man has caused Global Warming, so make them eat their words, it might seem irritating to both sides but I always interupt an AGW when they refer to CC, & remind them what they actually mean. Remember, revenge is a dish best served cooling! The Tyndall Centre has records of unofficial discussions where GW is referred to as CC so as to more precisely “reinforce” the message to the public at large, so if the climate system warms it’s CC, if it cools, it’s CC, = HIWTYL!
Lee Kingston: The Mt. Sarychev eruption sent out a much more impressive SO2 plume than Mt. Redoubt. I have been trying to determine whether either of these were large enough to cause significant cooling, and there appears to be conflicting information.
Chris Schoneveld (04:17:18) : “Alan, please we are as not buying these arguments of cooling for more than a decade. Yes it has been cooler the last two years or so and before that (5 years or so)”
Really? I prefer this plot:
http://www.woodfortrees.org/plot/hadcrut3vgl/last:100/trend/plot/gistemp/last:100/trend/plot/uah/last:100/trend/plot/rss/last:100/trend/plot/hadcrut3vgl/last:100/plot/gistemp/last:100/plot/uah/last:100/plot/rss/last:100
would you like to try for 8 years of cooling?
For the sulphur plumes, try this NASA OMI site:
http://so2.umbc.edu/omi/
Then look through the daily images for a site of your choice.
Re: Redoubt, yes it may have resulted in some aerosol-induced cooling. But this is likely have been counter-balanced to a significant extent by the warming it produced via accelerated snow-melt (and thus reduced albedo).
See e.g.
http://newsminer.com/news/2009/jun/07/alaska-hikers-lucky-warmth-ash-speed-snowmelt/
“…the season’s alpine snow melt — spurred on by the volcanic dust left behind by the eruptions of Redoubt volcano — appears way ahead of schedule…
…Snowfields, dusted with gray volcanic grit, rapidly disappeared…”
Flanagan: (01:58:17)
I agree with part of what you said. More heat would come from the sea which has much greater heat capacity than the atmosphere. But since the energy expended to melt ice would have come from the ocean, it follows that the ocean would cool, rather than the atmosphere. There remains a frozen barrier between the two.
Heat would then need to transition the frozen ice sheet to cool the atmosphere, and return heat to the ocean. This seems counter intuitive, except perhaps near the perimeter where the ice is already breaking up.
Flanagan,
You assert that ‘ice is now lower than last year’.
Where?
http://arctic-roos.org/observations/satellite-data/sea-ice/ice-area-and-extent-in-arctic
AGW is now operating on the credulity of its true believers and nothing else.
Flanagan (01:58:17) :
Actually, this is exactly what is to be expected…
If I had a dime…
Silly question here: how do you report wind direction at the North Pole ? Every wind is from the South ?
True, there is no North, South, etc. at the poles, there is still the 0-360 deg compass rose which is still valid. But now, it refers to the longitude line from where the wind is blowing from or to & everything is referenced to 0 deg Long.
Jeff
“Along the edge of the arctic, Ross Hays who worked for CNN and then NASA who last year posted from Antartica sent this note to me “They have me working in arctic Sweden until mid July. One of the Esrange staff members told me that so far Kiruna had had the coldest June in 150 years!”
Was this predicted? In the models from the warmers?
Joseph Romm tells us cooling and warming, wet and dry are all signs of their friend global warming.
Warming has become a political movement. One of the ways it breaks down is in it’s prdeiction error.
Flanagan (01:58:17) : “Melting is mainly due to contact with “hot” water, not melting from the top”
I believe you really mean “warmer” water not “hot” water, as in any water temperature that is warmer than the covering ice.
Alaska Winter Weather Advisory – In the summer!
INCLUDING…FORT YUKON… VENETIE… CENTRAL … CIRCLE… STEVENS VILLAGE… BEAVER… CHALKYITSIK… BIRCH CREEK… CIRCLE HOT SPRINGS… TWELVE MILE SUMMIT … STEESE HIGHWAY ABOVE 3500 FEET… IN EFFECT UNTIL 6 AM THURSDAY.
SNOW AND BLOWING SNOW WILL REDUCE VISIBILITIES TO BELOW 1 MILE … THIS ADVISORY INCLUDES EAGLE SUMMIT WHERE AS OF 2 PM WEDS … IT IS MODERATELY SNOWING WITH LIMITED VISIBILITY.
http://www.nws.noaa.gov/view/prodsByState.php?state=AK&prodtype=warnings
Actually, we don’t say, “degrees Kelvin.” The Kelvin is a unit, not a degree, so it’s 273.15 K.
The question about sulfate aerosols is a good one. There is a need to see if there are more such aerosols around, but don’t sulfates disappear in a week or less? The eruptions stopped many weeks ago, and were intermittent mostly in the winter to early spring, so any effects would have occurred months ago, and wouldn’t explain low temps the last couple of weeks.
Another intriguing question is the effect of the ash from Mt. Redoubt. The Anchorage papers reported early melting of snow in nearby mountains because of the ash deposited on it. If ash from Redoubt reached the Arctic, it should have fallen on sea ice and thus could accelerate melting, as black carbon does. Did ash from Mt. Reboubt’s eruptions reach the Arctic? Does anyone know?
We now have a new guy promoting global warming awarness, with the help of money from the WWF. This time, the idea is to sail through the north east passage north of Russia.
http://translate.google.com/translate?u=http%3A%2F%2Fwww.aftenposten.no%2Fviten%2Farticle3139607.ece&sl=no&tl=en&hl=en&ie=UTF-8
This will be interesting to follow!
Chris Schoneveld @ur momisugly 04:17:18
Now try: http://www.woodfortrees.org/plot/rss/from:1998/plot/rss/from:1999
Isn’t cherry-picking a wonderful thing?
It’s fascinating comparing this record with previous years. Especially the late 70’s when we were all freezing. Take a look at 1976. Warming? What warming?
Chris: Most sceptics say that is has been a cooling going on since 2002 not a decade, most people in the AGW crowd will probably not admit a cooling trend at all.
For those who don’t know, Flanagan is most assuredly a disciple from the “Dark Side” who pops into skeptic sites with some innocent-sounding comments in order to lure others into a pointless debate. The debate is pointless because Flanagan is wedded to the AGW talking points and won’t budge. Flanagan is a true believer of the AGW religion and will not be swayed. Engage this individual, and you will chase your tail around a tree. Ignore him and he eventually goes away.
“The average arctic temperature is still not above (take your pick) 32°F 0°C 273.15°K”
Just a head’s up, there’s no degree symbol in the Kelvin system. It’s just 273.15K. I lost 5 points on a test once for putting that degree symbol in, so it’s a sore point with me :).