By Joseph D’Aleo, AMS Fellow, CCM
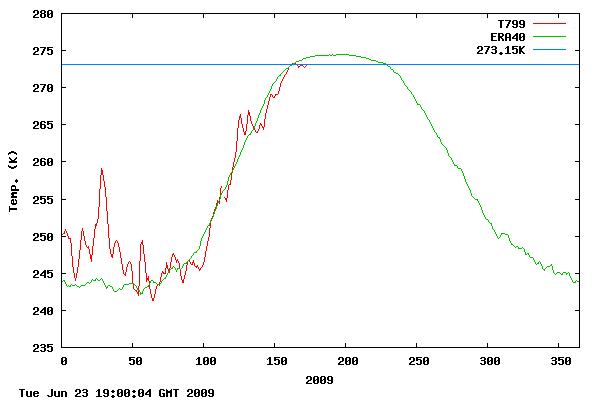
The average arctic temperature is still not above (take your pick) 32°F 0°C 273.15°K–this the latest date in fifty years of record keeping that this has happened. Usually it is beginning to level off now and if it does so, it will stay near freezing on average in the arctic leading to still less melting than last summer which saw a 9% increase in arctic ice than in 2007. H/T to FredM and MarcM

Data from DMI (Danish Meteorological Institute)
See larger image here. Compare with DMI charts in other years here.
[NOTE: as a second source to Joe’s article I’ve added this weather station data from the “North Pole Cam” operated by NOAA. Link is here: http://www.arctic.noaa.gov/gallery_np.html
There is a webcam at the “North Pole” (at least it starts out very near there) that reports via satellite data uplink at regular intervals. They also have a weather station with a once weekly data plot. Note it is still below zero centigrade there.

Latest data (updated approximately weekly) Readers should note that the station really isn’t at the north pole anymore due to significant ice drift. – Anthony ]
The AMSR-E shows the ice situation on June 23rd:

See where we stand relative to recent years in terms of total extent here. We are using JAXA-IJIS AMSR-E data to track ice as NSIDC is using older satellites and the new director Mark Serreze has proven untrustworthy. The next two months will be interesting. Temperatures usually begin flatlining in late June which would suggest less ice loss, although the water temperature beneath plays a key role and all of the warm water that entered the Arctic when the Atlantic was very warm in the middle 2000s (now is nearer normal) may not have circulated out yet.
The other question is what effect the early spring Mt. Redoubt eruptions may be having. Are the sulfate aerosols trapped in the arctic stratosphere reflecting back some of what sunlight reaches the high latitudes?

Along the edge of the arctic, Ross Hays who worked for CNN and then NASA who last year posted from Antartica sent this note to me “They have me working in arctic Sweden until mid July. One of the Esrange staff members told me that so far Kiruna had had the coldest June in 150 years!”
See PDF here.
Me thinks the Scandinavians have “copped on” as the British say! They are now reporting real data from Ch 17. I agree with this posting… will not be relying on NSIDC (as if they cared hahaha LOL)
http://arctic-roos.org/observations/satellite-data/sea-ice/ice-area-and-extent-in-arctic
Danish Met Institute
http://ocean.dmi.dk/arctic/icecover.uk.php
The effects of the eruptions of Mt Redoubt are one thing to consider but the more recent eruptons of Sarychev should not be overlooked. The eruption of Sarychev according to NASA scientist Simon Carn were the largest SO2 event of the year.
http://earthobservatory.nasa.gov/NaturalHazards/view.php?id=38975
Furthermore as noted in the above link this eruption reached altitudes of 10 -15 km and possibly up to 21km.
No, the ice is melting. Those nice Catlin people with the drill and the tape measure said so. And then there was that BBC reporter…
The other question is what effect the early spring Mt. Redoubt eruptions may be having.
Though it is at about 10° of lower latitude than Redoubt it would seem that the eruption of Sarychev may contribute as well.
It will be interesting to see if the cooler conditions continue into the winter and what the coming winter brings.
Please note that the Danes use 30% ice concentration in their graphs, as opposed to 15% at NSIDC and Artic-Roos.
Bought by ExxonMobil!!
Really, this is really an interesting thread. This DMI graph and website is one worth bookmarking. I am surprised by this result. I will send the link to Drudge. Every duped (illiterate?) Congressman should read this thread before casting their vote on this largely unread climate bill on Friday.
I just sent the links to this website and the DMI to Drudge.
I’d say it’s time for the opponents of that Cap and Kill bill to pile on big time. Clearly the Arctic is not melting anymore.
The CO2 theory is a genuine hoax.
On causation, if models show caps warming the most and quickest during global warming, wouldn’t they also show the caps cooling the quickest and the most during cooling?
Sure this could all be due to Mt Redoubt, ocean currents or weather patterns. But isn’t it a coincidence that 2008 was the coldest year in a decade, last winter was the coldest in many regions in decades, more frequent La Ninas are occurring all while CO2 continues to rise, but solar activity dropping? Indeed global temps have been dropping dramatically over the last 5 years.
“Dramatic” a term that I think is not an overstatement.
Actually, this is exactly what is to be expected…
Melting is mainly due to contact with “hot” water, not melting from the top. When ice melts, energy is pumped in the environment (i.e. the process is endothermic) which tends to cool the surrounding atmosphere. If melting is brutal, then a lot of heat will be absorbed and the surface temperature will drop. The April-May melting this year was quite impressive, and we’re now below last year levels. So I think it’s pretty coherent.
A similar phenomenon takes pace in the winter, but in the other direction. Since we had a lot of open water at then end of the summer, refreeze was pretty quick last year, which freed a lot of heat in the atmosphere – as can be seen on the graph (surface temperatures being higher than normal).
It sure is cold up there…brrrr…
An interesting article, many thanks.
Just one tiny point, the pedant in me forces me to point out that there are no °K or “degrees kelvin”. To be technically correct (the best kind of correct!) it should be just K or kelvin. It says so in Wikipedia, so it must be true!
http://en.wikipedia.org/wiki/Kelvin
OT, but relevant question:
did anybody has ever pressed the AGW folks/promoters/programmers to validate/prove the climate models by going backwards in time?
What would they say to a challenge like that? What was the climate 40mill years ago? OK too much to ask, how about 100 years ago?
What was the ice extend back then?
Flanagan (01:58:17) :
You expanation has a certain plausability, I’ll allow; but I worry when people (I’ve no idea if you are an AGW proponent) start talking “cooling” really means “warming”. There simply is no way to falsify that kind of argument.
The “heads I win, tails you lose” argument is a non-starter with me.
If the ice is still covering the pole, it seems that surface atmospheric temperature is due to “lack of heating” from whatever sources of energy heat the atmosphere.
Be able to falsify your argument and I’ll take another looksee.
Flanagan
The question is, where is the warm water coming from and how is it created?
* Through mans activities in warming the atmosphere that is in contact with the ocean surface?.
* Direct sun heating the oceans? Likely.
* Direct sun heating the ocerans abnormally through prolonged spells of sunnier than normal weather. Likely.
* Warmer or stronger than normal currents shifting their position and more directly affecting the ice? Likely.
I am particlarly interested in the gulf stream effect (looking at this from the UK viewpoint) This link is interesting
http://polar.ncep.noaa.gov/ofs/
Click on forecast zones for animation.
Tonyb
Silly question here: how do you report wind direction at the North Pole ? Every wind is from the South ?
Published yesterday on CCNet
(8) RE: CLIMATE SCIENTISTS DEMAND CLIMATE ACTION
Allan MacRae
Hi Benny,
The names of these 20 advocates for action on ‘climate change’ (CCNet,
23 June 2009) are: Dean Abrahamson, Univ. of Minnesota; Robert Costanza,
Univ. of Vermont; Peter Gleick, Pacific Institute; Richard Houghton, The
Woods Hole Research Center; Ralph Keeling, Scripps Institution of
Oceanography; Donald Kennedy, Stanford Univ.; Thomas Lovejoy, Heinz
Center for Science, Economics & the Environment; Michael MacCracken,
Climate Institute; Michael Mann, Pennsylvania State Univ.; Michael
McElroy, Harvard; Steve Running, Univ. of Montana; William Schlesinger,
Cary Institute of Ecosystem Studies; Stephen Schneider, Stanford
University; Richard Somerville, Scripss Institution of Oceanography;
James Gustave Speth, Yale University; Lonnie Thompson, Ohio State
University; Warren Washington, National Center for Atmospheric Research;
Richard Williams, The Woods Hole Research Center; Timothy Worth, The
United Nations Foundation; George Woodwell, The Woods Hole Research
Institution.
The text of their letter is here:
They claim: “The time for national action on climatic change is now.
There has already been too much delay. The stakes are far too high to
compromise the integrity of, and our responsibility for, prompt national action.”
One infers “the 20” mean ‘global warming’, but they are not inclined to
such precision in their letter.
But Earth is not warming, it is cooling, and has been for a decade or
so, despite increasing CO2 levels. It is by now obvious that increasing CO2
is not a significant driver of global temperature.
The use of a euphemism such as “climate change” instead of “global
warming” reflects not only a lack of precision, it reflects deliberate
obfuscation of the issue, and a lack of integrity. The 20 are, at best, political
scientists.
I hope their names are remembered for a long time, as Earth continues to
cool, and harvests fail due to the absence of global warming.
Regards, Allan
Gosh, looks as if the ice will melt EVEN FASTER THAN WE THOUGHT!!!!!!!!!!!!!
“which saw a 9% increase in arctic ice than in 2007.”
English is not my first language but this doesn’t sound right.
What about: which saw a 9% increase in arctic ice as compared to 2007 or which saw a 9% increase in arctic ice from 2007.
try again – correction to Allan M R MacRae (03:10:21) :
The text of their letter is here:
http://www.whrc.org/pressroom/PDF/Climate_Scientists_Letter_6.19.09.pdf
Oops, it was not written by Anthony so he can’t edit the text.
Anyone can guess the ice extent. It’s easy- just make something up
like everyone else…. http://www.arcus.org/SEARCH/seaiceoutlook/outlook_submission.php
Anthony,
Re temp at N pole (approximately!), note that the usual beginning of the year is around -20C but in 2008 it was -27C and in 2009 it was -30. I would add these and other years to the post to show the trend (it shows not just in the single temp at the beginning of each graph).
Jack Hughes (03:08:45) :
Silly question here: how do you report wind direction at the North Pole ? Every wind is from the South ?
I was thinking the same thing….
The engineer and 30% story…nice try
From NANSEN “Ice area is the sum of the grid cell areas multiplied by the ice concentration for all cells with ice concentrations of at least 15%.” Here’s link again if needed… read the top….
http://arctic-roos.org/observations/satellite-data/sea-ice/ice-area-and-extent-in-arctic
The water below the ice cap is always warmer.
When the autopsy of AGW is finally and critically done, it will be interesting to find out just how much of the model results were simply made up and tossed at the wall.