By Joseph D’Aleo ICECAP
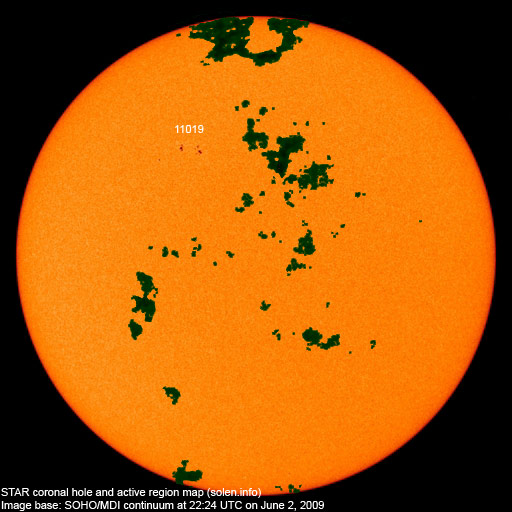
The sun has become more active in recent days with cycle 24 spots in middle latitudes. See sunspot group number 11019 for group of red spots. This is slightly diminished since yesterday. The dark green areas are coronal holes out of which the solar wind escapes at higher velocity.

See larger image here.
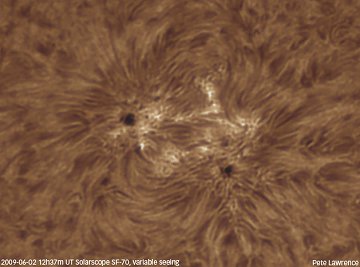
Peter Lawrence has a close up view of that sunspot posted on spaceweather.com.

See larger image here.
There is a loop of the sunspots develop and rotate around the solar disk the last few days here.
This activity came late enough in the month of May, to keep the monthly number for May below the value of 14 months ago of 3.2 which it is replacing in the 13 month running mean. That means the solar cycle minimum can’t be earlier than November 2008, making it at least a 12.5 year long cycle 23.
The value needs to fall below 3.4 in June to move the minimum to December. That is still possible if the sunspot group continues to decay as most have done as they crossed the disk in recent months. If it stays below that value, we will likely see the solar minimum in December, 2008 as 14 months before that the sun was very quiet with just a sunspot number of 0.5. If not, the minimum will be November. It is my guess that November will win the prize.
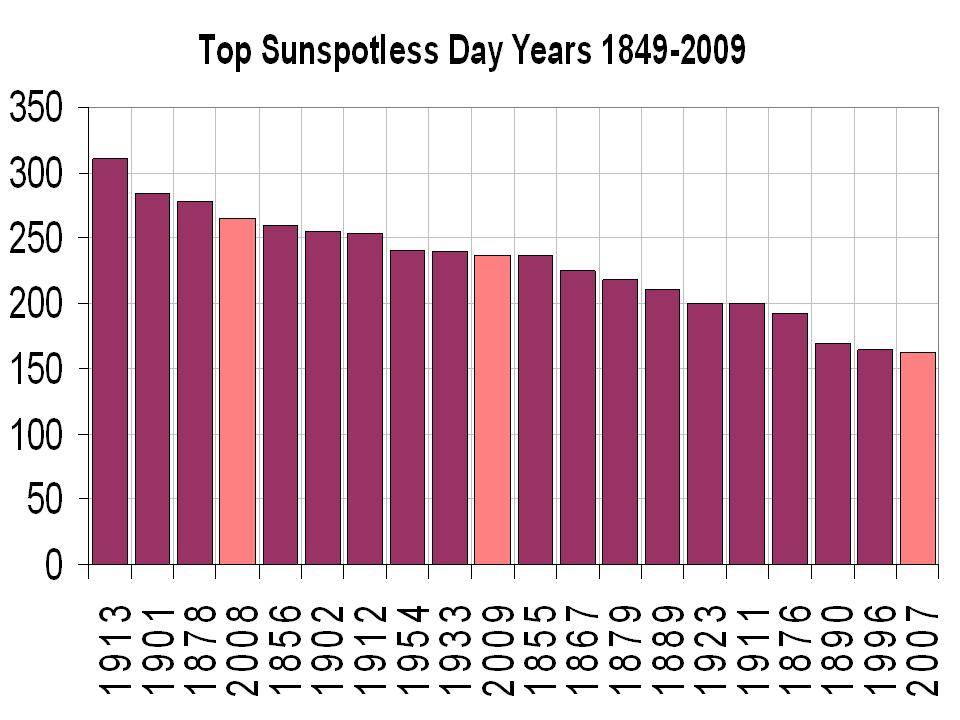
We added 22 more sunspotless days to the total for this cycle transition which as of June 1 had now reached an amazing 614 days. We are likely to add additional days and add 2009 to 2007 and 2008 as recent years in the top ten since 1900. Only the early 1900s had a similar 3 year stretch of high sunspot days (1911, 1912, and 1913).

See larger image here.
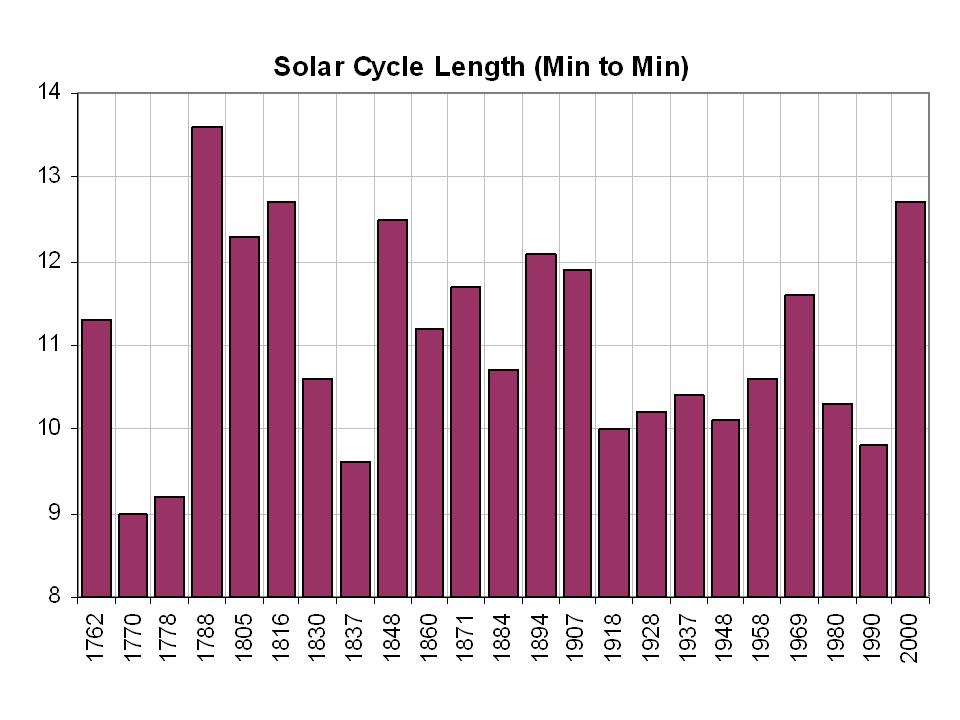
It also marks the longest cycle in 150 years, tying the one that peaked in 1848. You have to go back to the Dalton minimum in 1816 to find a longer cycle 12.7 years.

See larger image here.
You can see by the 12th year in 3 of the 5 most recent cycles, the sun had rebounded significantly by years 12 and 13.

See larger image here.NOTE: Updated per discussion in comments – Anthony
See what some scientists believe this means about the decades ahead here.
Discover more from Watts Up With That?
Subscribe to get the latest posts sent to your email.
David Miller (07:33:35) :
If I am correct that lightning promotion is probably an important consequence of cosmic ray ionization,
There is an electric field between the ground and the ionosphere high above: “the fair-weather field”. This is maintained by thunderstorms so there is definitely a connection. The problem with the cosmic ray modulation and weather/climate is that the modulation is only a few percent [depending on energy – more energy, less modulation] so even if cosmic rays provide ionization the variation of that is but small.
Funny to be accused of cherry picking when presenting global temperature anomaly maps to people discussing local temperatures. True enough, I really wonder what period could serve as a basis that people here wouldn’t consider as cherry picking. The global anomaly for 2009 is way above the last 10 years average (as shown on the site), I really can’t see how one could take a warmer reference timeframe…
BTW, the RSS anomaly for May is out now. You should read about it quite soon, since it’s lower than last month! I’m still wondering why the HadCrut April value has not been mentioned here… Oh, yes, it was high. So you’ll never learn about it.
REPLY: You know “Flanagan” I grow weary of your cowardly comments and your baseless accusations.
HadCRUT didn’t come to my attention, simple as that. I missed it. In case you haven’t noticed, I run a business, several websites, a blog, handle hundreds of comments a day, radio forecasts several times a day, and have a family with two young children that need my attention.
Oh, and a trip to China that I had to prepare for last month. No small task, having never been there. Have you ever tried to get permission to photograph a government facility in China? It’s not automatic you know.
Yes I missed reporting on HadCRUT, I also missed many other things during the last half of May. I put WUWT on autopilot for several days using prearranged scheduled posts and volunteer moderators while I traveled.
So sure, make up a conspiracy theory for why HadCRUT wasn’t mentioned, it suits you.
You don’t even have the integrity to use your own name so please don’t question mine until you do. – Anthony Watts
OT:
UAH in at .043 for May 09.
So, when will the cold arrive and how much change will we have? Or has it arrived?, if so, it’s still above normal?
just courious as to what everyone thinks, how much lag?
OT. UAH for May is out, and continues to fall away. 0.04 c
David Miller (07:33:35) :
…
Does anyone here know whether there has ever been an investigation of the possibility that cosmic ray-induced atmospheric ionization influences the prevalence of lightning?
The theory is “runaway breakdown.”
Google scholar also has over 30,000 citations for “runaway breakdown.”
UAH May 2009 Global Temperature Update +0.04 deg. C
Could someone explain this to me? When I look at the AMSU-A temperatures at http://discover.itsc.uah.edu/amsutemps/execute.csh?amsutemps using channel 05 like Dr. Spencer advises I see that the 2009 temperatures are quite a bit (relatively speaking) above the 20-year average for most of May. So how can the global average temperature anomaly for May 09 be +0.04 degrees C?
O/T but felt I had to share this.
http://uk.news.yahoo.com/18/20090604/ten-calling-earth-from-the-air-world-rel-1dc2b55.html
It was the following that has me in stitches:
“Shot from the air in a chopper, the environmental documentary will be available across the globe…”
I wonder how much of that horrid carbon stuff they put into the atmosphere shooting 488 hours of film in 54 countries over 217 days? The irony that the green movie is telling us how we only have ten years to save the Earth isn’t lost on me.
You couldn’t make this stuff up, could you…
Lief is absolutely correct. Joe needs to correct his graph. It makes his work look sloppy.
REPLY: I’ve sent a letter to him. I’m sure he’ll do so. – Anthony
deadwood (10:19:39) :
Leif is absolutely correct. Joe needs to correct his graph. It makes his work look sloppy.
Unless there is a hidden agenda and the work is meant to mislead, in which case it is not sloppy at all 🙂
But, Joe, correct that graph! Now!
REPLY: I’ve sent him a letter/email. I’m sure he’ll do so, – Anthony
pyromancer76 (08:52:00) :
Anthony probably has not returned; Joseph D’Aleo might be gone as well; but can’t the current moderator get to them in some way? Along with Leif and others, I have serious concerns about an obviously (? – needs Joseph D’Aleo’s input) incorrect graph remaining as part of the current post on The Best Science Blog.
That graph is wrong indeed.
Flanagan (22:48:20) : “Cold in New Zealand, in Northern states, hot in Europe, California, the Antarctic…”
Europe (western part) only had a warm april. Mei was little to warm in Netheland. June is now starting cold. But there is always a cold period in june in west europe whit clodey weather. Farmers use it to shave there cheeps so that they don’t get sun burned. Normaly this happens mid june. Forecast are still putting there marks on a dryer and warmer summer but I am sure that dryer keeps on going in the winter but then with freezing cold added.
Mr Watts – please don’t take it personally. I’m just surprised by the bias of the reports, though you probably don’t do it on purpose.
It is just a way for me to counterbalance the never-ending attacks on the mainstream media where, as some people say, only warm records are reported – which is completely false of course.
Some things amaze me, like the arctic extent thing. M. Goddard got all excited because the extent almost went back to normal during one or two weeks. Since then, a very rapid decrease of the extent was observed, so that it is now even below 2008. It was pretty impressive and instructive altogether, with greenland sea ice clustering in an unusual way. I’m just a bit disappointed he did not react to this…
REPLY: “…though you probably don’t do it on purpose. ” Great, replace the conspiracy theory insult with a new one, “lack of cognizance”. Class act there buddy.
You talk of balance. One blog (mine) that misses a report against hundreds of TV stations, newspapers, wireservices, where by you own admission, “only warm records are reported”.
Get a big warm anomaly, boom they explode with stories. No mention of the plummeting temperatures is early 2008 though, little mention of the severe winter temperatures and the late spring this year.
But you may be right, my lack of reporting HadCRUT may have been the blunder that could have turned into a global news scoop, since there doesn’t appear to be much in the news on it:
http://news.google.com/news?pz=1&ned=us&hl=en&q=May+global+temperature+Hadley
Gosh, I didn’t know my blog was so influential. – Anthony
‘I really wonder what period could serve as a basis that people here wouldn’t consider as cherry picking.’
How about the past 10,000 years, i.e. the whole Holocene?
Or is that too short a period of time?
“Southern California has definitely NOT been hot the last week. In fact we had rain yesterday, something that rarely happens in June. ”
El Nino coming on?
Leif Svalgaard (07:37:46) :
Basil (04:51:32) :
To those “confused” by Leif’s remark, he’s just pointing out that the graph doesn’t look right.
It beats me how anyone can be confused. It is not that graph doesn’t ‘look right’. It is that the graph is just wrong
Funny how it is hard to convey things in the medium. I meant to signify agreement with you, though I guess my “doesn’t look right” didn’t do that very well. The “confusion” arose, as I recall the way the discussion has developed, between your opening post, and latter posts with people saying that the 12+ years, or whatever. I think some were taking your opening remark to question the latter.
As to “quibbling over details,” that remark went to whether the length of the cycle was 12.whatever, not to whether the graph was right or wrong. I am not quibbling over whether the graph is right or wrong. I agree it needs to be corrected.
Record hot day in Seattle yesterday. Though we’ll be cooling down again in the next few days, and will be in the mid 70s for the next week. Perfect weather.
Of course none of this has to do with sunspots (or lackthereof), but with ocean and wind currents moving stuff around. Sometimes that stuff ends up on land where it gets in the news, other times it stays out at sea where no one cares.
Nothing to see here, especially globally.
What is hot and what is not? A complicated question. Here is a snippet from the April summary of the Office of the New Jersey State Climatologist.
“The last week [of April] brought a four-day 90° heat wave to much of the state, one of the longer such April events on record.
Yet in spite of the wide swings in weather, the monthly statewide mean temperature of 51.9° was just 1.4° above average. Without the heat wave, the month would have been about a degree below average (assuming those days had been close to average). Of course those four days cannot be discounted, thus April 2009 checks in as the 28th warmest of the past 115 years.”
In other words, the weather pattern that prevailed for most of the month was one conducive to cooler than normal temps, but the four-day heat wave resulted in temps so far above normal that it more than canceled out the below normal of the 26 other days.
That four day heat wave, by the way, was not accompanied by the oppressive humidity characteristic of such periods at the height of summer. If most of the predictions for the summer come to pass, we may not see such a prolonged period of 90+ again, which would make this Jerseyite for one very happy.
One other point: heat waves in early spring can result in higher temps than the equivalent pattern might later on in the summer, due simply to the sparser leaf canopy. Of course, the higher humidity characteristic of such patterns in July and August can produce more oppressive conditions at temps considerably lower.
OT: Oceans are on fire!
http://www.osdpd.noaa.gov/PSB/EPS/SST/data/anomnight.6.4.2009.gif
I know in SoCal deserts, we were slightly above average for most of May, but the last week we’ve dropped way down. Average high in this area is around 90 for this time, and the past week we’ve been well below that.
Rain yesterday (first time I’ve seen a winter storm like that in June) and the temp dropped to 58 and held that most of the day. Rarely we might have thunderstorm, but I actually saw snow falling up on the back side of Mt Baldy. Yes, I know weather does not equal climate, but we should be in the 90s for highs, not 70s.
DR (06:30:17) :
John Finn,
There hasn’t been any warmer period? On what do you base that, the Mann-o-matic treemometers?
Let me rephrase my earlier statement. There hasn’t been a warmer period for which we have actual thermometer measurements.
Basil (11:08:10) :
I agree it needs to be corrected.
The amazing thing is that some people think it should not be corrected…
I live in Phoenix, Arizona and read the Arizona Republic newspaper every day. It is the most read newspaper in Arizona, although circulation is rapidly declining. Not once in the past 10 years have they printed an article that was critical of AGW. I have submitted 11 letters to the editor that were critical of AGW and only 1 was printed. At least once a week they print letters that support AGW. They also print every idiotic AGW report sent to them by the Associated Press and never publish the science that refutes them.
Mr Watts, by “don’t do it on purpose” I was meaning you don’t actually have any hidden agenda behind your reporting of news, nothing more. On the other hand, news of a quite cold winter have been reported everywhere, including mainstream media. The fact that Hadcrut results have not been reported widely is another proof that media do not “jump” on any occasion to show positive anomalies.
In the same way, there’s been almost no report on the early melting season in California (one month in advance) in the media, while it could have been a really great reason to (inappropriately) blame global warming. This dust-induced effect is however very interesting, did you hear about it?
Geoff Sharp (00:20:20) :
So its official, SC23 minimum has gone way past Aug 2008?
Of course. It happened months ago, it follows from the way the smoothing works.