By Joseph D’Aleo ICECAP
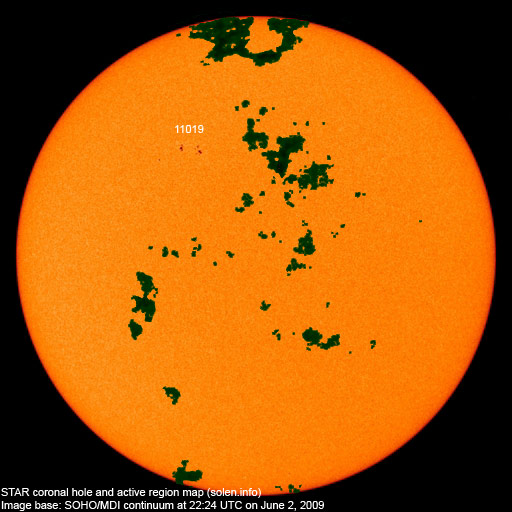
The sun has become more active in recent days with cycle 24 spots in middle latitudes. See sunspot group number 11019 for group of red spots. This is slightly diminished since yesterday. The dark green areas are coronal holes out of which the solar wind escapes at higher velocity.

See larger image here.
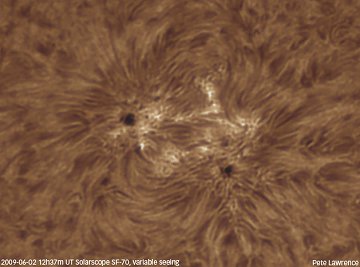
Peter Lawrence has a close up view of that sunspot posted on spaceweather.com.

See larger image here.
There is a loop of the sunspots develop and rotate around the solar disk the last few days here.
This activity came late enough in the month of May, to keep the monthly number for May below the value of 14 months ago of 3.2 which it is replacing in the 13 month running mean. That means the solar cycle minimum can’t be earlier than November 2008, making it at least a 12.5 year long cycle 23.
The value needs to fall below 3.4 in June to move the minimum to December. That is still possible if the sunspot group continues to decay as most have done as they crossed the disk in recent months. If it stays below that value, we will likely see the solar minimum in December, 2008 as 14 months before that the sun was very quiet with just a sunspot number of 0.5. If not, the minimum will be November. It is my guess that November will win the prize.
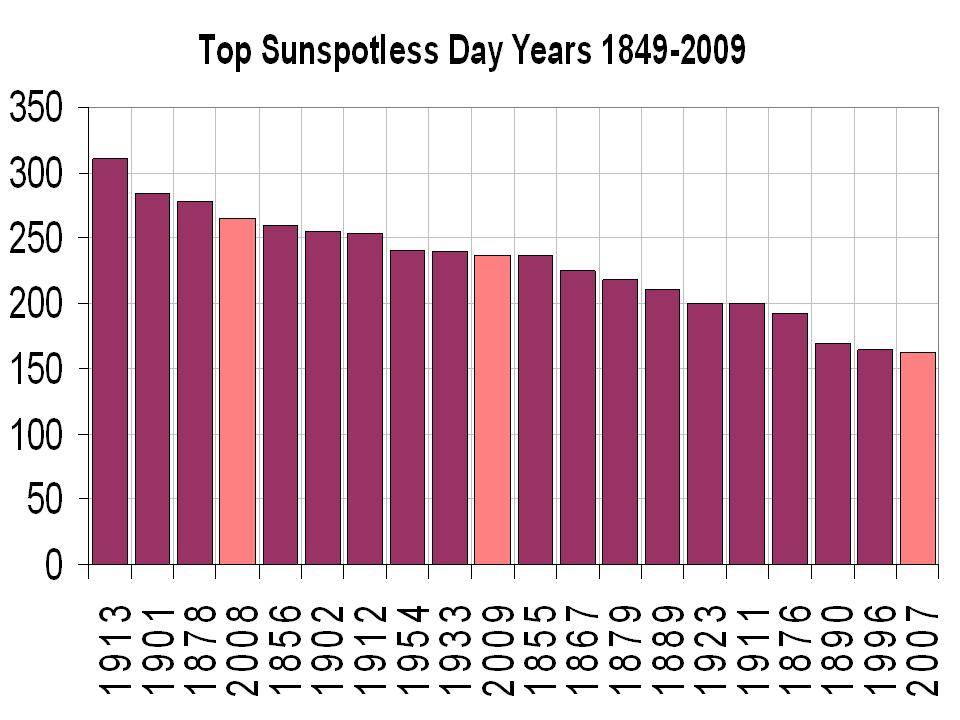
We added 22 more sunspotless days to the total for this cycle transition which as of June 1 had now reached an amazing 614 days. We are likely to add additional days and add 2009 to 2007 and 2008 as recent years in the top ten since 1900. Only the early 1900s had a similar 3 year stretch of high sunspot days (1911, 1912, and 1913).

See larger image here.
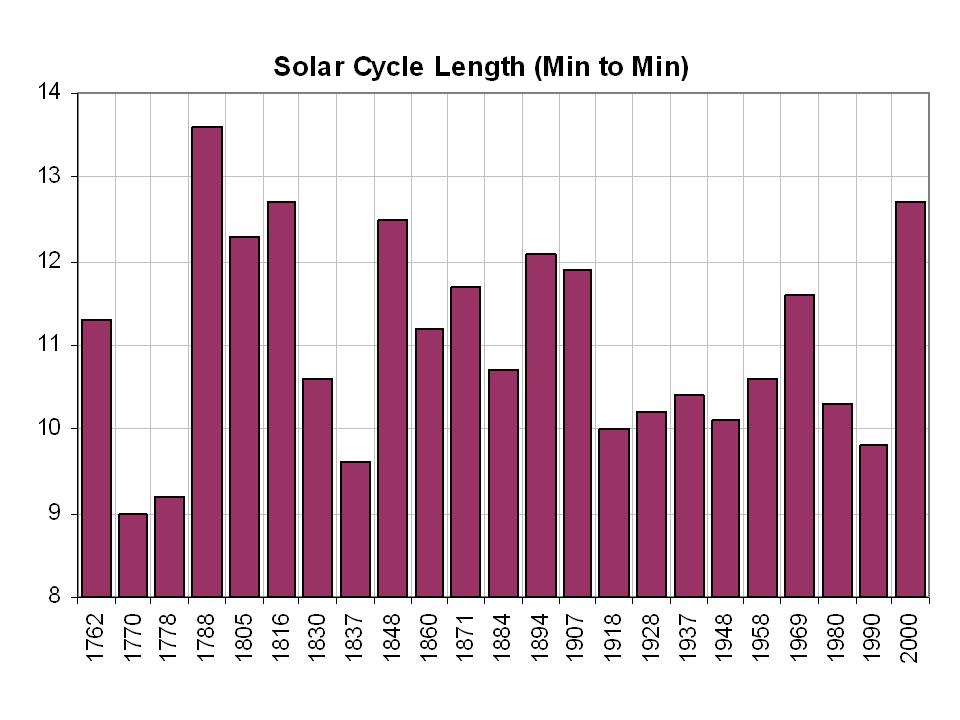
It also marks the longest cycle in 150 years, tying the one that peaked in 1848. You have to go back to the Dalton minimum in 1816 to find a longer cycle 12.7 years.

See larger image here.
You can see by the 12th year in 3 of the 5 most recent cycles, the sun had rebounded significantly by years 12 and 13.

See larger image here.NOTE: Updated per discussion in comments – Anthony
See what some scientists believe this means about the decades ahead here.
Discover more from Watts Up With That?
Subscribe to get the latest posts sent to your email.
Paul S:
“Shame that it is comparing the anomaly to much colder years of 1968 to 1996. Not really the big picture I was expecting Flanagan.”
Well, what were you expecting? This is Flanagan we are talking about! Not much to expect, just plenty of cherrypicking and ignoring of facts… just ask Denny et al at globalwarminghoax.com what they have to deal with!
Solar cycle 24 may well have started as some have said due to the arrival of this true sunspot but a while back I stubled upon this: http://www.solen.info/solar/cycl5.html
Notice that solar cycle 5, one of the Dalton Minimum cycles, began in May 1798 with a smoothed sunspot number of 3.2 and appeared to be rising nicely until May 1799 and then sunspot activity suddenly dropped and stayed quiet until after May 1800. Only when the smoothed sunspot number reached +-12 did the cycle creep up to solar max.
So we might, (big might), be having another scenario (such as in November 2008); a false alarm. The southern hemisphere has been dead compared to the northern hemisphere, so perhaps we should wait until BOTH hemispheres are cracking with more than one sunspot region each. Keep the shampagne in the fridge until the smoothed number is +- 10 and rising!
To those “confused” by Leif’s remark, he’s just pointing out that the graph doesn’t look right. The others, who have called attention to SC23 being 12+ years, based on a starting date sometime in 1996, are correct. If the last minimum was May 1996, and the current minimum is November 2008 as Joe has reasoned, then that is right at 12.5 years. But as some have said, there are questions about the “best” date of the last minimum.
We’re quibbling over details here. However you slice them, most recent cycles have been closer to 10 years in length, so SC23 was a break from the recent pattern.
It’s becoming ever more obvious that though the dynamo itself continues with regularity and with nearly even strength the phenomena of sunspots can vary dramatically and perhaps even unpredictably. I’m reminded of a Van de Graf generator where the manifestation of the spark can dance all over the surface even though the ‘dynamo’ of voltage difference remains about the same. Can the Iron Butterfly Wing of the half centimeter solar tidal movement be moving enough mass or somehow directing the manifestation of the sunspots on the surface of the sun? And then, even if it does, how does that change earthly climate. Well, if it’s not just TSI, but also UV, geomagnetism near the poles and ozone, too, besides the clouds then we may have enough mechanisms with natural feedbacks to the center to explain the absence of ‘tipping points’ or runaways to endless heat or cold.
===================================
With apologies to the shade of W.B. Yeats
The Second Coming (of the Dalton Minimum)
Straining and twisting on the solar disc
The sunspots do not heed the physicist;
Predictions fail, fond theories of the age
Fall by the wayside like some spotless plage
That rotates, impotent, out of our view
While Cycle 24 ‘s long overdue.
Surely some grand event is near at hand,
surely the solar minimum is at hand…
Cryosphere updated its Artic graph:
http://arctic.atmos.uiuc.edu/cryosphere/IMAGES/sea.ice.anomaly.timeseries.jpg
Also, RSS for May is out. 0.11 cooler than April at 0.09
Dave Middleton: If I understand what Leif’s saying, the problem with the presentation of SC23 on the graph is that its cycle does not start at 0 years like the other cycles. On the graph, SC23 starts in the last year of SC22. In other words, the graph shows a drop in Sunspot Number from year 0 to year 1. That drop was part of SC22, not SC23. The data for SC23 needs to be “slid left” one year.
OT:
May UAH temp anomaly is out: .04
http://www.drroyspencer.com/
John Finn,
There hasn’t been any warmer period? On what do you base that, the Mann-o-matic treemometers?
Good news from the Climate Conference held this week in Washington DC. Senator Inhofe says the Senate will reject the carbon cap and tax bill if it indeed gets to them. Says the supporters only have 36 votes. It was one year ago that the Senate rejected Warner-Liberman. They rejected Kyoto 93-1 I believe. He is entirely confident they will reject Markey-Waxman. He says if Obama uses the EPA endangerment finding they will tie this up in court for five years (just like the Democrats did to us). We have been saved! All this thrashing around is not going to go anywhere!
looks like the cooling persists…….
May 2009 Global Temperature Update +0.04 deg. C
http://www.drroyspencer.com/2009/06/may-2009-global-temperature-update-004-deg-c/
Interestingly, the NH and SH anomalies were the same value as the global anomaly, but the tropics have cooled quite a bit.
YR MON GLOBE NH SH TROPICS
2009 1 0.304 0.443 0.165 -0.036
2009 2 0.347 0.678 0.016 0.051
2009 3 0.206 0.310 0.103 -0.149
2009 4 0.090 0.124 0.056 -0.014
2009 5 0.043 0.043 0.043 -0.168
The sun is dying. That overlay image is going to make a great scare shot for someone, mark my words.
Glenn (01:10:08) :
I don’t follow. SC 23 started in May 1996, and that is how it is graphed. Dropping to 0 sunspots after official start doesn’t change that.
Minimum was in 1996 and should be plotted at year 0 as were all the other minima, not at year 1.
Dave Middleton (03:55:14) :
If the SC23-SC24 minimum falls in November 2008 and the NGDC places the SC22-SC23 minimum in May 1996…
Minimum fell in 1996 so 1996 should be plotted at year 0 [as all the other minima] and not at year 1.
Nothing wrong with NGDC numbers for cycle 23 or 24. Just Joe’s graph that is wrong, and disagreeing with another graph he has of the same.
Anybody can compute the length of the solar cycle using the smoothed sunspot number. One may have to exercise a bit of common sense. Here are the monthly numbers for the last minimum [the smoothed values are in the rightmost column]:
199511 1995.871 9.0 11.3
199512 1995.956 10.0 10.8
199601 1996.041 11.5 10.4
199602 1996.123 4.4 10.1
199603 1996.205 9.2 9.7
199604 1996.287 4.8 8.4
199605 1996.372 5.5 8.0 <=====
199606 1996.454 11.8 8.5
199607 1996.539 8.2 8.4 <——
199608 1996.624 14.4 8.3 <+++++
199609 1996.706 1.6 8.4
199610 1996.791 0.9 8.8
199611 1996.873 17.9 9.8
199612 1996.958 13.3 10.4
199701 1997.043 5.7 10.5
199702 1997.123 7.6 11.0
There are two local minima, marked by <===== and <+++++. From symmetry, I think the ‘best’ minimum is where the <—– arrow is, which is at year 1996.539. If the minimum this time around [as determined by an international group of experts – of which I happen to be a member] is at 2008.958, we get a length of 2008.958 – 1996.539 = 12.4. Similarly for cycle 20: 1976.372 – 1964.791 = 11.6. Calculating the length is not rocket science. My only problem with Joe’s figure was that the minimum year should be plotted at year 0 and not at year 1.
REPLY: I’ve sent Joe an email and asked for him to review your comments, thanks Leif.
Flanagan (22:48:20) : “Cold in New Zealand, in Northern states, hot in Europe, California, the Antarctic…”
Had three or so hot days in the UK reaching into the mid 20s C (current average would be about 18C) but now the temperatures have dropped by over 10C, same for most of north and central Europe. Forecasting night times of down to 3C if there are breaks in the cloud. Going to have to dig up my runner beans and bring them in at night. 🙂
This is a little off-topic, but Anthony no longer makes his email address publicly available, so I am posting this as a comment because I cannot ask him beforehand whether he thinks it might be suitable here.
Does anyone here know whether there has ever been an investigation of the possibility that cosmic ray-induced atmospheric ionization influences the prevalence of lightning? Everything that I have read about Svensmark’s work has focused on the influence of atmospheric ionization on cloud droplet formation, but after I was reading this blog a few days ago I realized that there should be atmospheric conditions under which lightning occurs when a higher cosmic ray flux produces higher ionization, but there is no lightning when the ionization level is less and all other conditions are the same.
The basic physical point here is that for an atmospheric voltage gradient of a given number of volts/meter, at a given pressure and humidity, there should be a critical concentration of ions/meter^3 such that an electrical breakdown of the atmosphere occurs only if the concentration of ions is greater than or equal to the critical value, because having more ions increases the probability that an ion or electron moving under the influence of the field will collide with a neutral molecule in a way that ionizes it, starting or continuing a cascade of ionizations that produces a plasma with sufficient conductivity to discharge the potential that started the process. This concept is of course the basic principle of the Geiger counter (and likewise related devices, such as the proportional counter, the spark chamber and the wire chamber), as Svensmark’s mechanism is the basic principle of the cloud chamber.
Thus, both date back most of a century as applications of physics knowledge to nuclear and particle physics instrumentation. I would not be surprised if, in journals like the Review of Scientific Instruments, there were decades-old papers in which the operation of these devices was analyzed in sufficient detail that if the papers were thoughtfully read the analyses could be extrapolated to atmospheric phenomena. This obviously could save some effort that might otherwise be spent in unknowingly repeating the earlier analyses in the course of quantitatively studying the effects of ionization on cloud formation and lightning occurrence.
It seems clear that in an area sufficiently close to the path of a lightning bolt, the ionization generated by the bolt hugely exceeds the ionization generated by cosmic rays. Thus, in a situation at a significant altitude above the local ground level, with sufficient potential energy in the form of a saturated or supersaturated atmosphere, so that the limiting factor for getting condensation is the availability of condensation nuclei, the occurrence of the first lightning bolt in an area could be expected to promote additional condensation, promoting upward convection and perhaps eventually additional lightning, continuing as long as there was sufficient humidity. In short, I am suggesting that a higher level of cosmic ray ionization in the atmosphere not only should promote cloud formation, as Svensmark has been saying, but also should make it easier for a cloud to become a thunderstorm, so that, in worldwide averages, they should be slightly more frequent or widespread during periods of low solar activity and consequent higher cosmic ray flux.
The whole process evidently promotes loss of heat from the atmosphere by transporting it higher, where there is lower infrared opacity (from carbon dioxide or any other greenhouse gas) for radiation traveling upward. This effect would be complementary to Svensmark’s concept that cloud formation enhances the albedo of the earth, thereby reducing the amount of sunlight that reaches the surface to be absorbed as heat for the terrestrial environment.
If I am correct that lightning promotion is probably an important consequence of cosmic ray ionization, then efforts to understand the influence of changing cosmic ray flux (and hence of solar activity) on climate will have to broaden their focus beyond current arguments over cloud formation, like the effort to discredit Svensmark reported on p. 576 of the May 1 issue of Science. Unfortunately, I am not in a position to do the quantitative work that would be needed to see if this speculation has any real value, so I hope that someone among the readers or contributors to this blog may have the time and other resources needed to pursue it further.
Basil (04:51:32) :
To those “confused” by Leif’s remark, he’s just pointing out that the graph doesn’t look right.
It beats me how anyone can be confused. It is not that graph doesn’t ‘look right’. It is that the graph is just wrong. You plot the minimum at year 0 whenever it was and the graph has it plotted at year 1. This is not a small quibble as you suggest. This is a HUGE thing as the visual impact is what lay persons take home. Why are we even discussing this? If I were Joe, I would just correct the graph and be done, unless there is a reason for knowingly pushing the wrong graph.
We have had a lot of days when a single weak spot has disrupted a spotless run for several days whilst it traverses the face of the sun.
It seems to me that the spotless day statistics are being unrealistically skewed by such events.
In theory two single weak spots, one on each face of the sun, if maintained indefinitely, would result in no spotless days at all and that would not accurately reflect the true level of solar activity.
The spotless day concept has it’s limitations.
According with J.Janssens “Based on raw data and smoothed evolution, solar cycle minimum seems to have occured in Dec 08 +/- 2 months”
My question had nothing to do with the arrival of summer, but rather what do these minimums mean. Can we expect the anomaly numbers to start increasing? Are we going to be seeing temperature increases again, so that Hansen’s prediction of 2009 being the warmest on record come true?
It looks to me like the cold sun is holding down global warming, and a warmer sun will reset the debate.
In line with Leif’s rational, each curve contains 13 bins, which is a bit misleading. Mr. D’Aleo has recycled values which gives the impression that all of the cycles are 13 years in length. For example, the last four values of Cycle 21 are identical to the first four values of Cycle 22. I guess we are all smart enough to figure it out, but Heaven help us if someone in the press starts to use the figure for some reason. I guess my point is that if Cycle 22 is ten years long, why extend the data to 13 years using data from the following cycle.
@Leif Svalgaard (07:23:41) :
Thank you for the explanation.
I’m not sure why he says “middle latitudes” as these are quite well above the equator, and thus C24 spots and not old C23 spots.
However, it is still a bit of a damp squib thus far, so let’s not count any chickens until the Sun lays few more spotty eggs.
http://sohowww.nascom.nasa.gov/data/realtime/mdi_igr/1024/latest.html
.
Anthony probably has not returned; Joseph D’Aleo might be gone as well; but can’t the current moderator get to them in some way? Along with Leif and others, I have serious concerns about an obviously (? – needs Joseph D’Aleo’s input) incorrect graph remaining as part of the current post on The Best Science Blog.
Also, CoonAZ (8:18) has a very important point about the ending of one cycle being continued on the graph past its minimum and turned into the start of the next cycle. “…The last four values of Cycle 21 are identical to the first four values of Cycle 22….Heaven help us if someone in the press starts to use the figure for some reason.”
REPLY: I’ve sent you an email. I always want to correct problems and oversights. I will most certainly correct it if it is in my purview, and I’ve asked Joe D’Aleo to review Leif’s comments. – Anthony
Dewpoints in the 50s in North Texas on June 4th. Temps in the 50s last night and not out of the 70s today even with the near-solstice level insolation.
Heavy rain and snow in the Sierras the last few days in California.
A strange spring to say the least.
David,
I think the heat loss from condensation and from freezing is at least as important as the albedo change.
Flanagan (22:48:20) : “Cold in New Zealand, in Northern states, hot in Europe, California, the Antarctic…”
Southern California has definitely NOT been hot the last week. In fact we had rain yesterday, something that rarely happens in June. Been colder than usual. Seems someone is tweaking the data again.