By Joseph D’Aleo ICECAP
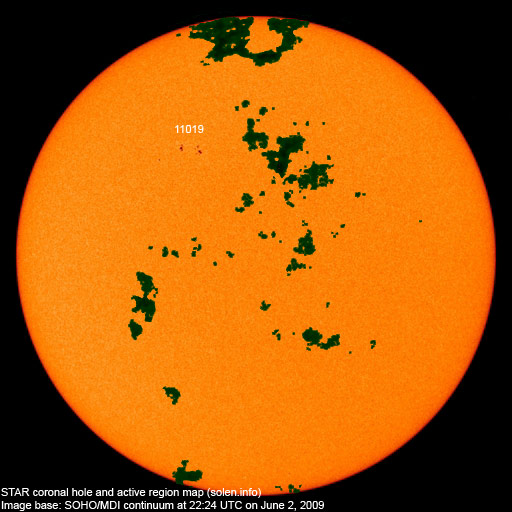
The sun has become more active in recent days with cycle 24 spots in middle latitudes. See sunspot group number 11019 for group of red spots. This is slightly diminished since yesterday. The dark green areas are coronal holes out of which the solar wind escapes at higher velocity.

See larger image here.
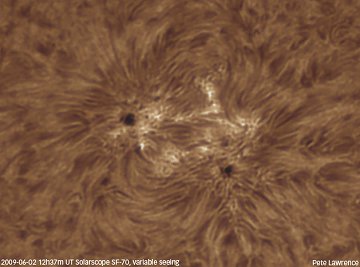
Peter Lawrence has a close up view of that sunspot posted on spaceweather.com.

See larger image here.
There is a loop of the sunspots develop and rotate around the solar disk the last few days here.
This activity came late enough in the month of May, to keep the monthly number for May below the value of 14 months ago of 3.2 which it is replacing in the 13 month running mean. That means the solar cycle minimum can’t be earlier than November 2008, making it at least a 12.5 year long cycle 23.
The value needs to fall below 3.4 in June to move the minimum to December. That is still possible if the sunspot group continues to decay as most have done as they crossed the disk in recent months. If it stays below that value, we will likely see the solar minimum in December, 2008 as 14 months before that the sun was very quiet with just a sunspot number of 0.5. If not, the minimum will be November. It is my guess that November will win the prize.
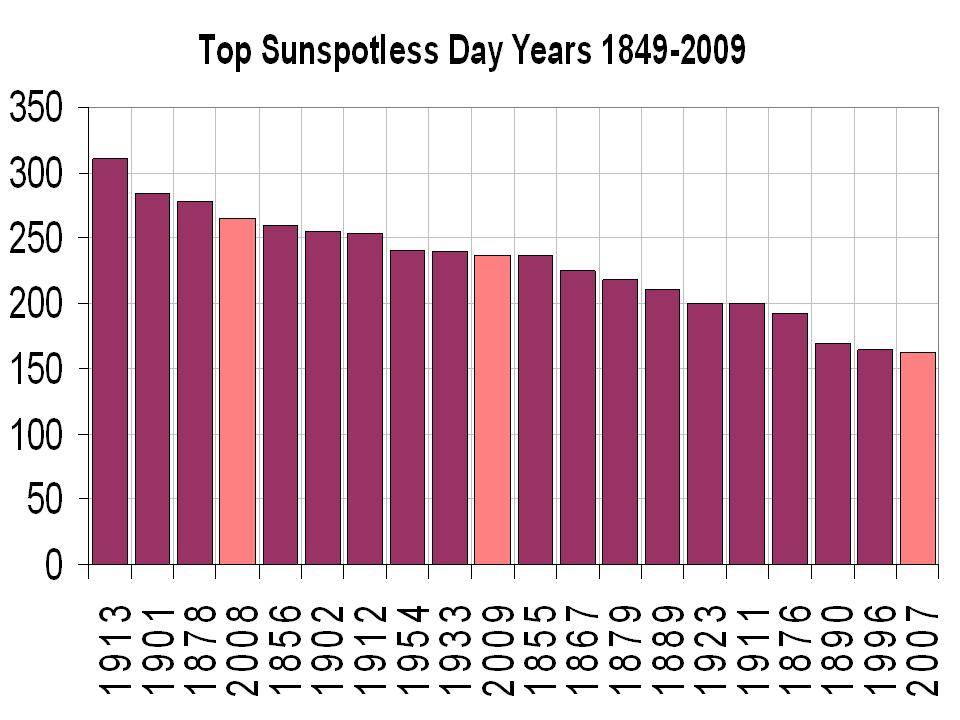
We added 22 more sunspotless days to the total for this cycle transition which as of June 1 had now reached an amazing 614 days. We are likely to add additional days and add 2009 to 2007 and 2008 as recent years in the top ten since 1900. Only the early 1900s had a similar 3 year stretch of high sunspot days (1911, 1912, and 1913).

See larger image here.
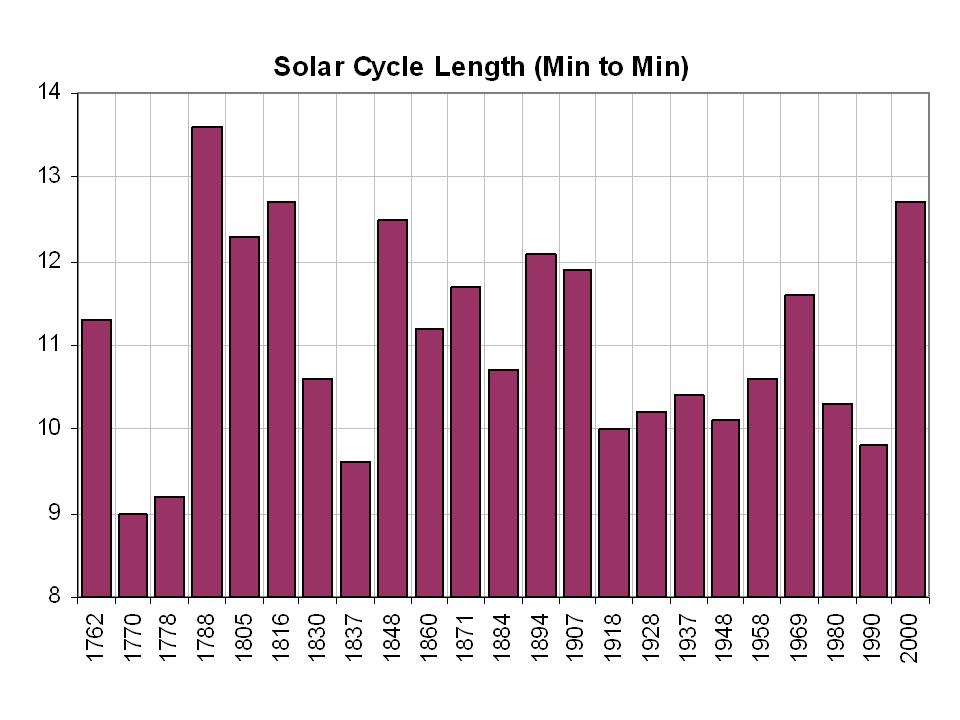
It also marks the longest cycle in 150 years, tying the one that peaked in 1848. You have to go back to the Dalton minimum in 1816 to find a longer cycle 12.7 years.

See larger image here.
You can see by the 12th year in 3 of the 5 most recent cycles, the sun had rebounded significantly by years 12 and 13.

See larger image here.NOTE: Updated per discussion in comments – Anthony
See what some scientists believe this means about the decades ahead here.
Discover more from Watts Up With That?
Subscribe to get the latest posts sent to your email.
markinaustin (21:32:47) :
so leif, are you saying we are only at 11.5 years? i am confused…i thought otherwise. would you mind clarifying?
It is not my graph. Ask Joe. He should correct the graph.
And another week of thunderstorms is in the forecast for No. California. Rained 2″ last night. Weather forecasters are scratching thier heads once again, as what was supposed to be 2 day of thunderstorms now runs into next week. Stuck weather patterns. At least it isn’t those darned winds.
Big thunder.
Cold in New Zealand, in Northern states, hot in Europe, California, most of the pacific ocean and the Antarctic. Check out this great site
http://www.climat-evolution.com/article-32112504.html
which, though in French, gives pretty good global temperature anomaly maps. Helps seeing the big picture.
John F. Hultquist (21:31:58) :
No problem, they’ll have Gore in there and the weather will go into an epileptic fit. It doesn’t like him or Hansen. It will be nature’s final warning to Congress.
Think they will get the hint?
multiple , heliocentric , planetary angular separation + ser-x cross positioning are the key elements to solar activity / atmospheric / seismic /Geo-phenomena,
angles are those equally dividable into the 360 deg circle , ser-x ( solar electromagnetic resonent cross ) positions are :-
( September 21 equinox ) = 75 – 165 – 255 – 345 degrees .
Flanagan (22:48:20) : “Cold in New Zealand, in Northern states, hot in Europe, California, the Antarctic…”
Flanalgan, hot in Antarctic? You are make joke. I laugh, ha-ha, at your funny joke. Here in south California, we have turned on furnace again all week. Thunderstorm, rain, cold, overcast, one of coldest Junes I remember. You think I follow your link? Think again.
Looking at the latest solar image, I don’t see a heck of a lot going on.
The first picture is icecap.us/images/uploads/SUN050603.jpg It shows a very active period of the sun, not the recent state of the sun. Why that?
So its official, SC23 minimum has gone way past Aug 2008?
Flanagan,
This French site claims that the temp anomaly for May is 0.52°C, making the annual 2009 anomaly thus far 0.42°C.
I don’t really know why the poles have been coloured such a deep red.
Leif Svalgaard (17:35:47) :
“Apparently it helps to start cycle 23 a year earlier to make it look longer than it really is:
http://icecap.us/images/uploads/Cycles19-23.jpg
One would think it better to place the minimum value reached just before cycle 23 at zero as you did for the other cycles, rather than at one to artificially increase the length of SC23…”
I don’t follow. SC 23 started in May 1996, and that is how it is graphed. Dropping to 0 sunspots after official start doesn’t change that.
The first sunspot of the cycle sometime back in a January somewhere in time was hailed as the start of what was to be one of the most active solar cycles. Since that time every tiny tiny dot has been hailed as the start of an upswing in said cycle. No offence folks but isnt active sunspot activity supposed to occur on both the northern and southern hemisphere of said sun?
It is a nice sunspot though.. one of the first ones i could see without having to clean my monitor but Im not holding my breath until I see more action then a small string of sunspots on one hemisphere of the sun:)
“We added 22 more sunspotless days to the total for this cycle transition which as of June 1 had now reached an amazing 614 days. We are likely to add additional days and add 2009 to 2007 and 2008 as recent years in the top ten since 1900. Only the early 1900s had a similar 3 year stretch of high sunspot days (1911, 1912, and 1913).”
Based on the published data of SIDC Belgium, I count as of Juni 1 a total of 630 spotless days (2004 3; 2005 13; 2006 65; 2007 163; 2008 265, 2009 121(May inclusive) for this cycle transition.
The provisional sunspot number for May was 2.9. The smoothed sunspot number for November was 1.8. We have to go back to September 1913 to find a lower one (1.6 according to the data of SIDC).
The year 1913 is well-known because of the long series of 311 spotless days. The cycle transition between SC14 and 15 counted 1019 spotless days! But Rmax (smoothed) of SC 15 was still 105.4 (SIDC).
vg (22:10:53) :
ladise and gentlemen corrected Arctic sea ice is now 100% normal Mayday!
http://arctic-roos.org/observations/satellite-data/sea-ice/observation_images/ssmi1_ice_area.png
keep for posterity someone
The recently renewed NSIDC graphs show a very rapid drop off in May down almost to 2007 figures.
Any explanation between the two data sources?
So SC24 has kicked off at last. I was half hoping for a record minimum just to naff off the warmists. Oh well…
😀
vg (22:10:53) :
ladise and gentlemen corrected Arctic sea ice is now 100% normal Mayday!
http://arctic-roos.org/observations/satellite-data/sea-ice/observation_images/ssmi1_ice_area.png
keep for posterity someone
Smallz79
Why are there red dots and what looks like red slashes or something in only the 2009 line?
Flanagan (22:48:20) :
Cold in New Zealand, in Northern states, hot in Europe, California, most of the pacific ocean and the Antarctic. Check out this great site
http://www.climat-evolution.com/article-32112504.html
which, though in French, gives pretty good global temperature anomaly maps. Helps seeing the big picture.
Shame that it is comparing the anomaly to much colder years of 1968 to 1996. Not really the big picture I was expecting Flanagan.
Here in christchurch new zealand NIWA are saying we had the 3rd coldest may on record at 6.9c . NIWA says on one of their pages that the 1971-2000 avg for may is 9.6c .But in their may summary they say its is 8.9c. i think they drop their 1971-2000 avg to make it look warmer than it real is .
Rhys, smallz79
Would not have a clue why. However notice how most of the second half of 2008 was normal as well! If I recall they had done a correction to the original trend at the time and a post was put up here WUWT. Maybe it was in fact correct. However, i would guess that it will be all changed in the coming days to fit in with the AGW so don’t get too excited
Flanagan is just a AGW hooligan (just joking)
Are the spots from May and June still following L&P’s trend?
Paul S (02:31:34) :
Shame that it is comparing the anomaly to much colder years of 1968 to 1996. Not really the big picture I was expecting Flanagan.
That’s the nature of global warming. You have to compare it to colder periods because there aren’t any warmer periods. What period do you suggest?
Hi all,
My spreadsheet indicates that cycle 23 was 147 months (12.25 years). This is calculated using the 13 month smoothed International Sunspot Number. Cycles 4, 6, 9 and 13 were longer. So, this is the longest cycle in over a century, but certainly not unprecendented. This assumes that Cycle 23 ends in October 2008 and cycle 24 begins in November 2008. I began Cycle 23 in August 96 as July 96 had a 13 month smoothed ISN of 8.4 and August 96 had a 13 month smoothed ISN of 8.1. This was the low, it recovered from there and did not look back.
I’d certainly appreciate any comments Leif might have, I believe my data is correct. Thanks to all for all of the thought provoking content.
Paul
the dashed red line in the Norsex charts was a failure of the sensors to read a vast area of ice for one day.
http://arctic-roos.org/observations/satellite-data/sea-ice/ice-area-and-extent-in-arctic
If the SC23-SC24 minimum falls in November 2008 and the NGDC places the SC22-SC23 minimum in May 1996…That makes it a 12.5 year-long cycle…The longest cycle since 1843…National Geophysical Data Center: MINIMA AND MAXIMA OF SUNSPOT NUMBER CYCLES
I realize that you are not a “consensus” person and you tend to look at things differently than many other solar physicists…A very good scientific trait in my opinion. You seem to think that the NGDC numbers are very wrong. Can you explain why you think “the consensus minimum determined by an international group of solar physicists” and Joe D’Aleo are wrong? (Hopefully in terms understandable to someone whose last physics and astronomy classes were in the Late Pleistocene.)
Btw…The NGDC cycle length numbers are the ones that I have been using for my Temp vs. Cycle Length comparisons.