By Joseph D’Aleo, CCM, ICECAP
May has been frigid slowing the planting and emergence of the summer crops in Canada. Late freezes and even snows are still occurring regularly and can be expected the rest of the month.

See larger image here.
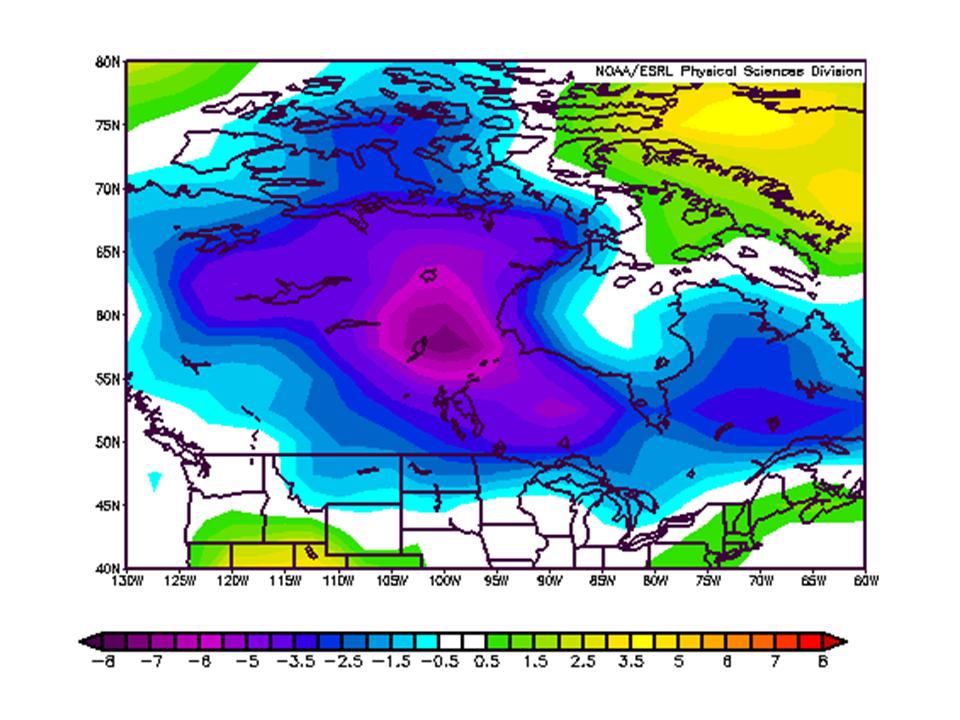
The chart above shows the May 2009 temperature anomaly through May 24th. Parts of central Canada (Churchill, Manitoba) are running 16 degrees F below normal for the month through the 26th (map ends 24th). Every day this month has seen lows below freezing in Churchill and only 6 out of the first 26 days days had highs edge above freezing. The forecast the rest of the month is for more cold with even some snow today in Churchill and again this weekend perhaps further south.
Hudson Bay remains mostly frozen though most of the seasonal melting occurs in June and July most years.
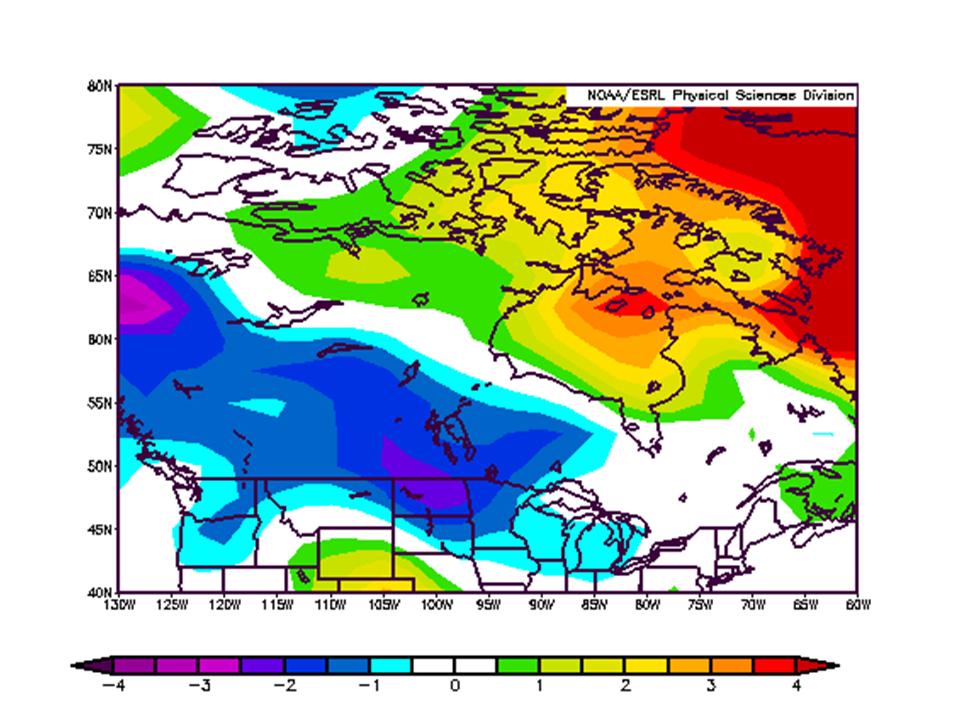
Parts of the south central region were also cold in April averaging 3-5 F below normal. The winter (December to March) was a cold one for southwest and central Canada but warmer in the far northeast.


See larger image here.
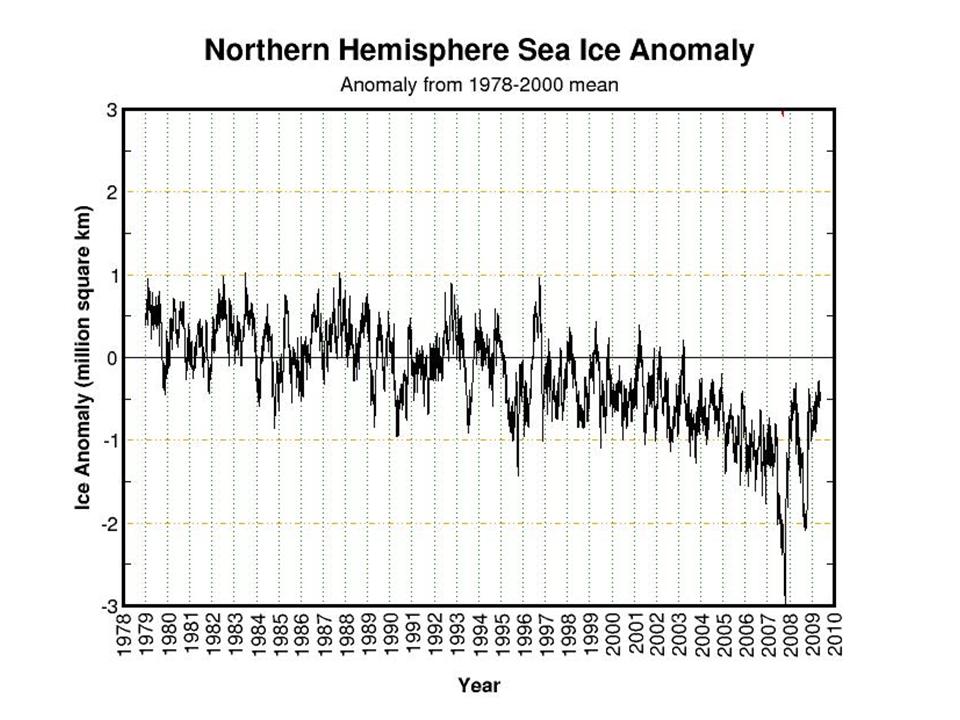
Meanwhile the arctic ice remains higher this data for any year this decade in a virtual tie with 2004.

See larger image here.
Given the polar stratospheric aerosols from Mt Redoubt, and a colder Atlantic and a continued cold Pacific, the recovery from the minimum of 2007 should continue this season.
The global data bases have large gaps in Canada, Africa, South America. So they will not reflect this in their global May anomalies as well as the satellites that see the entire surface – land and ocean excluding high latitude polar.
See pdf here.
May has been frigid slowing the planting and emergence of the summer crops in Canada. Late freezes and even snows are still occurring regularly and can be expected the rest of the month.

See larger image here.
The chart above shows the May 2009 temperature anomaly through May 24th. Parts of central Canada (Churchill, Manitoba) are running 16 degrees F below normal for the month through the 26th (map ends 24th). Every day this month has seen lows below freezing in Churchill and only 6 out of the first 26 days days had highs edge above freezing. The forecast the rest of the month is for more cold with even some snow today in Churchill and again this weekend perhaps further south.
Hudson Bay remains mostly frozen though most of the seasonal melting occurs in June and July most years.
Parts of the south central region were also cold in April averaging 3-5 F below normal. The winter (December to March) was a cold one for southwest and central Canada but warmer in the far northeast.

See larger image here.
Meanwhile the arctic ice remains higher this data for any year this decade in a virtual tie with 2004.

See larger image here.
Given the polar stratospheric aerosols from Mt Redoubt, and a colder Atlantic and a continued cold Pacific, the recovery from the minimum of 2007 should continue this season.
The global data bases have large gaps in Canada, Africa, South America. So they will not reflect this in their global May anomalies as well as the satellites that see the entire surface – land and ocean excluding high latitude polar.
See pdf here. H/T Climate Depot and Andy for the heads up
Canada Has a Frigid May after a Cold Winter By Joseph D’Aleo
May has been frigid slowing the planting and emergence of the summer crops in Canada. Late freezes and even snows are still occurring regularly and can be expected the rest of the month.
See larger image here.
The chart above shows the May 2009 temperature anomaly through May 24th. Parts of central Canada (Churchill, Manitoba) are running 16 degrees F below normal for the month through the 26th (map ends 24th). Every day this month has seen lows below freezing in Churchill and only 6 out of the first 26 days days had highs edge above freezing. The forecast the rest of the month is for more cold with even some snow today in Churchill and again this weekend perhaps further south.
Hudson Bay remains mostly frozen though most of the seasonal melting occurs in June and July most years.
Parts of the south central region were also cold in April averaging 3-5 F below normal. The winter (December to March) was a cold one for southwest and central Canada but warmer in the far northeast.
See larger image here.
Meanwhile the arctic ice remains higher this data for any year this decade in a virtual tie with 2004.
See larger image here.
Given the polar stratospheric aerosols from Mt Redoubt, and a colder Atlantic and a continued cold Pacific, the recovery from the minimum of 2007 should continue this season.
The global data bases have large gaps in Canada, Africa, South America. So they will not reflect this in their global May anomalies as well as the satellites that see the entire surface – land and ocean excluding high latitude polar.
See pdf here. H/T Climate Depot and Andy for the heads up.
.Discover more from Watts Up With That?
Subscribe to get the latest posts sent to your email.
Whilst in the UK: “Tourism bosses in Bournemouth have accused the Met Office of costing the resort millions of pounds in lost revenue after forecasters predicted thundery conditions on bank holiday Monday – which turned out to be the hottest day of the year.”
Bournemouth anger over Met Office’s bank holiday Monday forecast
Flanagan (23:51:16)
“US has had a positive temperature departure for the last month. Also, the global temperature anomaly (sic) went up”
Warming temperatures?? That is just weather.
Richard deSousa (20:05:41) :
One thing that might be worth looking for, especially if the weakening La Nina lets the jet stream become more zonal (west-east), is the latitude of the jet stream. While I was writing my summary of 1816 in New England (our Year Without a Summer), I concluded that the jet stream was further south than normal. While there were several warm periods, there were also strong cold fronts, storms, and crop liking freezes. OTOH, there wasn’t a freeze during apple blossom season and the lack of insects let them have a very good crop.
Meanwhile, places like Virginia had more moderate weather, though it’s a little hard to tell – a general cold snap that brings disaster to New England wouldn’t be a freeze in Virginia.
I don’t know if there’s enough data lurking around to create weather maps of that summer. Good project for a weather historian.
So, if Mt. Redoubt’s ash and aerosols cool the Arctic, that could lead to a more southern jet stream track, and that might show up best at ground level in the temperatures just south of the usual summer track.
Just don’t be surprised if there are a couple heat waves that muddy the situation!
E.M.Smith (01:26:58) said :
Flanagan (23:51:16) : In case you wonder why only Alaska is shown:
Perhaps you could actually look at the graphs before posting your trollings? That’s Canada not Alaska. Alaska isn’t even on the maps.
That’s OK Flanagan, I suspect is a congenital condition. My wife, the Irish-Catholic Phi Beta Kappa, can’t identify the countries of Scandanavia on one of those geography-test outline maps. My guess is that there’s an Ageographic gene which affects the same population as gluten intolerance (“siliac” IIRC).
The most famous victim, of course, would have been Wrong Way Corrigan.
OTOH, if you have any savings whatsoever, I would suggest following Mr. Smith’s advice rather than betting on AGW.
As the old saying has it, if you want to make a milion dollars on the AGW theory, start with ten million.
Ric, unusual freezes and snow intermingled with sudden warmth only to return to cold in the upper half of the US usually means the Jet stream is in its more northern track. Damaging weather along the tornado and hurricane belt in the South usually means an El Nino positioned Southern track.
E M Smith, you need to create a blog post about your cold versus warm agricultural stock market. Fascinating. By the way, what are wine and hops futures doing?
in reply to:
Just Want Truth… (19:21:19) :
I’m wondering—was there confirmation on the cold record broken in Edmonton by -12C?…
…I’ll resubmit a link that was placed at the time: http://www.climate.weatheroffice.ec.gc.ca/climateData/almanac_e.html?timeframe=1&Prov=XX&StationID=1865&Year=2009&Month=3&Day=10
Mr. Gunter got one thing right it seems; it was a new record low for the month (at least since 1961), but only by 0.5 degree from -42.2 to -42.7C. He expressed it very poorly, as he gave the impression that the previous low for the month had been -12C warmer.
In fact, only the previous low for the date of March 10 had been -12C warmer.
Flanagan, you are not a very good student. Do you simply REFUSE to do any homework? Many people here initially swore up and down that the Sun was the cause of the variation. They have opened their minds (me included) to other more endogenous drivers because they DID THEIR HOMEWORK. And are now leaving you in the dust. I know. I know. Don’t feed the troll but trolls easily lose their interest in trolling and move on to other blogs they don’t like. Flanagan, I think, remains a stubborn student, like several who believe in the Sun as the source of these temperature pattern variations (to you Flanagan that means climate change).
One of the tables I look at in a La Nina/neutral trend with the jet stream continuing to loop are the record temperature data. In such extreme weather we are likely to see both cold and hot conditions. It is instructive to see records of such events. Compared to anomaly maps, it is more precise on a monthly basis because you are counting daily events, not averaging them.
The PDO index started to decline in 2001 based on least square slope analysis[ -0.0487 points /year.] It went completely negative in Sept 2007 and continues to go lower and now at -1.65
AMO index started to decline in 2003 based on linear trend analysis. It went negative January 2009 and now at -0.078
Both of these have historically had a major impact on Canadian weather and are close to the levels of the1960- 1970’s when cooler weather dominated and both indices were also negative [1964-1976]
Notice the May temperature anomaly for the Arctic seas. Isn’t it interesting that we don’t see a more than normal rate of ice melt pattern. Yet the temps are higher than normal. Anybody guess why? If you did your homework you will know the answer.
Pamela Gray
I liked your jet stream web page reference . I went back to December 2008 when British Columbia in Canada had all the severe winter storms and extra snow .You can see the northern half of the jet stream head north to the Alaska, NWT and Mackenzie Delta region and then back south to BC and the Prairie provinces bringing cold air south. It would appear that unless the potential El Nino conditions materialize and dominate late 2009 or early 2010, as some are predicting, if the PDO remains negative , there should be plenty of snow for the 2010 Winter Olympics.
This unique pattern of the jet stream also accounted for all the flooding from the extra cold and snow resulting in significant snow melts in the Red River and Fargo regions in the spring. These regions get one part of the jet stream coming directly across from Oregon / Washington state region bringing extra moisture and snow and also the northern part of the jet stream coming from the Canadian Prairie Provinces bringing extra cold air. These are extra acute during La Nina conditions and some time even under Neutral conditionds as we saw during the early part of 2009
Just Want Truth… (20:28:11)
Just to clarify info on the link: The Corps (USACE) is on of the most generous organizations in the world in making its technical, scientific and general information available.
I think they’re amazing and I’m Canadian
Pamela – special thanks for that squall site link – I did not know there was a jetstream archive – wish I had known earlier and now have little time to study it – so these are just impressions gained from looking at SSTs for the northern Pacific and north Atlantic – at Hadley Centre here in UK, and more recently, Anthony’s animations showing the storm tracks on WeatherAction. Firstly, the ‘loopiness’ seems to be a seasonal phenomenon also – the track straightens up in the winter across the Atlantic and seems to have shifted further south this last winter – bringing storms, floods and colder temperatures to Spain; I have tried to get the picture with the shift in the PDO – the SSTs shifted in October 2006, and up until then the storm tracks came across the warmwater pool up into Alaska (rainfall records show a long term wet/warm period over the last 30 years 1977-2006) – but then as the jetstream has shifted south Alaska doesn’t get the warmth and precipitation (and the Pacific has much less to give at this latitude) – this pattern will I think affect the flow of warm water into the Arctic via the Bering Sea (less), as well as clouds over the ice (up 14% from 1980-2000), and ultimately also, the inflow of warm water (less) from the warm (until the AMO shifts fully) Atlantic.
Charles Perry (US geological service) did some work on the PDO/jetstream/precipitation in the mid-West and you might want to check his papers. He thinks there is a feedback from warm surface waters to the jetstream and this affects the loops in the standing wave.
I would like to know what ‘straightens’ the track .
I presume you already know of Drew Shindell’s thesis that UV variability affects the polar vortex and the jetstream – and linked this to the Maunder Minimum when the jetstream seems to have tracked further south and straight for 100 years! Spain was cold and wet, the UK froze in the winter and rot set in in the summer.
Flanagan: the UAH anomalies are interesting as they show no obvious impact of the current solar minimum at 4.4km or the surface, and yes, 2009 is up on 2008 slightly, but if you go back to 1999 you will find that a 0.5C anomaly has persisted for 10 years without getting any bigger.
EM Smith: if a large number of people follow your advice and buy grain futures, this combined with the AGW-driven laws for biofuel current in the EU, will raise the price of grain to very high levels next year (coupled with the then obvious shortfall in yields). You will make a killing.
But in more ways than you may be aware. Over 70 countries depend on the northern hemisphere food surplus for Food Aid – they can’t feed themselves. Last year the World Food Programme, for the first time in its existance, ran out of money to replenish its stocks – because the prices were so high, and it asked for $500 million.
At some point in this ‘cooling’ process, the point will be reached where the poor will die in very large numbers – firstly because the prices are too high, and secondly, because nobody is exporting and the food simply can’t be bought.
I’m not a climate expert, I’m a math guy (an actuary).
So, I don’t have fancy explanations for the mechanics of solar forcing and its impact on jet streams and all that. But I can look at the data and paint a reasonable story.
I posted not too long ago about my updated correlation analysis between sunspot activity, cycle length, and temperature anomalies. That post is here:
http://digitaldiatribes.wordpress.com/2009/05/13/may-2009-sunspot-update/
My conclusion is not so much that the length of cycle matters in and of itself. It only matters because a longer cycle simply means there is a longer period of lower average sunspot activity.
According to my correlation analysis, it takes about 2 years for lower sunspot activity (12-month average) to have any discernible impact on temperature. An average below 60 leads to cooler temps, and an average above 100 leads to warmer temps. There seems to be some level of average activity where you don’t get additional warming – about 160. This would make sense if the reason is a disruption of cosmis ray activity – if 160 is the point of major disruption, then additional activity wouldn’t matter.
The data shows that high sunspot activity warms things much faster than low activity cools. Makes sense. Thus, in a shorter cycle, there isn’t enough time for the offsetting cooling to occur before heavy activity occurs, and warming picks up from an already elevated level. It takes quite some time, then, of low activity (<60 annual average) before we see cooler temps. First, it takes about two years to see any adjustment, and then the impact is about 0.1 degrees Celsius per year.
Based on when things dipped below an average of 60, we probably started seeing the impact of that only between a year or two ago. But this is a slow process. It is not going to happen in large leaps. If the next cycle is very weak, then we will see a very noticeable change over the next decade+.
I'd also like to point out a couple other posts I've made that I think have some value. The first is a best-fit approach of sine waves to the HadCrut data. I think it speaks volumes in itself of the cyclical nature of the data:
http://digitaldiatribes.wordpress.com/2009/02/10/deconstructing-the-hadcrut-data/
It's a couple months old, but there is a clear cyclicality that can be identified. The implications to the future are shown by extrapolating the waves forward. It is also not coincidental that the periods of the waves line up with a similar analysis I did with respect to the PDO and AMO oscillation patterns:
http://digitaldiatribes.wordpress.com/2009/02/02/a-closer-look-at-oceanic-oscillation-cycles/
All the data, and honest analysis, sure seems to present the conclusion that there seems to be some small, long-term warming trend, but the majority of shorter-term trends can be explained by a combination of Ocean cycles and Solar cycles. Again, this is just a look at data. I'm sure smarter people than me can explain why the data is not telling the proper story. I kind of hope they are wrong, because right now all the data analysis and extrapolation points to a much cooler period over the next 20-30 years.
I'd be interested in any feedback on these analyses. I'm willing to accept that I am looking at things improperly.
About 3 months ago, after noticimg an unusual number of overcast days, I started to keep a little diary of observations. I walk my dog 4 times a day, with the first one being an hour shortly after dawn, and the last about 10:00 PM. I am also out usually near midday for other reasons. Thus I have ample observations of sky/cloud locally. I live near 30 degrees north latitude and 4 miles inland from the Atlantic Ocean.
Of the last 87 days, 71 have been fully overcast at least 80% of the day, and the rest have all had scattered cloud. There have been no clear days. Interestingly, 53 of the nights have been clear or slightly cloudy at 10:00 PM, and most mornings are clear overhead, but over ½ of these with clouds on the horizon in the direction of the sun at dawn. My guess is that most of these nights have been clear.
Most mornings, at near 1 hour after sunup, the sky sunward is clear, and the sun bright and warm. Then about 1&1/2 hours after sunup, the overcast begins to form, and is solid in about ½ hour. I am not a weather or climate expert, but can hypothesize that we have had a persistent cool upper layer of air, and when the sun begins to heat the surface, evaporation encounters that layer and forms clouds, which dissipate again when the lower air cools after sundown.
During the cloudy but not overcast days, I have observed no times when there was less than 50% (by eyeball judgment) cloud cover, frequently with very heavy clouds near the western horizon.
Compared to the last several years, this is no 3% increase in cloud cover. It is a large multiple, probably 4 to 6 times what I have taken to be normal, at least during the day.
It appears that we have had high reflection of insolation during the day and relatively unopposed escape of long wave IR radiation at night, a rather excellent formula for cooling. The icing on the cake is that my electrical bill has shown average monthly local temperature lower than last year by 4 to 5 degrees F for each of Feb/Mar/Apr. At least locally we have major cooling relative to last year.
Unlike Murray, I don’t see anything unusual about the cloud cover or precipitation. It’s just colder. Since discovering http://landscheidt.auditblogs.com I have been preparing for the coming cold. Recently I moved 5 hours South so I should be able to preserve a tolerable climate of the upper region of marginal cultivation in the Canadian Praries (ie: get my fall and spring back instead of the brutal stark transition from winter to bugs).
I found one paper that studied the drop in the tree line in the Rockies during the Maunder Minimum so I wait for the glaciers of the Rockies to follow those in Alaska and start growing again. Hopefully they don’t reach the Icefield Parkway between Jasper and Banff before its all over in 30+ years.
One hopefull sign is excavations into ‘Buffalo Jumps’ like ‘Head Smashed in Buffalo Jump’, the colder periods were more Biologically Productive because the moisture is the restraining factor and more winter storage helps mitigate what is really an arid climate. I haven’t seen so many amphibians and other creatures I thought would be stressed under these conditions since I was a kid in the 70’s. I guess the species here evolved in the cooler conditions following the margin of the Boreal Forest with the retreat and advance of the ice sheets. Maybe the advance in strains of cereal grains along with the slightly elevated CO2 will mitigate this cold periods effect on agriculture here and all we have to tolerate is extended ‘cold snaps’ of -40 during the winter.
mkurbo, paul, dan lee etc: I don’t mind being called a “denier”, but couldn’t it be “denyer”, please? “Denier” is a measurement of the sheerness of ladies’ stockings, and my doctor says I mustn’t think about them at my age!
A slight thread creep but the Catlin 3 Stooges have this on their site.
Quote
“The Catlin project will continue – the priority being to ensure that the data so painstakingly collected is interpreted by the Survey’s scienists.
Pen Hadow and Ann Daniels are established speakers on the international circuit……..”
Oh dear…………
Flanagan (02:17:24) :
OK, so simply replace “Alaska” by “Canada” like the poster did and the rest remains the same. BTW, your long criticism of GISTemp is very funny, given that I was referring to UAH. But time will tell. We’ll see by the end of the summer if the sea ice recovered from last year…
Flanagan,
We know, even if hell freezes over you will still be writing love letters to Gore and Hansen.
It would seem the Hubbard Glacier has a long history of advancing when other glaciers retreat.
Not that I accept the AGW thesis but Hubbard may not be a good comparator. But hey I am just an interested thicky.
Trevor (13:20:32):
Thus falsifying the notion that global warming causes glaciers to recede.
Pamela Gray (06:25:40) : E M Smith, you need to create a blog post about your cold versus warm agricultural stock market. Fascinating. By the way, what are wine and hops futures doing?
I make a weekly posting of what I’m doing for anyone who cares. It includes my ag positions. This last week version is at:
http://chiefio.wordpress.com/2009/05/22/wsw-friday-may-22-2009/
Tomorrows (which may actually get done in the wee AM and technically be on Saturday…) will have a 29 in both places if I get the stub up before wordpress rolls the date over on me…
The interest in solar cycles and warm / cold as market predictors has a long and storied history (i.e. it isn’t just me) starting around the time of Stanley Jevons who did work on it (studied decades of grain data from India and elsewhere in “the Colonies” and even invented an early calculating machine – the “Logic Piano”) I’m just moving the pebble a bit further along the road.
Warm vs cold is only one of the trade themes I’ve got going at the moment (albeit one thats working best…). BTW, buy oil too. PBR Petrobras is well positioned as are the Canadian oil trusts (though you get nicked for a 15% Canadian tax on the dividends). Non-US oils are “safer”. I expect some sort of US “profit tax” on the US oils… PCZ PetroCanada is cooking! (SU and IMO are stronger tar sands plays and bounce around more.) I presently own PBR and PCZ and wish I had some SU and IMO.
To the best of my knowledge, there are no exchange traded wine or hops futures. This site:
http://www.winex.com/cat-70-2008-Bordeaux.aspx
http://www.winex.com/cat-22-2006-Bordeaux.aspx
does not have a charting service that I can find, but it looks to me by inspection that prices are high and headed higher; with only one 2006 still available and the 2008 looking pricey already…
Italian wine futures are still a new idea:
http://www.winespectator.com/Wine/Blogs/Blog_Detail/0,4211,1178,00.html
And after a rocky time, it looks like Santa Barbara wine futures are being saved but still a personal contact niche :
http://www.independent.com/news/2009/mar/14/wine-futures-still-future/
But it’s a “delivery market” so you buy a contract and expect delivery of the product. I prefer to trade non-delivery (who want’s 1000 tons of pork bellys on their front lawn!) and frankly, with a wine futures delivery market I would drink all the profits… Discipline is the key to market success, and I don’t have the needed discipline for wine futures :-{
Per Hops, these folks don’t show it:
http://www2.barchart.com/mktcom.asp?code=BSTK§ion=softs
but I know hops futures exist. I would guess that it’s a thin market and more privately traded. Near as I can see we’re still coming down off a tight market in 2007 so a trade to the long side is probably setting up, but where to get charts and non-delivery contracts would be problematic. I have less of a problem with consumption of the delivery, though, as it isn’t “finished” yet 😎
This site: http://beeradvocate.com/forum/read/2060382
indicates storm damage recently to German hops production, so I’d expect high end specialty beers and hops to be going higher…
Wheat rice and corn are going up:
http://www2.barchart.com/mktcom.asp?code=BSTK§ion=grains
But I can’t find a quote on barley there. It too is a smaller more specialized market. But these folks:
http://data.tradingcharts.com/futures/quotes/AB.html
show it going up. (Plan to plant more barley… it’s cold tolerant and you can always drink it if things get too bad 😉
That’s about the best I can do on hops and wine futures… But the cold in Canada says that barley is going up and so is wheat. Hops is a higher latitude crop (30 to 70 degrees lat?) so ought to be cold influenced as well and the mid-European storms say higher prices, I just don’t see where a ‘home gamer’ can get a contract. You could always fill the basement with beer though… Did I mention I provide free financial consulting for beer 😉
Hope that helps…
Peter Taylor (08:15:46) : EM Smith: if a large number of people follow your advice and buy grain futures, this combined with the AGW-driven laws for biofuel current in the EU, will raise the price of grain to very high levels next year (coupled with the then obvious shortfall in yields). You will make a killing.
It is very important to keep issues of scale in mind. The grain futures are dominated by a few “whales”. Folks like ADM and Cargill. There is darned near nothing that any individual or collection of individuals can do to move the market (unless they are funded like Soros…). If I and everyone else who reads my blog and WUWT went out and bought a grain futures contract it would do exactly nothing to the market. We’re just not big enough.
Grain will move based on weather, government programs, and farmers production decisions. Buyers have a small impact but they tend to be more consistent. General Mills is going to make a certain quantity of corn flakes be the price $4 or $4.10 for a bushel of corn. The traders are nothing compared to the futures desks of companies like Kellogs, General Mills, ADM, and Cargill. So predict the weather and watch the government Ministry of Stupidity and get to think like a farmer…
I do expect to make a killing, but it will be as a trend follower not a trend maker. The trick is in proper prediction (not projection – never lie to yourself and trade…) of what the trend will be. Frankly, that’s about 1/3 of why I’m here. To hone my weather and crop prediction skills. (The other 2/3 is split between the AGW boondoggle and what it means for the economy and the way cool folks with brains who post here…)
So your statement is correct, but only if you remove the predicate about ‘folks buying futures”. They have no impact.
Also, realize that buying is only half the process. You also must either sell the contract or accept delivery. That’s why I like the ETNs – no delivery! If TOO many folks buy contracts and the price gets high from that, ADM and Cargill will happily sell you lots of contracts for “way high” prices — then force delivery or buy them back at way low prices… This market discipline is what prevents market manipulation. So when food prices spike up, please bear in mind that it is ultimately supply and demand, not “traders”. The trader can at most change when the equilibrium price shows up (moving the market faster) and not how far the market moves.
At the end of the day the trader must either sell the contract or take the grain. The grain ends up in the hands of producers and a market equilibrium happens. You just can’t change that. (Every so often you see these panic sellouts of contracts in the last couple of days before expiration as the folks who bought too high dump contracts like crazy to avoid having a zillion tons of wheat to sell on the spot market… Somehow this is never mentioned when folks talk about traders “bidding up prices”… )
Per poor folks and food: The poorest of the poor folks are cattle. When grain goes up the farmers take a long look at the feed bill for pigs and cows and decides to sell them now rather than feed for another 4 months. So meat prices temporarily drop (later to rebound if the reduced demand for feed does not lower grain costs). For this reason, COW often moves opposite JJG in the short run even if a very long term inflation play says meat will cost more in 5 years. COW hedges grain in the short run. What this means for poor folks is that as cattle are slaughtered, their grain is available for people.
The real fight is not between traders and poor starving people. It is between rich people eating steak, ham, and even BigMacs vs starving folks eating millet under oppressive confiscatory governments. I have not solution for that other than better governments in those oppressed folks countries. Governments that know it’s better to grow more than to fight over less…
(One example: In one country in Africa they are short of food. If you enhance the land with things like water infrastructure and fences, the government will appropriate it for the good of all and give you some crap land to start over on. Consequently nobody invests in infrastructure. Welcome to socialism 101 … They could feed themselves many times over under a system of property rights. Now they starve – but everyone is equal; except maybe the government employees … )
E.M. – I’m eternally grateful that you didn’t mention rice and beer in the same sentence.
PWL
I followed the link to your blog where you say;
“Personally I vote for an increase in global temperatures to say what it was 8,000 to 4,000 years ago during the Roman Age or even a little higher. Brrr… in Vancouver. – pwl
I think you meant to insert an ‘or’ after ‘4000 years ago’ as I don’t think you are claiming the Romans existed that far back.
All the best
TonyB