By Joseph D’Aleo, CCM, ICECAP
May has been frigid slowing the planting and emergence of the summer crops in Canada. Late freezes and even snows are still occurring regularly and can be expected the rest of the month.

See larger image here.
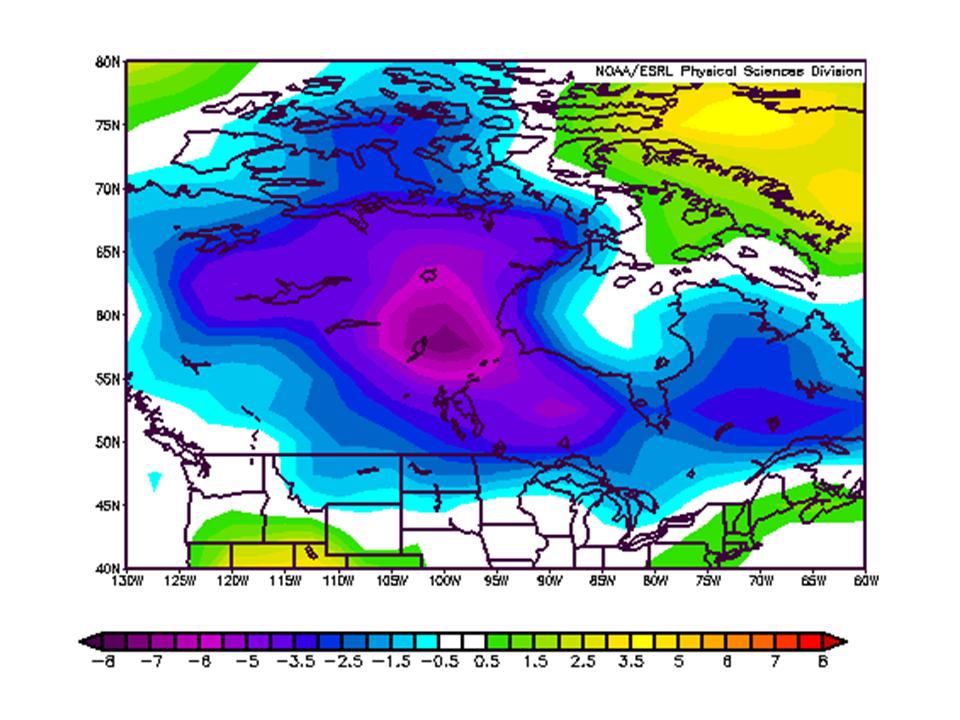
The chart above shows the May 2009 temperature anomaly through May 24th. Parts of central Canada (Churchill, Manitoba) are running 16 degrees F below normal for the month through the 26th (map ends 24th). Every day this month has seen lows below freezing in Churchill and only 6 out of the first 26 days days had highs edge above freezing. The forecast the rest of the month is for more cold with even some snow today in Churchill and again this weekend perhaps further south.
Hudson Bay remains mostly frozen though most of the seasonal melting occurs in June and July most years.
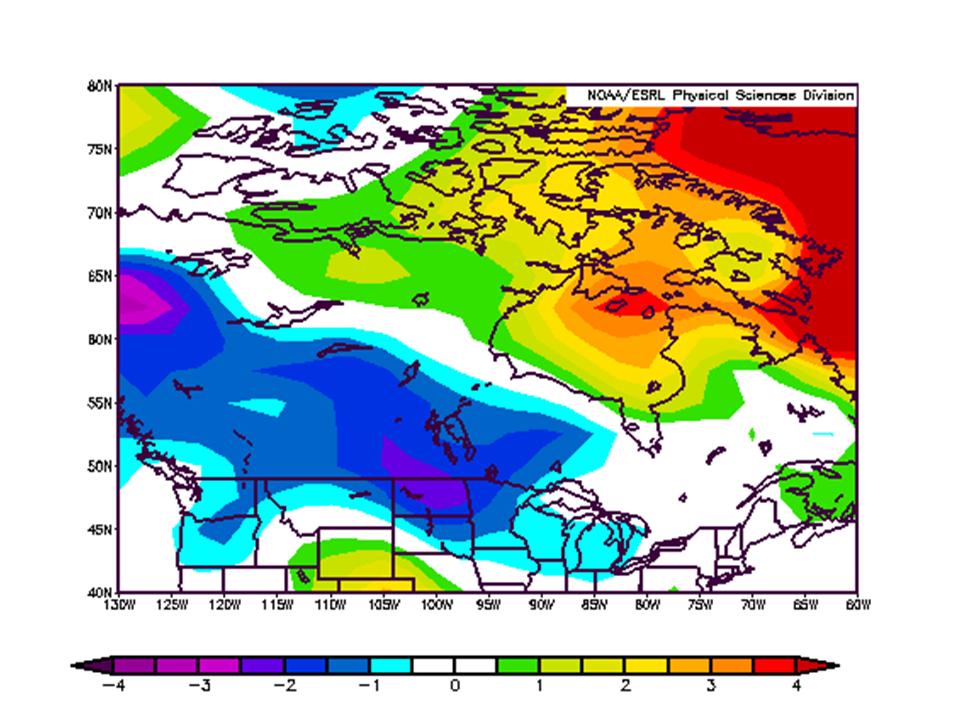
Parts of the south central region were also cold in April averaging 3-5 F below normal. The winter (December to March) was a cold one for southwest and central Canada but warmer in the far northeast.


See larger image here.
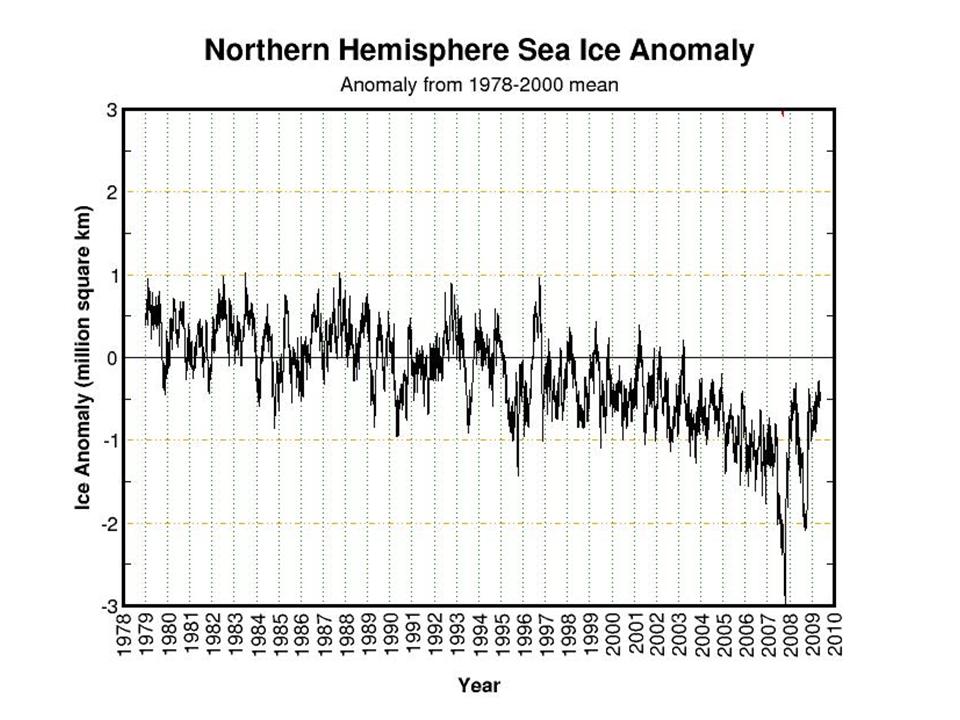
Meanwhile the arctic ice remains higher this data for any year this decade in a virtual tie with 2004.

See larger image here.
Given the polar stratospheric aerosols from Mt Redoubt, and a colder Atlantic and a continued cold Pacific, the recovery from the minimum of 2007 should continue this season.
The global data bases have large gaps in Canada, Africa, South America. So they will not reflect this in their global May anomalies as well as the satellites that see the entire surface – land and ocean excluding high latitude polar.
See pdf here.
May has been frigid slowing the planting and emergence of the summer crops in Canada. Late freezes and even snows are still occurring regularly and can be expected the rest of the month.

See larger image here.
The chart above shows the May 2009 temperature anomaly through May 24th. Parts of central Canada (Churchill, Manitoba) are running 16 degrees F below normal for the month through the 26th (map ends 24th). Every day this month has seen lows below freezing in Churchill and only 6 out of the first 26 days days had highs edge above freezing. The forecast the rest of the month is for more cold with even some snow today in Churchill and again this weekend perhaps further south.
Hudson Bay remains mostly frozen though most of the seasonal melting occurs in June and July most years.
Parts of the south central region were also cold in April averaging 3-5 F below normal. The winter (December to March) was a cold one for southwest and central Canada but warmer in the far northeast.

See larger image here.
Meanwhile the arctic ice remains higher this data for any year this decade in a virtual tie with 2004.

See larger image here.
Given the polar stratospheric aerosols from Mt Redoubt, and a colder Atlantic and a continued cold Pacific, the recovery from the minimum of 2007 should continue this season.
The global data bases have large gaps in Canada, Africa, South America. So they will not reflect this in their global May anomalies as well as the satellites that see the entire surface – land and ocean excluding high latitude polar.
See pdf here. H/T Climate Depot and Andy for the heads up
Canada Has a Frigid May after a Cold Winter By Joseph D’Aleo
May has been frigid slowing the planting and emergence of the summer crops in Canada. Late freezes and even snows are still occurring regularly and can be expected the rest of the month.
See larger image here.
The chart above shows the May 2009 temperature anomaly through May 24th. Parts of central Canada (Churchill, Manitoba) are running 16 degrees F below normal for the month through the 26th (map ends 24th). Every day this month has seen lows below freezing in Churchill and only 6 out of the first 26 days days had highs edge above freezing. The forecast the rest of the month is for more cold with even some snow today in Churchill and again this weekend perhaps further south.
Hudson Bay remains mostly frozen though most of the seasonal melting occurs in June and July most years.
Parts of the south central region were also cold in April averaging 3-5 F below normal. The winter (December to March) was a cold one for southwest and central Canada but warmer in the far northeast.
See larger image here.
Meanwhile the arctic ice remains higher this data for any year this decade in a virtual tie with 2004.
See larger image here.
Given the polar stratospheric aerosols from Mt Redoubt, and a colder Atlantic and a continued cold Pacific, the recovery from the minimum of 2007 should continue this season.
The global data bases have large gaps in Canada, Africa, South America. So they will not reflect this in their global May anomalies as well as the satellites that see the entire surface – land and ocean excluding high latitude polar.
See pdf here. H/T Climate Depot and Andy for the heads up.
.Discover more from Watts Up With That?
Subscribe to get the latest posts sent to your email.
Detailed report on Edmonton’s mid May 2009 snow storm is here: http://pathstoknowledge.wordpress.com/2009/05/19/its-weather-and-climate-20cm-of-snow-in-edmonton-area-may-19th-2009/ .
“I’m wondering if this is natures reaction to the quiet sun. Or some much larger mechanism also.”
Never noticed it until this year, but my Giant Sequoias are following the sun by bending themselves nearly a foot from morning until evening. At first I thought the ground had settled and the trees were leaning over.
Dunno about poplars, but I know that guys are planting spring wheat and Barley in Saskatchewan in the snow. That’s not particularly helpful. The ground isn’t warm enough to germinate seeds. Even if we WERE/ARE warming, we can deal with warming a WHOLE lot easier than cooling.
orbs
The folks over at National Geographic have announced that global warming is now audible:
http://news.nationalgeographic.com/news/2009/05/090521-global-warming-audible-hear.html
I wonder if all this cooling makes noise too?
Typo in your article?
The following doesn’t make sense: “Meanwhile the arctic ice remains higher this data for any year this decade in a virtual tie with 2004.”
Maybe you meant to write “Meanwhile the arctic ice AREA DATA remains higher this YEAR for any year this decade in a virtual tie with 2004”?
REPLY: I agree. It was written by Joe D’Aleo, so I can’t correct it for him but will notify him.
Mkurbo,
I prefer the term “Climate Naturalist” for myself, whenever it comes up (in my greenista town, it does). They hate that, but they can’t argue with it. “Oh, so you’re a global warm… er, I mean a climate change denier?”
No, the Climate’s been changing for 4 billion years, only an idiot would deny that. Ergo, I’m a Climate Naturalist.
Enough Canadians must have painted their roofs white.
hareynolds (19:26:42) : my guess is Buy Wheat Futures.
Yup. For those not into buying futures contacts, there are exchange traded funds (trade like stocks) that do the futures contracts for you. These are called ETN or Exchange Traded Notes funds. There are also mutual funds that hold different agricultural goods and even baskets of ag companies like seed and fertilizer makers. You can buy these in any stock account.
Right now, they look good. This chart shows JJG rising from lower left to upper right… (“MOO” is beating it, though 😎
JJG is a basket of grain contracts. Mix of wheat, corn (maize), soybeans
MOO has a combination of seed producers, fertilizer companies, etc.
COW has a mix of cattle, pork, and chicken futures (flat – feed costs up…) I left it off the chart. Not interesting at this time.
SGG Sugar is up nicely (I own CZZ, a Brazilian sugar grower / maker)
JO Coffee is up.
NIB Cocoa has been low, but just started a spike. Cold weather…
DBA is a mixed ag basket. Bit of everything, almost. Rising too.
WOOD (not on the chart) was rising nicely but has gone flat (housing starts not as good as expected) I sold my timber REIT PCL Plum Creek Lumber, but will buy back in on an upturn.
I’m planning to buy some JJG and either NIB or JO (folks are going to WANT that hot cup of cocoa or coffee…) I already own some MOO.
In summary, I’m already owning the inputs makers (takes more to make up for bad weather, and failed seeds means a re-buy), I’ll be adding some grain futures vi JJG and some warm beverage. The “cold trade” is on, and it’s working…
BTW, do not hold any long bonds for the next couple of years. The bond auction today had the 2 and 5 year hold up, but the rate on 10s and 30s was “way high”. Folks are not willing to tie up their money for 10+ years while the dollar is being buggered. If you MUST own bonds, own those in foreign currencies (Yen, Swiss Franc, Euro, Brazilian Real, and maybe UK Pound more or less in order) or TIP Treasury Inflation Protected Securities. Any other long duration U.S. bond is going to get creamed as the rates rise… (bonds sell for lower prices as the rate rises. Especially bond FUNDS, which unlike a single bond, never mature…
The jet stream (and ocean currents) distribute heat around our tiny planet.
The energy that is distributed comes from the sun.
I’d be interested to know if Anthony has any comment or links to comments regaerding the persistently low ap index.
Less energy = less heat.
mkurbo (18:53:09) :
Why are we the “deniers” and “skeptics” ?
I think we should start using the “natural cycle deniers” tag on AGW supporters…
I’m not a sceptic or a denier. I’m a realist.
In case you wonder why only Alaska is shown: most of the rest of the US has had a positive temperature departure for the last month. Also, the global temperature anoamly went up quite amazingly
http://discover.itsc.uah.edu/amsutemps/execute.csh?amsutemps+002
But why should we concentrate on a more global picture when we can focus on only one (close to the pole) state?
BTW, given the state of the ice thickness rightnow, nobody in its right mind would predict a large recovery of the Arctic. Maybe it will be a bit more that 2007, probably the same level as 2008, in other words some 30 years ahead of the most pessimistic predictions.
http://svs.gsfc.nasa.gov/vis/a000000/a003500/a003589/
but my guess is that is could be worse. The Greenland sea is very fractured, which could expose the perennial sea ice North of Canada to much more open water.
I know my Iris patch usually blooms around Easter and the flowers are usually gone by May. This year they bloomed in May and WOW did they bloom. The flowers are so big and three to a stalk.. so heavy that they are pulling themselves down. I think they like the extra Co2, or maybe the added rain. Its still chilly nites here but we are supposed to hit the 90’s tommorro. We shall see, because everytime they say its going to be warmer the clouds move in. Perhaps all that transported moisture from this winter is steaming off but I sure wish it would get warm already. I cant say its unusual to be chilly this time of year though. I have seen it snow as late as the middle of June here in Boise.
PS how did Chu’s last prediction work out. I bet CA is still planting and growing crops this year. Were running it down the ditch to them as fast as we can:P
Somewhat OT, but I urge everyone (particularly Brits) to have a look at this festering garbage from the BBC:
Climate Change:The Evidence
Is this really all they have? I love the claim that CO2 is the main greenhouse gas and the use of a fluffy (i.e. disguised) version of the Hockey Stick.
Don’t know what was wrong in the chart link. I’ll try it again. Here is the “very long form”:
http://bigcharts.marketwatch.com/charts/big.chart?symb=jjg&compidx=aaaaa%3A0&comp=dba+moo+nib+jo&ma=1&maval=50&uf=7168&lf=2&lf2=4&lf3=1024&type=4&size=3&state=15&sid=2913190&style=320&time=6&freq=1&nosettings=1&rand=7151&mocktick=1
andas a short click me
Guess we’ll see if I can get it right this time. WordPress sometimes does odd things with links full of ampersands…
Flanagan (23:51:16) : In case you wonder why only Alaska is shown:
Perhaps you could actually look at the graphs before posting your trollings? That’s Canada not Alaska. Alaska isn’t even on the maps.
I’ll assume the rest of your posting was of similar quality…
And as for the notion that it’s been abnormally warm, well, it’s been cold. I’m cold now. My tomatoes are not setting fruit due to cold nights. The AC has not been used at all. The heater has. Make all the pretty pictures you want from dancing in the error bands of calculated fantasies, it’s cold. And it’s not just Canada. New Zealand, Canada, Alaska, Peru, Australia, Afghanistan, Switzerland, etc. etc.
http://chiefio.wordpress.com/2009/05/23/south-hemisphere-record-early-snow/
Your anomalies are based on broken thermometers run through fantasy creating programs with badly formed calculations that violate the rules of Nyquist and of False Precision and are in many cases based on estimates of polar ice from broken satellite sensors. They are worse than useless. I’ve been through a lot of the code that creates the GIStemp anomalies and it’s junk. Complete, utter, worthless junk. I’m not going to bother putting up the links here, anyone who wants them can find them at chiefio.wordpress.com and see for themselves.
What is reliable, and clearly visible, is snow. Lots of it. Globally. It’s staying longer than expected in the north, and it’s arrived earlier than usual in the south. What’s undeniable is crops. They are being planted late, not sprouting due to cold soils, and not setting fruit. Grain prices show it isn’t a local isolated thing.
http://chiefio.wordpress.com/2009/05/04/argentine-drought-crop-failure/
So you can take your pretty pictures, and I’ll take facts on the ground. Yours are good for entertainment and scaring children. Mine will be used to invest very large sums of money, so they have to be right. So far, I’m making money on “the cold trade”. The Global Warming trade has been a dismal failure:
http://chiefio.wordpress.com/2009/05/20/the-market-votes-no-on-global-warming/
And that’s not my money, that’s the global traders market…
Pat (19:48:16) first snow in Iran in 100 years.
I can assure you there’s plenty of snow in Iran every year – there’s even ski resorts. Maybe a particular place in Iran had snow for the first time.
Pamela Gray @20:15:08
Brrrrr…. tha tmakes me feel cold.
Robert of Ottawa, Canada
Oh, and I should probably mention that FUD is a food basket, but JJG the grains is beating it (and it is fairly thinly traded, not much volume – it’s a new fund that’s trying to catch hold.)
So I’d stay with MOO, JJG, JO, and maybe a bit of SGG and NIB.
The cellulosics (WOOD, CUT, BAL {cotton} ) are not doing much ether, but they are more tied to economic rather than climate effects.
Oh, chart of FUD:
http://bigcharts.marketwatch.com/charts/big.chart?symb=fud&compidx=aaaaa%3A0&comp=dba+moo+nib+jo+sgg+jjg&ma=1&maval=50&uf=7168&lf=2&lf2=4&lf3=1024&type=4&size=3&state=15&sid=3150224&style=320&time=6&freq=1&nosettings=1&rand=6779&mocktick=1
These anomaly maps do a poor job of showing what farmers are actually up against. For example, one hot day, with temps +16, can cancel out six cool days with temps -2, and make a week look “normal.”
If you look a the records for Concord, New Hampshire, you can see that the four-day early season heat-wave at the end of April shifted the month’s anomaly to +2.6, which in some ways gives a false impression how mild the month was.
Also a lot has to do with how deeply the ground freezes, which has to do with how early a lasting snow-cover occurs. Snow, especially powder snow, insulates the earth. (Despite the fact last January was -6 of normal in New Hampshire, the snow did a great job of insulating the earth) (and also ponds, so incautious folk up from Massachusetts drove cars out onto thin ice and fell through.) While the ground froze 4 feet deep two winters ago, last winter it only froze 4 inches deep, which meant we could plant cold-weather crops early.
Warm-weather crops are another matter. Old-timers advised to skip the bother of planting things like tomatoes and squash until Memorial Day, (which was May 31 in the old days.) I should have listened, for frosts on May 19 and May 26 had me hustling about with tarps to cover plants, despite the fact May’s average low here is around 45 degrees, and the anomaly map shows we are .5 above normal.
Before anyone rushes off to plunk money down on wheat futures, they ought consult the farmers of Canada and the Dakotas. Those fellows are a tough lot who attempt to grow wheat at the edge of possibility, and usually succeed. Don’t trust anomaly maps alone.
http://chiefio.wordpress.com/2009/05/04/argentine-drought-crop-failure
Oh great … just as the US government is going to spend billions of dollars to increase further the price of food by subsidising ethanol production.
OK, so simply replace “Alaska” by “Canada” like the poster did and the rest remains the same. BTW, your long criticism of GISTemp is very funny, given that I was referring to UAH. But time will tell. We’ll see by the end of the summer if the sea ice recovered from last year…
Pat (19:48:16) :
Coldest winter in the UK in 30 or more years.
Err sorry – where does this come from? Over England and Wales it was the coldest since 1995/96 and over Scotland and Northern Ireland the coldest since 2000/01. The UK as a whole was slightly colder than 2000/01. Even with global warming at ~0.2 deg per decade a winter as cold as 2008/09 could be expected at least every ~10 years.
To add to my previous post (02:57:01)
There were a couple of winters in the 1990s and at least 4 in the 1980s which were much colder.
OT: AGW Alarmists increase carbon in red-light bedrooms !!!!!
As reported on Drudge.
“The global climate challenge may have been on the daytime agenda during the recent World Business Summit climate conference in Copenhagen, but in the evenings many businessmen, politicians and civil servants are reported to have availed themselves of the capital’s prostitutes……….
http://politiken.dk/newsinenglish/article719339.ece