That is a total of 365,000 high temperature records and 365,000 low temperature records. During the second year of operation, each day and each station has a 50/50 chance of breaking a high and/or low record on that date – so we would expect about 182,500 high temperature records and about 182,500 low temperature records during the year.
In the third year of the record, the odds drop to 1/3 and the number of expected records would be about 121,667 high and low temperature records.
In a normal Gaussian distribution of 100 numbers (representing years in this case,) the odds of any given number being the highest are 1 out of 100, and the odds of that number being the lowest are also 1 out of 100. So by the 100th year of operation, the odds of breaking a record at any given station on any given day drop to 1/100. This mean we would expect approximately 1000 stations X 365 days / 100 years = 3,650 high and 3,650 low temperature records to be set during the year – or about ten record highs per day and ten record lows per day.
This provides the news media lots opportunity to get hysterical about global warming every single day – even in a completely stable temperature regime. The distribution of temperatures is Gaussian, so it won’t be exactly ten per day, but will average out to ten per day over the course of the year. In a warming climate, we would expect to see more than 10 record highs per day, and fewer than 10 record lows per day.
In a cooling climate, we would expect to see more than 10 record lows per day, and fewer than 10 record highs per day. The USHCN record consists of more than 1000 stations, so we should expect to see more than 10 record highs per day. Throw in the UHI effects that Anthony and team have documented, and we would expect to see many more than that. So no, record high temperatures are not unusual and should be expected to occur somewhere nearly every day of the year. They don’t prove global warming – rather they prove that the temperature record is inadequate.
No continents have set a record high temperature since 1974. This is not even remotely consistent with claims that current temperatures are unusually high. Quite the contrary.
| Continent | Temperature | Year |
| Africa | 136F | 1922 |
| North America | 134F | 1913 |
| Asia | 129F | 1942 |
| Australia | 128F | 1889 |
| Europe | 122F | 1881 |
| South America | 120F | 1905 |
| Antarctica | 59F | 1974 |
http://www.infoplease.com/ipa/A0001375.html
Here is the code discussed in comments:
// C++ Program for calculating high temperature record probabilities in a 100 year temperature record

// Compilation :  g++ -o gaussian gaussian.cc

// Usage : ./gaussian 100

#include <iostream>

main(int argc, char** argv)

{

int iterations = 10000;

int winners = 0;

int years = atoi(argv[1]);

for (int j = 0; j < iterations; j++)

{

int maximum = 0;

for (int i = 0; i < years; i++)

{

maximum = std::max( rand(), maximum );

}

int value = rand();

if (value > maximum)

{

winners++;

}

}

float probability = float(winners) / float(iterations);

std::cout << "Average probability = " << probability << std::endl;

}
Those here who believe that pedantic arguments about semantics strengthen the case for AGW, are deluding themselves. All it indicates is their complete lack of skill at interpreting rhetorical techniques – like sarcasm.
crosspatch (16:12:01) :
No, it would not cause higher high temps because CO2 would also block inbound IR from the Sun during daytime. It would act to moderate daytime high temps but it would act to prevent radiative cooling. As a result, the atmosphere should heat up in the mid troposphere. It would get heated from the sun in the daytime and from surface radiation at night … but that isn’t happening according to the observations so we can just can the whole silly notion.
You are correct, sir — that’s what is supposed to be happening if AGW from greenhouse gas emissions is occurring. The highs don’t get higher, the lows get warmer.
Yet another inconvenient fact.
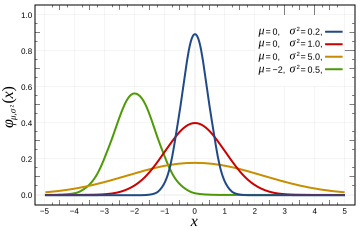
I agree with Leif. The variables used are not independent, so the author’s entire argument fails. Also, why does the article have pictures of Gaussian distribution when the type of distribution makes no difference to the author’s argument?
Scott B (06:46:43) :
Matt Bennett (22:30:03):
Mann’s reconstruction is far from “excellent and exhaustive” from what I’ve seen. A simple search of Climate Audit for Mann will show more than enough examples of questionable practices to cast his entire body of work into doubt.
Amen to that. Matt, if you have always accepted Mann’s work at face value, try starting here http://www.climateaudit.org/?p=2322 where McIntyre talks about the official reports on the subject.
Steve,
As Leif Svalgaard and one or two others have pointed out, your method is seriously overstating the likelihood of record events in a day. As Leif pointed out upthread, daily temp readings are not independent events, but your analysis assumes that they are. Temp readings on successive days aren’t properly Gaussian.
To take the simplest case, suppose that on a given day, a given station logs a moderate daily temp, near the long-term average for that day at that station. The next day is also likely to be close to average, and is much more likely to be close to average than close to an extreme for that day. Weather patterns don’t “reset” for the next day – the two days’ temps are not independent. This is where your analogy to a craps table doesn’t work – in that case, the outcome of each new throw of the dice IS independent of the prior game’s outcome – but this is not true for successive days’ temp readings.
(It’s interesting that you’ve shown the opposite of the “Gambler’s Fallacy,” where people mistakenly think of independent events as contingent. Hence the gambling mistake of thinking that black is “due” to come up at a roulette table after a few consecutive reds. With your analysis above, it’s reversed: treating contingent events as completely random.)
If your point is that there are lots of new temp records all the time, and therefore lots of potential fodder for selective reporting, then all you have to point out is, say, one record per week, or just a record high somewhere near the beginning of each season. But you’re weakening that point with your analysis. I would suggest correcting your analysis above, or finding some data about the actual incidence of records at existing stations over time.
Re Scott B (06:46:43) :
And remember McIntyre doesn’t profess to know whether there was a MWP or not. He is sceptical of the actual science.
“In a normal Gaussian distribution of 100 numbers (representing years in this case,) the odds of any given number being the highest are 1 out of 100,”—actually all we need is exchangeable random variables (in particular, this holds if they are independent and have the same distribution), the Gaussian assumption is not at all necessary
Top 11 Warmest Years On Record Have All Been In Last 13 Years
ScienceDaily (Dec. 13, 2007) — The decade of 1998-2007 is the warmest on record, according to data sources obtained by the World Meteorological Organization (WMO). The global mean surface temperature for 2007 is currently estimated at 0.41°C/0.74°F above the 1961-1990 annual average of 14.00°C/57.20°F.
The media will run with this headline, Big Al will quote it, and a gullible public will repeat it! Can you find the problem with it?
John Galt: the lows get warmer
I beg your pardon Sir, where do you live?, just in case, you know,..in Venus perhaps?
Lowest Recorded Temperatures *(From the same source)
Place Degrees Fahrenheit
World (Antarctica) Vostok –129
Asia Oimekon, Russia –90
Verkhoyansk, Russia –90
Greenland North ice –87
NA(excl. GL)Snag, Yukon, Canada –81
United States Prospect Creek, Alaska –80
U.S. (excl. Alaska) Rogers Pass, Mont. –70
Europe Ust ‘Shchugor, Russia –67
South America Sarmiento, Argentina –27
Africa Ifrane, Morocco –11
Australia Charlotte Pass, N.S.W. –9
Oceania Mauna Kea, Hawaii 12
Temperatures in a stable climate are a classic Monte Carlo problem. If you take a large set of daily readings from a large number of locations, they absolutely will behave as a random Gaussian distribution.
Any Monte Carlo problem has localized dependent effects, but they average out over the group and over time. The arguments people are making here indicate a lack of experience with normal distributions and randomness in large systems.
This is why I get twisted when I hear headlines like “The 27th warmest October on record”. When you consider that the record referred to starts in 1895, then that’s around the 76th percentile, or not really that unusual.
Steven Goddard (09:14:36) :
Temperatures in a stable climate are a classic Monte Carlo problem.
Except that the whole debate [‘climate change’] is because the climate is not stable. Never was, never will be.
jorgekafkazar (22:33:50) :
Ohioholic (19:49:07) : “I have often wondered myself if water vapor reflects energy from the sun even when clouds aren’t formed. I would love to have the time to find out, but that is just not possible for me right now. Anyone else know?”
Between 0.75 and 3.5 microns, there are 6 absorption lines in the water vapor spectrum. They are fairly thin, but perhaps through the magic of “broadening” as happens with CO² (according to some), they will become almost contiguous, thus blocking a significant amount of the incoming energy, maybe 30%. There’s still a lot left between 0.14 and 0.8 microns.
jorge, H2O has a great many more than just 6 absorption lines between .75 and 3.5 microns. There are more than I would care to try and count.
Check it out here: http://www.spectralcalc.com/spectral_browser/db_intensity.php
Leif,
Yes, but the primary point of this article is to demonstrate that even if the climate were stable, we would still have some record high temperatures being set nearly every day.
Global warming, is an average global raise in temperature by 1 degree, this however flucuates within diffeent regions of the blobe. But as we all know polar caps are melting, elevation in sea and ocean levels are rising at quite an astonishing rate, and wildlife are being reverted to either relocate to warmer, colder(if any) climates to adapt with this. The idea of record temperature have been set all during our lifehood as people. Records have been recorded since the time of Gallellao and continue to flucuate. Its earths own way of sustaining its homeostasis, but within these currents times, mankinds activities have exponentially given way to making it more impactful that we are now experiencing in climate change and change in earth temperatures.
Steve,
It’s not the distribution of temperatures across sites that’s the issue, it’s the dependence of two consecutive temp readings at one site. This dependency does not “cancel out” unless something unphysical is going on such as an inverse dependency in a later time period.
The idea of calculating the likelihood of record events is fine in principle, but your method is overstating the likelihoods (aside from other concerns such as stability across time).
I’ve been looking at the Central England Temperature data (as it’s where I live) that goes back to 1659. Specifically, the monthly average mean temperature. The early records are given as integer celsius degrees, so in order to set a record, a month needs to average around 1C higher or lower than the previous high/low. The month of September recorded 13C for each of the first 7 years, and didn’t set a record until the 8th year when it blipped up to 14C. The precision of the data is clearly a parameter that needs to be figured into any analysis of how likely a new record is. The monthly CET data shows a cluster of new record highs and lows in the early 1700s when the precision improves to 0.1C and the barrier to make a new record reduces significantly.
Anyhow, here’s some analysis, showing the total number of new record highs and lows (since 1659) set by monthly average mean CET data in each century (excluding the first bit, where new records were set all the time, of course). Also shown are the total expected number of records (both highs and lows) based on the simple Gaussian model described in this article.
In the C18th, 3 record lows and 25 record highs (expected 29)
In the C19th, 3 record lows and 6 record highs (expected 13)
In the C20th, 1 record low and 8 record highs (expected 8)
Since 2000, 0 record lows and 4 record highs (expected 0.5)
Of the record highs set in the C20th, three were set in the 1990s.
Ian,
What physical connection do you imagine there being between the temperature on April 28, 1910 and that on April 28, 1911?
It may or may not be true that there is a relationship between the weather on consecutive days in the same year, but that has no bearing on the April 28 record – where each element being compared is separated by at least one year from any others.
Matt Bennett: “What IS apparent after a careful look at his excellent and exhaustive reconstruction, using the best proxies available, is that right now we are way above the range within which these perturbations have been fluctuating, at least over the period he’s reconstructed. This is simply fact. It is accepted by all thinking climate researchers. Despite what you might have heard or read, the Mann graph stands firmly accepted as one of the most carefully compiled and studied products of science to date.”
Whenever I think that I might be able to have a conversation with an someone possessing an opposing AGW, I see statements like this and realize that the discussion will probably be more like religion rather than climate analysis. In no way would I describe Mann’s work as excellent or exhaustive. His selection of proxies appear to be arbitrary and convenient for him. His results depend upon selection of a couple of controversial proxies even though less controversial proxies exist. And his controversial proxies contradict available physical evidence. I consider myself to be a “thinking climate researcher,” so I have a very hard time with your declaration of universal acceptance. Our science would indeed be in a very sorry state if “Mann graph stands firmly accepted as one of the most carefully compiled and studied products of science to date.”
Adolfo Giurfa (08:46:10) :
John Galt: the lows get warmer
I beg your pardon Sir, where do you live?, just in case, you know,..in Venus perhaps?
Please re-read. I said the theory says the lows are supposed to get warmer. Is that not what the theory says?
Steven Goddard (09:48:13) :
Yes, but the primary point of this article is to demonstrate that even if the climate were stable, we would still have some record high temperatures being set nearly every day.
That goes without saying as it is blindingly obvious. Using dubious assumptions and incorrect statistics just weakens your case. And would be attacked by the AGW crowd should they care.
Matt Bennett (18:52:20) :
Ed says: “Nature is the norm…”
Now I don’t think anyone doubts that at all. The point is whether precautionary action should be taken to avoid terrible effects. Picture this: a 10km wide asteroid headed straight for Ed’s house (be that where it may). Though on geological times scales, this is absolutely normal, would Ed be standing in his garden beneath the growing shadow, uttering “Nature is the norm…” I think not. At the first hint of a possible collision, hopefully months to years prior, earth’s residents will be working on a solution to prevent the impact. This ain’t the Cretaceous any more and, maybe, we finally have a choice of whether or not to enter forseeable extinction events.
————————————————————-
Thanks, Matt, for not placing me at the epi-center of a 9.0 earthquake, which would be a much more likely scenario. On the other hand, in using a straw man argument, you do not change the fact that Nature is the norm. So, as creatures of Nature, we adapt to Nature or perish.
For your reading pleasure visit FAQs About NEO Impacts: http://impact.arc.nasa.gov/intro_faq.cfm.
“”” crosspatch (16:12:01) :
No, it would not cause higher high temps because CO2 would also block inbound IR from the Sun during daytime. It would act to moderate daytime high temps but it would act to prevent radiative cooling. As a result, the atmosphere should heat up in the mid troposphere. It would get heated from the sun in the daytime and from surface radiation at night … but that isn’t happening according to the observations so we can just can the whole silly notion. “””
Well there might be a good reason why; as you say, that isn’t happening.
First off, there is The simple fact that the first CO2 absorption band of any consequence is at about 2.75 microns. 97% of the solar radiation occurs below 2.75 microns; so that leaves only 3% that could be absorbed by CO2.
Oops there’s a complication; turns out that water vapor has an absorption band that goes from around 2.25 microns to about 3.25 microns; totally enclosing that 2.75 micron CO2 band. Given all the water vapor in the atmosphere, that doesn’t leave much of that 3% available for CO2.
The first CO2 band that actually occurs in a hole in the water absorptions spectrum is the 4 micron band. 99% of the solar spectrum is below 4 microns, so that means that there is only 1% of the soar spectrum which CO2 could absorb.
So your first postulate is false; CO2 does not block any significant amount of inbound solar radiation.
As to your second postulate that CO2 would act to prevent radiative cooling; there’s also some problems with that. Once again water vapor absorption again partially overlaps the CO2 15 micron band, and completely wipes out the long wavelength edge of the CO2 band. Admittedly the short wavelength edge of the CO2 band occurs where water vapor absorption is lower (but still around 30% or more. The other complication is that at the global mean temperature of about +15C, the peak of the surface emitted thermal radiation is at 10.1 microns; but at the higher daytime full sun surface temperaturews; which is when the principal radiative cooling of the earth occurs; that spectral peak has moved down to less than 9 microns, so CO2 now has no effect at the peak, and it is further down the long wave tail of the spectrum by the time you get to 15 microns; so the daytime effect of CO2 is considerably reduced.
The upper atmosphere may heat up; but more likely to be due to the ozone absorption at 9-10 microns; plus the water vapor absorption of incoming solar radiation. Approximately one half of the total spectral range from about 0.7 microns to 10 microns, is covered by about seven broad water absorption bands, that capture a significant percentage of the solar spectrum. About 40% of the total solar spectrum energy is included in this region covered by water absorption, so something in the 20% range of solar spectrum energy can be absorbed by water vapor versus about 1% for CO2 (max). An accurate accounting of the water absorption would have to treat each band separately since the solar spectrum tail spectral irradiance drops from about 0.7 of the peak at 0.75 microns, to about 0.0001 of the peak at 10 microns.
So yes crosspatch there’s a reason your scenario doesn’t happen; none of the effects you claim will cause it; are real.
George
Absorption spectra for water vapor, CO2, O2+O3 and any other GHGs are widely available on the web, so anybody can check my figures for themsleves. In addition you need a good black body radiation calculator or chart. The influence of water vapor on both solar absorption and surface thermal radiation are such that there is not much room for interlopers like CO2 to do anything significant; then there’s that cloud thing that trumps any effect CO2 could have.
Leif,
Incorrect statistics? You are starting to make me laugh now.