That is a total of 365,000 high temperature records and 365,000 low temperature records. During the second year of operation, each day and each station has a 50/50 chance of breaking a high and/or low record on that date – so we would expect about 182,500 high temperature records and about 182,500 low temperature records during the year.
In the third year of the record, the odds drop to 1/3 and the number of expected records would be about 121,667 high and low temperature records.
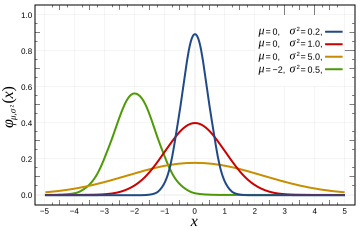
In a normal Gaussian distribution of 100 numbers (representing years in this case,) the odds of any given number being the highest are 1 out of 100, and the odds of that number being the lowest are also 1 out of 100. So by the 100th year of operation, the odds of breaking a record at any given station on any given day drop to 1/100. This mean we would expect approximately 1000 stations X 365 days / 100 years = 3,650 high and 3,650 low temperature records to be set during the year – or about ten record highs per day and ten record lows per day.
This provides the news media lots opportunity to get hysterical about global warming every single day – even in a completely stable temperature regime. The distribution of temperatures is Gaussian, so it won’t be exactly ten per day, but will average out to ten per day over the course of the year. In a warming climate, we would expect to see more than 10 record highs per day, and fewer than 10 record lows per day.
In a cooling climate, we would expect to see more than 10 record lows per day, and fewer than 10 record highs per day. The USHCN record consists of more than 1000 stations, so we should expect to see more than 10 record highs per day. Throw in the UHI effects that Anthony and team have documented, and we would expect to see many more than that. So no, record high temperatures are not unusual and should be expected to occur somewhere nearly every day of the year. They don’t prove global warming – rather they prove that the temperature record is inadequate.
No continents have set a record high temperature since 1974. This is not even remotely consistent with claims that current temperatures are unusually high. Quite the contrary.
| Continent | Temperature | Year |
| Africa | 136F | 1922 |
| North America | 134F | 1913 |
| Asia | 129F | 1942 |
| Australia | 128F | 1889 |
| Europe | 122F | 1881 |
| South America | 120F | 1905 |
| Antarctica | 59F | 1974 |
http://www.infoplease.com/ipa/A0001375.html
Here is the code discussed in comments:
// C++ Program for calculating high temperature record probabilities in a 100 year temperature record

// Compilation :  g++ -o gaussian gaussian.cc

// Usage : ./gaussian 100

#include <iostream>

main(int argc, char** argv)

{

int iterations = 10000;

int winners = 0;

int years = atoi(argv[1]);

for (int j = 0; j < iterations; j++)

{

int maximum = 0;

for (int i = 0; i < years; i++)

{

maximum = std::max( rand(), maximum );

}

int value = rand();

if (value > maximum)

{

winners++;

}

}

float probability = float(winners) / float(iterations);

std::cout << "Average probability = " << probability << std::endl;

}
“”” delecologist28 (09:54:57) :
Global warming, is an average global raise in temperature by 1 degree, this however flucuates within diffeent regions of the blobe. But as we all know polar caps are melting, elevation in sea and ocean levels are rising at quite an astonishing rate, and wildlife are being reverted to either relocate to warmer, colder(if any) climates to adapt with this. The idea of record temperature have been set all during our lifehood as people. Records have been recorded since the time of Gallellao and continue to flucuate. Its earths own way of sustaining its homeostasis, but within these currents times, mankinds activities have exponentially given way to making it more impactful that we are now experiencing in climate change and change in earth temperatures. “””
Let me guess; this is your first visit to planet earth-am I correct ?
We have on this planet, an extreme surface temperature range of approximately 150 deg C from a low of -90 to a high of +60. A smaller temperature range from -70 to +50, or 120 deg C occurs on earth every year , and that whole range can be found somewhere on earth during northern summers (all at the same time).
So just what significance would one deg rise possibly have in such a broad range. In any case; the global surface average temperature is of no scienticfic consequence whatsoever; it has no effect on anything; which is good, because we have no possible way of even measuring such an average.
Physical processes on this planet you are visiting, respond to actual real time values of physical variables. We don’t have any processes on earth that respond to the average of any physical variable over time and space; only the current local value affects the current local processes.
That’s why the polar caps aren’t melting; except when they are supposed to in summer, and the sea level is not rising at any rate that a rational person would call astonishing. We are killng off all the wildlife to make room for us, so no need to worry about relocating them.
And in our language fluctuate; which is similar to your word flucuate, tends to connote variation in both directions; up and down if you will.
It is nonsensical to talk of a record high temperature as “fluctuating” or flucuating either. Record high temperatures can only move in one direction; and that is up; they do not fluctuate.
Enjoy your visit; but do read some of our books so you can correct your incorrect assumptions about our planet and its idiosyncracies.
George
Steven Goddard (10:51:20) :
Incorrect statistics? You are starting to make me laugh now.
Statistics is two things. The actual calculation and the assumptions behind it. It is the latter that are incorrect. Laughing will not correct that.
Dear Steven, you might like to read Motl commenting on record breaking years in autocorrelated series, see
http://motls.blogspot.com/2009/01/record-breaking-years-in-autocorrelated.html
best
“”” D. King (08:42:31) :
Top 11 Warmest Years On Record Have All Been In Last 13 Years
ScienceDaily (Dec. 13, 2007) — The decade of 1998-2007 is the warmest on record, according to data sources obtained by the World Meteorological Organization (WMO). The global mean surface temperature for 2007 is currently estimated at 0.41°C/0.74°F above the 1961-1990 annual average of 14.00°C/57.20°F.
The media will run with this headline, Big Al will quote it, and a gullible public will repeat it! Can you find the problem with it? “””
Well noticet he date dec 2007; so please correct that to 11 out of the last 14 plus years. We should then notice that for some reason all of the 11 highest altitudes on earth occur up in the mountains. There must be some fundamental law about higher values occurring clustered around a maximum; and it is widely known from actual data that we just passed through a local maximum somewhere in the 1995 to 2000 time range.
But those reported high values are in fact not values of global temperature
but of “temperature anomalies”, such as reported by GISStemp; which has nothing to do with global temperatures; given that 73% of the earth’s surface is ocean water, and there aren’t a whole lot of weather stations strewn all over the ocean; like Hansen has distributed across the United States. To put it bluntly, there is no measurment network that has been in place for any significant period of recorded history, which is capable of determining the average temperature of the earth; not even of the average surface temperature oif the earth.
There are rules about sampling multivariable continuous functions so as to be able to reconstruct that continuous function from the recorded data samples. Failure to abide by those rules leads to corruption of the reconstructed continuous function; called aliassing noise; which IRRETRIEVABLY alters the function. The nature of this corruption is such that rather small transgressions can corrupt even the average value of that continuous function; making it indeterminate.
The nature of global temperature sampling regimens; is such that these rules are violated by orders of magnitude; so it is ludicrous to imply that gISStemp in any way represents the average global temperature of the earth; it is at most the average temperature of the specific set of locations which are measured by the GISStemp network, and even that is not assured because of errors in temporal sampling.
So maybe 11 of the last 14 years of GISStemp records are the highest on record; but please don’t refer to those records as “global” . They are at best local anomalies not global temperatures.
kuhnkat
You asking the good questions. There are a few more topics to consider about Heat & Thermodynamics at http://www.huris.com/web/cog/sci/phs/phy/c3409.htm.
It would be beneficial to the science of climatology to eliminate “green house” and “green house gases” from the scientific dictionary and replace them with atmosphere and atmospheric gases (atmospheric trace gases, ATG), respectively. As suggested before, the gases in the atmosphere and the gases in a legitimate green house are no different in makeup other than a possible depletion of CO2, due to growing green plants, inside the green house.
It is noted that NASA has removed the back-radiation from its “cartoon” of the Earth’s Energy Budget.
Leif,
You are going to have to better than that. What specifically do you believe is incorrect?
rafa,
I am not trying to do any analysis of trends in this article. The purpose is to demonstrate that even in a stable climate, we would still see lots of temperature records. Note that Leif agrees with this, saying it is “blindingly obvious.”
It may be “blindingly obvious” to Leif, but based on the comments from other readers, many appreciate a simple statistical explanation of why this occurs. One of the most prevalent flaws in science literature is that people tend to jump directly into detailed analysis without examining the validity of their core assumptions.
Ric Werme (05:48:33) Are the valleys warmer at night? Yes, in fact they are, every day. Watch the forecast for Aspen, Colorado at 7800 ft, compared to Glenwood Springs, CO at 5400 ft. The latter (GWS) is at the low end of a 35 mile long valley of which Aspen resides at the top, and is always 10-20F warmer, day and night. This is typical of anywhere I have seen in Colorado having lived here for 38 years. I’m at 6600 ft, but only 8 miles from Glenwood Springs. I use Aspen’s forecast for weather as it is closer to the actual temperature and weather events where I live although it is 25 miles away. If I drive the 4.5 miles down to the valley floor, it is 5-10 degrees warmer there than at my house.
Steve Goddard (12:08:28) :
You are going to have to better than that. What specifically do you believe is incorrect?
The assumption that climate is stable and that all data is drawn from the same distribution and that the data is random [e.g. without autocorrelation]. rafa’s link nicely describes the problem.
Steve,
Perhaps I carried on the day-to-day example too long? Consider that in your original set-up spacial correlations will exist among stations as well, and we’re back to the same problem…
no sod,
The math is both correct and is basic statistics. This is exactly how the temperature distribution would behave in a stable climate. If you have a disagreement about the math – cite something specific. The world “bogus” is not a mathematical proof.
the error i named above is a simple one: temperature in a country is highly correlated. the probability that 10 stations are giving a new maximum, while 10 are giving a new minimum ON THE SAME DAY is close to NIL. it simply wont happen, but feel free to prove me wrong by providing some actual weather data.
the bigger problem in your paper is the talk about “gausian distribution” which i think you did not fully understand.
my C++ skills are a bit rusty, but are you using just a random number between 0 and 1 for your calculation? because the daily temperature measured on a given day at a certain station isn t such a random number.
instead when looking at the timeline of temperature data of a certain date over 100 years (like the 28th of april) you will notice a “gausian distribution” of the temperature values. much more numbers will be close to the “average” 28th april temperature than far apart from it.
when i model this in a calc sheet (i use three times a random number between 1 and 6 and add them together, as one could do we dice as well), the numbers of new maximums start to get pretty small soon.
on 100 stations, over 100 years, the average over the last 35 years is just 0.37 new maximums PER YEAR. (your calculation would assume above 1, even for the last year..)
Some clarifications are needed in this disussion.
If extreme values of a gaussian variable are of interest, then the Weibull distribution applies. But the daily high temperature is not necessarily gaussian, and the distribution of its extremes is generally unknown. Nevertheless, because cyclical components in natural time-series introduce serial correlation, the extremes tend to cluster.
As for extreme yearly “global” temperatures, we need unbiased, globally uniformly sampled estimates to begin with, which neither GISS nor Hadley supply. The fact that the numbers they produce have clustered the yearly extremes in recent decades is of no great signifcance. That seems to be the product of their method of construction as much as the natural tendency toward clustering.
I would like some clarification on autocorrelation.
Leif, do you think the high temperature (or low) for your location today is autocorrelated with the high temperature for your location on this same calendar day last year, or any prior years?
hm, the function i used to get random numbers in a range produced integers. if i use longer random numbers, i don t get any difference between a gaussian and a flat distribution of temperature data, at least with 500 stations and a handful of runs.
you are using the gausssian distribution just as a description of the distribution of results (being number of new max/min results in a given year)?
Joseph (13:35:16) :
Leif, do you think the high temperature (or low) for your location today is autocorrelated with the high temperature for your location on this same calendar day last year, or any prior years?
Yes, take the extreme example that we are entering a new ice age, then for many thousands of year on every April 28th, the temperature will be consistently lower than right now, today.
You can be right in your blindingly obvious statement (even in a stable climate individual temperature records will be frequently broken) and still be wrong in your attempt to show this is true using statistics.
That’s Leif’s point.
Leif, et. al,
Read the first sentence of the article:
I am obviously not talking about extreme events, ice ages, Dryas events, etc. Next, read this sentence.
There are people here arguing about everything except what this article is about. This article is about a best case scenario, which despite being best case, sees lots of high temperature records.
Why wouldn’t you see high and low temperature records on the same day in the same country? It happens in the US all the time.
Try compiling and running the C++ code in the article. You will see that the math is exactly correct.
sky,
I’ll post this for the third time – a nearly perfect Gaussian temperature distribution as measured in Bergen, Norway.
http://folk.uib.no/ngbnk/kurs/notes/node28.html
Anyone who is familiar with Monte Carlo methods knows that a Monte Carlo simulation contains large numbers of non-average events which magically average out to an extremely predictable result. That is why Monte Carlo methods are widely used in many fields, including climate modeling.
Leif,
If the premise of the article is “blindingly obvious” why is it that nearly every journalist in the country doesn’t understand it?
Also, if it is “blindingly obvious” why are you arguing that it is incorrect?
Steve Goddard (15:06:03) :
Consider a hypothetical country with 1,000 top notch weather stations and the perfect unchanging climate
What is lacking is a statement [in bold] that says that because of autocorrelation the real climate does not behave as assumed. The casual reader will miss that point. And
http://motls.blogspot.com/2009/01/record-breaking-years-in-autocorrelated.html
Steve Goddard (15:19:15) :
If the premise of the article is “blindingly obvious” why is it that nearly every journalist in the country doesn’t understand it?
Also, if it is “blindingly obvious” why are you arguing that it is incorrect?
Because journalists [or rather their editor/owners] are not interested in the truth, but in what sells new papers and produces TV ratings.
I’m not arguing that it is incorrect, only that you are overstating your case by incorrect assumptions, and that doing so opens you [and all of us] to unneeded criticism. It ‘can’ be stated correctly, as motls did.
Leif,
This analysis is not intended to be exactly correct (as if that were even possible) and that is clearly explained in the first sentence. The point of the article is (again) to show why frequent high temperature records do not necessarily correlate with a warming climate.
Do you dispute that “blindingly obvious” fact?
Steve Goddard (15:19:15) :
If the premise of the article is “blindingly obvious” why is it that nearly every journalist in the country doesn’t understand it?
You article will be important to the people that wouldn’t have known this before, and all the comments here will alert those readers to the fact that the analysis is oversimplified and overstated, but nevertheless they will grasp the basics that new records are normal, so your goal will be achieved, and that is the important part. What will also be clear [hopefully] is that simplified models may capture the essence, but should not be taken too seriously when it comes to details.
Steve Goddard (15:33:49) :
The point of the article is (again) to show why frequent high temperature records do not necessarily correlate with a warming climate.
Hey, I thought it was that frequent low records [as have been reported a lot lately] do not necessarily correlate with a cooling climate… 🙂