That is a total of 365,000 high temperature records and 365,000 low temperature records. During the second year of operation, each day and each station has a 50/50 chance of breaking a high and/or low record on that date – so we would expect about 182,500 high temperature records and about 182,500 low temperature records during the year.
In the third year of the record, the odds drop to 1/3 and the number of expected records would be about 121,667 high and low temperature records.
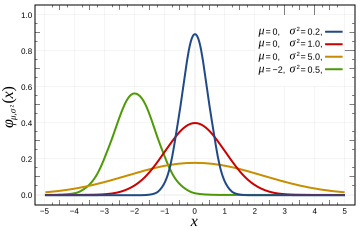
In a normal Gaussian distribution of 100 numbers (representing years in this case,) the odds of any given number being the highest are 1 out of 100, and the odds of that number being the lowest are also 1 out of 100. So by the 100th year of operation, the odds of breaking a record at any given station on any given day drop to 1/100. This mean we would expect approximately 1000 stations X 365 days / 100 years = 3,650 high and 3,650 low temperature records to be set during the year – or about ten record highs per day and ten record lows per day.
This provides the news media lots opportunity to get hysterical about global warming every single day – even in a completely stable temperature regime. The distribution of temperatures is Gaussian, so it won’t be exactly ten per day, but will average out to ten per day over the course of the year. In a warming climate, we would expect to see more than 10 record highs per day, and fewer than 10 record lows per day.
In a cooling climate, we would expect to see more than 10 record lows per day, and fewer than 10 record highs per day. The USHCN record consists of more than 1000 stations, so we should expect to see more than 10 record highs per day. Throw in the UHI effects that Anthony and team have documented, and we would expect to see many more than that. So no, record high temperatures are not unusual and should be expected to occur somewhere nearly every day of the year. They don’t prove global warming – rather they prove that the temperature record is inadequate.
No continents have set a record high temperature since 1974. This is not even remotely consistent with claims that current temperatures are unusually high. Quite the contrary.
| Continent | Temperature | Year |
| Africa | 136F | 1922 |
| North America | 134F | 1913 |
| Asia | 129F | 1942 |
| Australia | 128F | 1889 |
| Europe | 122F | 1881 |
| South America | 120F | 1905 |
| Antarctica | 59F | 1974 |
http://www.infoplease.com/ipa/A0001375.html
Here is the code discussed in comments:
// C++ Program for calculating high temperature record probabilities in a 100 year temperature record

// Compilation :  g++ -o gaussian gaussian.cc

// Usage : ./gaussian 100

#include <iostream>

main(int argc, char** argv)

{

int iterations = 10000;

int winners = 0;

int years = atoi(argv[1]);

for (int j = 0; j < iterations; j++)

{

int maximum = 0;

for (int i = 0; i < years; i++)

{

maximum = std::max( rand(), maximum );

}

int value = rand();

if (value > maximum)

{

winners++;

}

}

float probability = float(winners) / float(iterations);

std::cout << "Average probability = " << probability << std::endl;

}
Where I live there is a manual weather station surrounded by buildings and near a tarred road, and an automatic weather station situated on a grassed oval with no buildings/roads within 80 metres. They are only 300 metres apart. The MWS always measures on average 0.5C warmer (both max and min temps) than the AWS. This is a fine example of UHI in operation.
However if it’s on average 0.5C warmer then over time it will show exactly the same trend as the other station.
Leif,
You are correct – a few record highs or lows is meaningless.
FYI – Alaska just had their second coldest year since 1975, and is on a seven year cooling trend.
http://climate.gi.alaska.edu/ClimTrends/Change/graphics/temp_dep_49-08_F_sm.jpg
I’m sure that has nothing to do with solar activity though. Right?
Steven Goddard (17:24:51) :
FYI – Alaska just had their second coldest year since 1975, and is on a seven year cooling trend.
[…]
I’m sure that has nothing to do with solar activity though. Right?
As per your article, this is not unexpected with random data thus does not need a hypothetical cause 🙂
Steve Keohane (12:31:22) :
The town of Aspen is in a valley. A high valley should be cooler than a low one though the generally elevated terrain likely makes things a bit more complicated than adiabatic effects alone. The elevation difference between Aspen and Glenwood Springs is 2400 ft, which is a 12°F adiabatic difference. From your home to Glenwood Springs is an elevation difference of 1200 feet, so when the air is well mixed, I’d expect a 6°F difference.
What I was was trying to describe is an occasional phenomemon where the morning temperature in a valley is colder than a nearby mountain top. It requires still air at night, long nights, and clear skies. Snow to keep ground heat trapped helps too. You might be be able to see it by comparing Aspen valley temperatures with ski area summit temps in the morning.
Another thing you might be able to see is to take the summit temperature at Aspen in the morning, add the 1°/200 ft lapse rate for where you are and when your temperature reaches that see if the wind picks up or becomes gusty. The temperature climb may level off too.
Oh – here’s a decent example. In Glenwood Springs at 5900 ft is http://www.wunderground.com/weatherstation/WXDailyHistory.asp?ID=MAS062 . Except for a little wind from 1100-1200, things picked up at 1230. That was around the high for the day at about 73F.
Meanwhile at Storm King Mtn at 8800 ft, at 1230 the temperature was 56. About 3000 ft difference, or 15° adiabatic difference, which would suggest Glenwood Springs would be around 71F to allow mixing to occur, and that’s about what happened.
So any ground heating would heat the air and that convects upward, which means the winds aloft can come down to the ground.
Uh, what was the point of all this? Oh – thinner air at higher elevations and Australia air temps at Charlotte Pass and a nearby valley. If the pass isn’t too much higher than the valley, the valley will frequently have radiational cooling and a lower temperature than the pass.
A place in Maine set an all-time low of -50F on Jan 16. The low at Mount Washington (6288′) that day was only -25F. That’s one of the more impressive inversions I’ve seen!
Oops – I forgot the URL for Storm King Mtn, see http://www.wunderground.com/weatherstation/WXDailyHistory.asp?ID=MSTOC2
From Australia:
Figures just in from the BOM indicate that Charlotte Pass in NSW
has just recorded the lowest temperature anywhere in Australia
for the month of April. (-13 degrees)
I notice that 6 other stations in the surrounding area also recorded their lowest April temps.
This does not support or conflict with AGW and it should be noted that record low temps in April are statistically more possible (given the time period from the start of recording) in a warming world due to the large shift in average temperatures between the beginning and the end of the month.
And yes Charlotte Pass weather station is in a valley and about 50m below the Pass (1840m).
The station was moved by about 100m in 1992 to a new level 20m lower at the valley floor. The idea was to move it away from the alpine ski lodges which are obvious sources of IR radiation but the new position was more subject to temperature inversion extremes. The weather station was moved again (a few years ago) to a new position that’s about half way back to the original location.
Australia is a very warm continent and it should be noted that outside of the Snowy Mts of NSW the lowest recorded temperature for any month is minus 13C.
Ric Werme (18:08:38) :
What I was was trying to describe is an occasional phenomemon where the morning temperature in a valley is colder than a nearby mountain top. It requires still air at night, long nights, and clear skies. Snow to keep ground heat trapped helps too. You might be be able to see it by comparing Aspen valley temperatures with ski area summit temps in the morning.
Thanks Ric for the explanation. Last night was very clear and with almost no wind and Charlotte Pass has a few inches of snow cover at the moment so the ingredients for a temperature inversion are all there.
The valley below Charlotte Pass is also the base of a large glacial valley which starts 250m above the weather station.
Davd
dhogaza
Yes, of course that’s true. But the part that would be interesting to check is if there has been any more increase over time with the MWS readings (as a building has been built close by recently) compared to the AWS. If I had the time and data …………..
Ongoing exchange between Leif and Steven – very entertaining. Please don’t close for comments. I think it could possibly go on forever…
Ric Werme (18:08:38) I don’t disagree with you, but temperature inversions are pretty rare in this area, much more common on the front range (eastern plains) of the Rockies. From the WU reports you linked to the Glenwood Springs temperature reading is correct, the wind velocity is misleading, perhaps in some peculiarly isolated spot. Storm King Mtn. is about 2 miles west of Glenwood Springs. At my place from 10am on we had wind gusts in the 30-40 mph range. I went into Glenwood at 3:30pm and saw 3′ X 5′ flags standing straight out, which is approx. 35 mph. Aspen, my place and Glenwood are all in valleys. I’m in the Cattle Creek drainage, perpendicular to the Roaring Fork drainage which is bounded by Aspen and Glenwood. They both have a lot of exposed red sandstone, I am on a basalt flow, but my canyon is roughly east-west where the Roaring Fork is more NW-SE. In the mornings the airflow is up Cattle Creek, to the east, until about noon, then it switches to west or downhill, baring some major circulation effect as was the case today, 4/28, with wind out of the SW from a low in the NW US. It was very dry here today, ~15% RH as is the case after the snow leaves. One needs to be at 8000 ft to find any snow now and only on north facing slopes at that elevation. I would suspect that the consistant slope to the Roaring Fork drainage intersected by a few perpendicular drainages keeps the air in motion. I’ll have to pay more attention to the ski Mtn. reports in season, they mention the temperature at the mountain tops every morning. It’s a pleasure discussing weather with you.
Steve Goddard (12:26:45) :
rafa,
I am not trying to do any analysis of trends in this article. The purpose is to demonstrate that even in a stable climate, we would still see lots of temperature records. Note that Leif agrees with this, saying it is “blindingly obvious.”
It may be “blindingly obvious” to Leif, but based on the comments from other readers, many appreciate a simple statistical explanation of why this occurs.
Unfortunately you failed to give one, your attempt is wrong almost from the get-go! I assume that that both a maximum and minimum temperature is measured for each day (not explicitly stated).
During the second year of operation, each day and each station has a 50/50 chance of breaking a high and/or low record on that date
No it doesn’t! To have a 50/50 chance of breaking the previous record the previous year’s reading must have been exactly at the mean of the population you’re selecting from. Suppose by chance that it was exactly at the (mean + 1sd) instead then it would have a 15.8/84.2 chance of breaking the record. This problem is not dependent of the form of the distribution although the exact numbers will vary.
In the third year of the record, the odds drop to 1/3
Also wrong for the same reason.
In a normal Gaussian distribution of 100 numbers (representing years in this case,) the odds of any given number being the highest are 1 out of 100, and the odds of that number being the lowest are also 1 out of 100.
This is correct, congratulations!
Unfortunately it was immediately followed by an elementary logical error:
So by the 100th year of operation, the odds of breaking a record at any given station on any given day drop to 1/100.
The probability of exceeding the record will depend on the distribution and the highest previous value, taking your example of a Gaussian distribution and a previous record at the (mean + 3sd) value the chance of breaking the record is ~0.1%. If the previous record was at the (mean + 2sd) value then the chance of breaking the record would be 2.2%.
I suggest to get someone who understands statistics to write the article, and also read the rest of the Wikipedia article you got the graphs from.
AKD (21:10:24) :
Ongoing exchange between Leif and Steven – very entertaining. Please don’t close for comments. I think it could possibly go on forever…
Like the barycenter thread? 🙂
Unfortunately for the fun, I think we are done by now.
Merrick: “First of all, Anthony was obviously making a hyperbolic argument to enforce his point.”
So? The best straw men are hyperbolic. (By the way, I’m referring to the article that heads this thread, by Steven Goddard.)
“…that the way the data is presented to the general public it would be virtually impossible for the public to not draw that conclusion.”
As far as I can see, nothing in the data or the way it is presented implies a past “perfect unchanging climate”. And as for the public drawing conclusions, ice ages are common knowledge so I doubt anyone infers a past static climate from AGW.
Tamara: “Our way of life would be shattered by a two degree departure from the mean???”
I didn’t say our way of life would be “shattered”. That aside, a 2 deg C rise is at the lower end of IPCC projections, with a high of around 6 deg C. The higher levels would definitely cause a disruption to our way of life (ie to a society with a complex economy based on a high degree of interdependence).
Ron House: “You carefully didn’t quote the part of my reply where I pointed out that the argument made did not rely on any part of this “perfect unchanging climate” snipe.”
The intro to the article reads: “Consider a hypothetical country with 1,000 top notch weather stations and the perfect unchanging climate…”
From this description, the argument certainly appears to involve an unchanging climate, and at (07:05:00) Steve Goddard says: “This is exactly how the temperature distribution would behave in a stable climate”.
However, I take your point that the substantive argument does not require an unchanging climate. But that still leaves the section in parantheses: “…(which our AGW friends imagine used to exist before they were born.)”. The “which” in this case refers to “perfect unchanging climate”.
And that is a straw man, since AGW makes no such claim. The argument is implied by the use of a snide term such as “imagine”. In other words: ‘AGWers think that past climate was perfectly unchanging, but of course they’re dreaming, no such climate has existed.’
Just to prove the point of this thread …
Charlotte Pass, NSW, Australia today broke the all time low record in Australia for the month of April with a chilly start of -13 degrees C.
Given the number of April’s since measurements began there was ~ 0.5% chance of this happening this year.
Brendan H,
In fact your argument works against you. When ice ages are brought up they are used for the “climate change is bad” argument, NOT that climate change is normal, which again is the opposite of what your argument relies upon.
“They” say:
“Just a few degrees below “normal” and we have an ice age. Now look at the Mann Hockey Stick. See! Climate’s been so “perfectly unchanging” over the last couple thousand years [after completely jury rigging the data to make the MWP, LIA, etc. disappear – as clearly detailed again and again in ever increasing detail here and over at Climate Audit]. Now the Mann figure shows us we’re heading for a few degrees above “normal” [if I just draw a connect-the-dots line between the last two data points and extend it into the future in a highly scientific way] so the sky is falling again!”
You’re saying that “everyone knows” that climate change is normal or at least happens normally, but that is NOT what is being presented by either the anthropogenic warming proponents or the media in general. And as more and more data shows that the northern sea ice continues to both expand in area and thickness when compared year to year (see yesterday’s posting of German measurements of polar sea ice thickness) and at BOTH poles you are continuing to defend the irresponsibly stated “PANIC! The North Pole may be ice free this year!” article at the beginning of this post. (BTW, that’s hyperbole to make a point.)
And, again, while all this is happening the exceptionally UNSCIENTIFIC Catlin party is sending out, “gee, the ice is really THIN here!” releases and the NSIDC (who’s that incoming Director?) is supporting their work. So where are the straw men, really?
“the perfect unchanging climate (which our AGW friends imagine used to exist before they were born.) ”
No-one imagines such a thing.
Ozzie John (03:30:04) :
Just to prove the point of this thread …
Charlotte Pass, NSW, Australia today broke the all time low record in Australia for the month of April with a chilly start of -13 degrees C.
Given the number of April’s since measurements began there was ~ 0.5% chance of this happening this year.
I couldn’t find the daily data for that site but based on the April monthly data and assuming a Gaussian distribution there would be a 0.3% chance of the previous record being broken (-10ºC) and ~0.02% chance that it would be below -13ºC. Goddard’s method would say that there was a 1/79 (1.3%) chance of being a record.
When someone says, “The number of record high temperatures is very large,” one should reply, “Compared to what?” I.e., what is the null hypothesis?
Steve Goddard has presented a plausible first pass at a null hypothesis for testing the claim that the number of observed record temperatures is unexpectedly large due to a systematic drift in climate. Perhaps the model could be refined to add year-to-year autocorrelation such that the April 28 high temperature at a given location is not merely a Gaussian random variable but the result of a Brownian walk.
But in any case, statistically testing assertions against a null hypothesis such as the one Steve presented is essential to validating any GW or AGW claims. If the AGW camp cannot show at, say, the 95% confidence level that the number of observed new highs is inconsistent with a stationary (or randomly drifting) climate hypothesis, then we can rightly dismiss their claims out of hand.
Personally, I think the evidence indicates that there indeed has been a systematic upward temperature trend over the past 100 years (even after accounting for likely bad data from many surface stations). But I would like to see the p-value for a test of this claim. And even if there is GW, that does not mean it’s AGW.
(BTW, the posted C++ code appears to use uniformly distributed random variables rather than Gaussian ones.)
Dana H. (13:22:20) :
When someone says, “The number of record high temperatures is very large,” one should reply, “Compared to what?” I.e., what is the null hypothesis?
Also, the argument applies equally well to record low temperatures, so all the record lows we see are just what would be expected from random data [as per the argument].
“Also, the argument applies equally well to record low temperatures, so all the record lows we see are just what would be expected from random data [as per the argument].”
Yes, absolutely. Any claim that there is a systematic cooling trend should be met with the same degree of rational skepticism as a claim of systematic warming.
Merrick: “When ice ages are brought up they are used for the “climate change is bad” argument, NOT that climate change is normal, which again is the opposite of what your argument relies upon.”
I’m not arguing that climate change is normal. I’m arguing that climate change occurs.
“You’re saying that “everyone knows” that climate change is normal or at least happens normally…”
I’m not saying that. Here’s what I said: “…nothing in the data or the way it is presented implies a past “perfect unchanging climate”.
I’m arguing that people, including AGW supporters, know that climate change occurs. That’s not the same as “normal”. My argument was in response to the claim that AGW people “imagine” that in the past there was a “perfect unchanging climate”. The relevant issue here is “change”, not “normal”.
“They” say…Climate’s been so “perfectly unchanging” over the last couple thousand years…”
Who are “they”? I have heard the climate of the past two thousand years described as stable, but that’s not the same as “perfectly unchanging”.
“…you are continuing to defend the irresponsibly stated “PANIC!”
I don’t defend irresponsible panic-mongering. People have differing views on the likely outcomes of AGW, so there will be a range of opinions. And of course AGW sceptics often appeal to lurid scenarios of mass death and misery from measures to mitigate AGW. So the panic swings both ways.