The UAH Satellite Temperature Record With Volcanic Noise Outliers Filtered Out
A guest post by Steven Goddard
I’ve often wondered what the UAH global temperature record would look like if the cooling effects of the eruptions of El Chichón in April, 1982 and Mount Pinatubo in June, 1991 were removed. Large volcanic eruptions shoot fine ash up to very high altitudes, which makes the upper atmosphere less transparent, allowing less sunlight (SW radiation) to reach the lower atmosphere. This has a noticeable cooling effect on the lower atmosphere and the earth’s surface which can last for years, as can be seen in the figures below. Note how the lower troposphere temperatures were depressed during periods when the atmospheric transmission was also depressed.
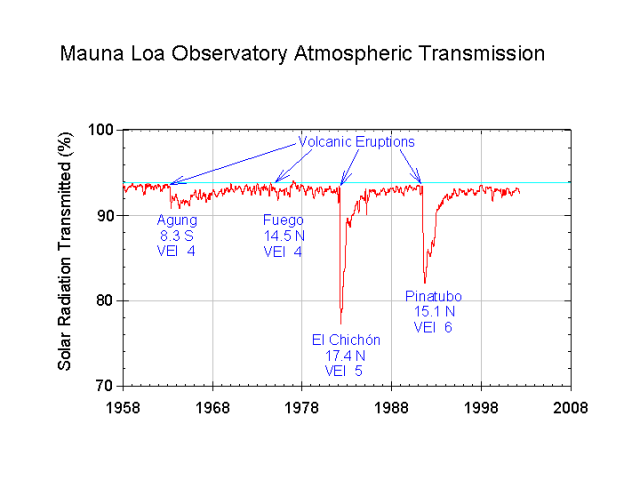
http://upload.wikimedia.org/wikipedia/commons/9/9c/Mauna_Loa_atmospheric_transmission.png
Next let’s look at the UAH satellite record:
http://www.woodfortrees.org/plot/uah/from:1978
Volcanic events are not related to man’s activities, and should not be included when calculating anthropogenic global warming trends.
My experiment was simple enough. I took the UAH monthly data and nulled out the periods of low atmospheric transmission (April 1982-December 1985) and (June 1991-December 1994.) In other words I set those months to zero anomaly. This is a reasonable approach, because zero anomaly is what UAH considers to be the mean temperature for the period. Using Google Spreadsheet’s linest() function, I then calculated the trend. With the volcanoes removed, the global warming trend dropped from 1.3 degrees per century to 1.0 degrees per century.
A far cry from the 6+ degrees at the high end of the IPCC scenarios.
What also becomes apparent from this graph is that recent lower troposphere temperatures have dropped back to near the 1978-1997 baseline. 2008 monthly temperatures averaged slightly lower than 1980 temperatures.
DJ wrote:
That graph clearly shows that the last 5 years have been much hotter than any other 5 year period in the record and it also shows that the most recent temperature are a long way above those at the start of the series (despite “la Nina” and a cold sun ATM). It is also evident that a trend line shows a very strong warming trend.
This post has succeeded in showing that the UAH data shows a warming planet.
But it doesn’t show that the warming is man-made.
For example:
Fast Melting Glaciers Expose 7,000 Years Old Fossil Forest
Melting ice has ‘provided’ us with frozen mammoths and even frozen people, like the famous Oetzi from the Alps, as if they were kept in a fridge. No wonder that melting glaciers in Western Canada, which recently reached a historic minimum, have unveiled 7,000-year-old tree stumps.
Wood fossil a glimpse of Northern Canada’s forested past
Another remnant of Nunavut’s warmer past, of a time when forests covered the Far North, has been uncovered on Bylot Island near Pond Inlet…. Despite the potentially catastrophic nature of climate change, global warming may bring back productive forests — the lungs of a healthy planet — to the high latitudes.
Clearly, the planet has been warmer for forests to have existed in those much colder locations in the past. If the warming now is man-made, how did man warm the planet back then that enabled the growth of those forests?
Joel Shore (14:32:09) :
Smokey says:
None of that matters. Why? Because carbon dioxide is not harmful, it is beneficial. CO2 has been much higher in the past. The current extremely low levels are not a problem. At all.
And, sea levels have been tens of meters higher too, which is also not any sort of problem…unless you areone of the hundreds of millions of people who live this close to see level. And, for that matter, there have been supervolcanoes and major asteroid impacts and all sorts of things…so apparently these aren’t anything to worry about either!
Alright….We’ve been here before. Please quantify the see {sea} level rise that will displace millions of people.
Pamela Gray,
Interesting argument, the geography did not change, so what did? I like it.
But, my question has been (but not expressed), how much do undersea volcanoes and thermal vents affect the ocean currents? Or undersea earthquakes that move the sea floor up or down? I have no expertise or much knowledge in this area, but I do know a lot about fluid dynamics as a chemical engineer. It does not take much disturbance to impact the flow.
Anyone who has ever built a rock dam in a small stream will know what I mean. A small pebble has little effect. But, a rock of sufficient size will certainly affect the flow.
Is there any literature on this?
Roger E. Sowell
Marina del Rey, California
Pamela,
I used the UAH dataset here:
http://vortex.nsstc.uah.edu/data/msu/t2lt/tltglhmam_5.2
If it has been adjusted for the effect of volcanic eruptions, I was unaware of that. I don’t think it has, and would need some proof of that.
Worry about them all you like. But the solution is to adapt, not attempt to control the global climate, because it can’t be done. The oceans will rise and fall in spite of CO2 levels.
Oh. My bad. You used satellite. Adjusted for orbit drift but I think that is about it. My fav report on UAH is here
http://icecap.us/images/uploads/DOUGLASPAPER.pdf
And I still say we are talking about weather. Yes, long term weather, but weather nonetheless.
“Joel Shore (14:32:09) :
And, sea levels have been tens of meters higher too, which is also not any sort of problem…unless you are one of the hundreds of millions of people who live this close to see level. And, for that matter, there have been supervolcanoes and major asteroid impacts and all sorts of things…so apparently these aren’t anything to worry about either!”
(I can just hear this coming from the lips of Marjoe Gortner, Just add “Brothers and sisters”, to the beginning of the paragraph)
Meanwhile prices of seaside property are skyrocketing, even Al is buying seaside property… it seems like he would think it a poor investment. Do all the political and scientific elite think the common man is THAT stupid? Just wondering…
Sorry, Joel, but your rhetoric does not sound like the dispassionate observations of a man of science. Perhaps you need to get out of the lab and take a vacation… the beach, maybe?
Cold Thailand?
http://www.terradaily.com/reports/Tropical_Thailand_declares_emergency_as_cold_hits_999.html
A semiformed thought… Couldn’t you think of this temperature series as being rather like a complex sound. Some frequencies are very high (the spike from the volcano) and some are very low frequencies (the AGW component, slowly increasing over a long time – in theory). If that is a reasonable analog, then a short time Fourier transform ought to show the distribution. See:
http://en.wikipedia.org/wiki/Short-time_Fourier_transform
At the bottom is an example of a sound analysis. Imagine it with a big spike at the high frequency end (the volcano) and some low signal in the low end (AGW or other long term natural warming trend).
That ought to let you see the relative sizes of the different time series oscillations too (*NSOs)…
Or maybe I need to think about it some more…
Looks like Germany is closing rivers due to ice and having folks freeze to death (cold is bad, warm is good…)
http://www.terradaily.com/reports/Ice_closes_German_rivers_to_shipping_authorities_999.html
Slovakia, freezing and short of natural gas due to Russia / Ukraine ping pong, restarts a nuclear reactor (it was supposed to be shut down as terms for joining the EU. Austria not happy.)
http://www.nuclearpowerdaily.com/reports/Bratislava_restarts_nuclear_reactor_to_avoid_blackout_999.html
Gee. I think I see a pattern developing.
a) It’s cold. Very cold.
b) When it’s cold, people do what they need to do to stay warm.
c) They will get back to you on ‘agreements’ and ‘saving the world’ later.
d) Nuclear works in any weather. Wind, solar, and (in this case) gas; not so much…
Alan S. Blue (12:05:45)
That’s an extremely important point you make in that coherent analysis. This stuff is useful for pinpointing the true effect of CO2, which, of course, we don’t know yet. Nor, may I not be the last to point out, do we know the magnitude of water vapor feedback, nor truly even its sign. So, look again Joel; your mind may have deceived you.
==============================================
Steve: Great Patience
I do not agree with the ideas of Dr. Grinsted
The naked eye I have the impression that your article agrees with this:
http://www.glaciology.net/Home/PDFs/Announcements/Volcanic-impact-on-sea-level-and-the-global-water-cycle
I agree with Steve.
The Chaiten volcano continues to grow, similar to an eruption of Tambora is not fully discarded
While Volcanoes do not have as much of an impact on surface temperatures, they are certainly the main driver of Stratosphere temperatures.
Volcanoes cause a temporary +1.0C to +1.5C increase in Stratosphere temperatures and then temps seem to drop 18 months later to a new lower level; about -0.5C lower than where they were before. They might slowly build back up to normal until a new volcano occurs.
Stratosphere cooling is a key fingerprint of global warming.
But if you look at this chart, it is more Volcanoes that are the main driver of Stratosphere cooling not GHGs. (This same up and down swing occurs with the radiosonde data for the Agung volcano in 1963 before the satellite data became available).
http://img258.imageshack.us/img258/235/uahstratvolcanoesyb5.png
I believe this is the papar David Douglass was referring to in the first comment.
If you have a little bit of statistics it is well worth the read. In summary, they treat predicting 20th century temperature as a time-series regression problem with a model of the form:
T(t) = k1S(t) + k 2V(t) + k3 I(t) + k 4 L(t) + b
where T(t) is the temperature at time t, S represents el-nino effects, V volcanic effects, I is solar irradiance, L is a linear term and b is a constant (k1, k2, k3, k4, and b are to be estimated from the data).
They find a very good fit with:
k1 = 0.129 +/- 0.008 K/K
k2 = -2.9 +/- 0.2 K/um
k3 = 0.103 +/- 0.017 K/(W/m2)
k4 = 76.8 +/- 10.0 mK/decade
b = -140 +/- 23 K
Units for the el-nino coefficient k1 are degrees K of warming per degree K of SST 3.4 anomaly. For the Volcano coefficient k2: degrees K of warming per micrometer of atmospheric optical density. For the solar irradiance k3: degrees K of warming per W/m2 of solar forcing.
k4 is most related to the subject matter of this post. It is the linear trend in the data after all the other effects have been removed: 0.77 degrees K per century.
Angus Reid Global Monitor reports that – While still high, the proportion of people in the United States who are concerned about climate change has dropped this year, according to a poll by Rasmussen Reports. 65 per cent of respondents believe global warming is a very or somewhat serious problem, down eight points since April. In addition, 43 per cent of respondents believe global warming is primarily caused by human activity, while 43 per cent blame long term planetary trends.
The latter [those who believe in the long term planetary cycles cause] is up 9% since the last report. So it would appear by this survey that the skeptics are no longer a fringe group but an equal majority and growing fast in numbers.
http://www.angus-reid.com/polls/view/fewer_americans_worried_about_climate_change/
David Douglas emailed me back with a link to the paper that was missing in the first comment of this thread:
Anthony;
The link to the paper “Limits on CO2 Climate Forcing from Recent Temperature Data of Earth” is
http://arxiv.org/abs/0809.0581
Also a copy is attached.
Regards;
David Douglass
Funny, I lived in La Crosse, WI summer of ’83 the hottest summer other than ’88 (outside Milwaukee by then) in my feeble memory. Entire month of July had highs in the 90s except a day or two around 100. El Chichon wasn’t much around here.
All these place experiencing record/bitter cold, somebody has to eat the high pressure system from hell. That would be my neck of the woods, No. Calif., where we hit the upper 70’s and broke records. We would gladly trade for some rain/cold to help defray the misery pumping up over into British Columbia and blizzarding down on the MidWest.
But, unfortunately, someone is running cloud-seeding experiments in NE Calif, and ever since they started doing it, the storms have parted over that area, sending torrential rain & snow into Washington & Oregon, and the rest south. The middle is bone dry.
I believe this effect is well-known, not an oops.
I was wondering.. When it comes to atmospheric CO2, has anyone read Ernst-Georg Beck’s paper on the last 180 years and how the processes for measuring CO2 have changed, and varied?
http://www.biomind.de/nogreenhouse/daten/EE%2018-2_Beck.pdf
Pretty interesting read. If he is right, it would sure change things.