The UAH Satellite Temperature Record With Volcanic Noise Outliers Filtered Out
A guest post by Steven Goddard
I’ve often wondered what the UAH global temperature record would look like if the cooling effects of the eruptions of El Chichón in April, 1982 and Mount Pinatubo in June, 1991 were removed. Large volcanic eruptions shoot fine ash up to very high altitudes, which makes the upper atmosphere less transparent, allowing less sunlight (SW radiation) to reach the lower atmosphere. This has a noticeable cooling effect on the lower atmosphere and the earth’s surface which can last for years, as can be seen in the figures below. Note how the lower troposphere temperatures were depressed during periods when the atmospheric transmission was also depressed.
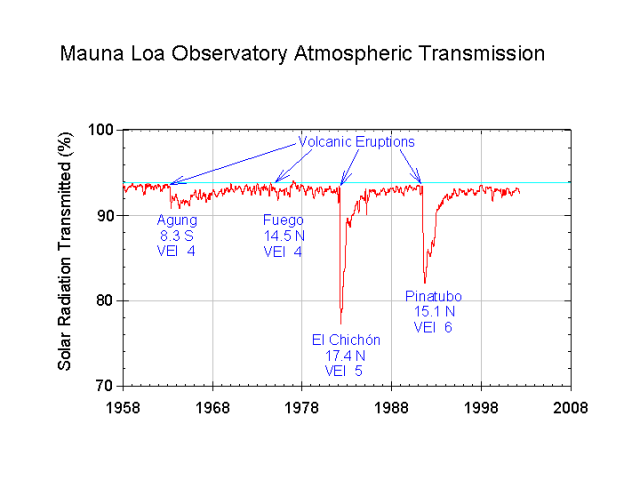
http://upload.wikimedia.org/wikipedia/commons/9/9c/Mauna_Loa_atmospheric_transmission.png
Next let’s look at the UAH satellite record:
http://www.woodfortrees.org/plot/uah/from:1978
Volcanic events are not related to man’s activities, and should not be included when calculating anthropogenic global warming trends.
My experiment was simple enough. I took the UAH monthly data and nulled out the periods of low atmospheric transmission (April 1982-December 1985) and (June 1991-December 1994.) In other words I set those months to zero anomaly. This is a reasonable approach, because zero anomaly is what UAH considers to be the mean temperature for the period. Using Google Spreadsheet’s linest() function, I then calculated the trend. With the volcanoes removed, the global warming trend dropped from 1.3 degrees per century to 1.0 degrees per century.
A far cry from the 6+ degrees at the high end of the IPCC scenarios.
What also becomes apparent from this graph is that recent lower troposphere temperatures have dropped back to near the 1978-1997 baseline. 2008 monthly temperatures averaged slightly lower than 1980 temperatures.
Volcanos, the Sun, and Climate.
Solar activity and climate link has been proven, and accepted by many pro AGW folks to be a strong correlation up to approx 1985. After 1985 there seems to be a disconnect between the relations. Or is there:
Volcanic activity and solar influence:
http://articles.adsabs.harvard.edu/cgi-bin/nph-iarticle_query?2003ESASP.535..393S&data_type=PDF_HIGH&whole_paper=YES&type=PRINTER&filetype=.pdf
One can gather from the article above 2 points:
1. it is likely that the recent solar maximum resulted in lower volcanic activity. resulting in increased temperatures
2. it is likely that the current solar activity (minimum) will result in increased volcanic activity. take your guess at what would happen…. my guess is we are due for another large eruption.
This following report is somewhat comical. I think the volcano’s had less effect, because there were less eruptions??? hmmm
Quote:
The authors say that, overall, eruptions in the 20th century have exerted fewer obvious effects in the tropics. They said this could be because there were fewer major events in that century–but they noted it could also be “because of the damping effect of large-scale 20th-century warming.”
http://www.terradaily.com/reports/Volcanoes_Cool_The_Tropics_999.html
Knowing why you are wrong is just as important as knowing if you are correct.
First let me say that this is a great blog and I have enjoyed all of the post over the last year or so when I first came across the site.
It would seem to me that what we are talking about is common cause vs special cause. You have removed the special cause (volcanoes) leaving the common causes (AGW/sun cycles/ocean phases) and plotted that trend line. This would show us the overall temp. trend without the special causes that are not “normal” within the system. Shewhart originally referred to special cause as assignable-cause, clearly you can assign a cause to these periods of cooling. The rest of warming 1C is still unknown unless you believe in the current consensus.
The argument to remove other natural events only holds water if they can be demonstred to be inherently unpredictable.
I am wondering about the effects of the precipiated ash, similarly to Bruce (09:12:47), but further, what happens when it falls onto the ground and water,
temporarily lowering the albedo. This might explain the rapid return to ‘normal’ or the previous temperature. Thanks for this piece Steve Goddard.
A possibly obvious comment regarding the potentially over-emphasis of the volcanic effect on global temps.
The ocean integrates the incoming solar, largely visible light, over many years, call a decade significant with respect to its release. Huge volcanic eruptions decrease the incoming solar for a year, at most two.
The immediate effect on global temps of tropical eruptions then is at least an order of magnitude greater than its long term effect.
Bruce said
“While the ash may reflect sunlight and cool the earth while it is airborne, what effect does the ash have on the earths albedo when it settles on ice and snow? Would it not make the ice and snow dingier and lower the albedo, thereby increasing warming?”
Back in the 1850’s there was a report written on the effects of soot in the Arctic as this had been noticed. As I understand it soot- whether from a volcano or from a big enough cloud of it as pollution coming from say China- initially causes cooling of the atmosphere. It can then setlle on the arctic changing the colour of the ice/snow from white to blackish and thereby lowering the albedo thereby increasing warming and creating break up of ice. This in itself crerates more open water which in itself further increases warming.
However, at some point when it cools again, that means that pristine white ice and snow will reform, thereby reflecting sunlight again. However….snow is a good insulator in the winter thereby making it difficult for thick ice to form under it. In summer however snow reflects sun and protects the ice underneath.
Now whether that all means that volcanoes or soot eventually has a negative, positive, or neutral effect I dont know, but I am sure others on this thread will have an opinion.
TonyB
Regarding the question of whether it is legitimate to remove the effects of volcanic actions from global temperatures: I think the matter is clear. There are two assertions in question. First, it is asserted that global temperatures have increased in recent years (define “recent” as you like). Second, it is asserted that the increase in global temperatures has been caused in part by man-made causes. The graph above concerns the first assertion only. The question is, how relevant are volcanic eruptions to underlying global temperature trends? As volcanic eruptions are clearly transient phenomena, they can hardly be said to be contributing one way or another to any possible underlying trend. Let me be clear: if the effects of volcanos are left in the graph, then they affect any trend computed from the data. They do not, however, have any effect on atmospheric trends, up or down. They are an independent, transient forcing. As such, I see no reason not to eliminate their effect from any other possible effect. This is standard procedure in any kind of statistical analysis – account for what you are not interested in, and focus on what you are interested in. Analysis of variance consists entirely of doing just that.
No one suggests that volcanos are part of “global warming,” so no one should be concerned about removing their effects from global temperature records. Volcanos on the scale we have seen in recent decades play no part in any proposed long-term change in climate, and their effect should, in fact, be removed from the data before looking at the underlying trends. Whether this particular analysis deals with volcanic effects properly is another matter, and open to debate by reasonable people.
For what it’s worth, I, as a non-scientist, appreciate what the OP was trying to do, i.e., ask a “what if …” question, which is something that AGW enthusiasts seem to wish to avoid.
This is only my second post here, although I have been lurking for a while, and all I can say is please keep up this kind of stuff as it’s only by being exposed to arguments on both sides without the extreme abuse that does appear in other places that is helping me to understand the subject somewhat better as time goes by.
Two points:
1. I notice that many of us use “climate” and “weather” interchangeably. i.e. volcanic eruptions are climate forcing”. I believe that eruptions force weather directly and climate indirectly.
From my simplistic lay point of view, global climate is a mathematical construct of compiled regional weather data over three decades or longer. Weather is what happens day by day usually expressed in terms of surface and atmospheric temperatures, winds, humidity, barometric pressures. For more effective communication, casual use of these terms should be avoided in favor of precision.
The AGW theory is premised upon what is assumed will occur in the atmosphere due solely to the influence of man-caused trace greenhouse gases over many decades. AGWers know they cannot predict weather with any precision for more than a few days. So they deliberately confuse the differences between weather and climate in order to advance their theory about the causes of climate change.
We skeptics add to the confusion by using current weather events to refute the AGWers misrepresentations and lies. The challenge is to reduce the dialog about climate change into simple, understandable terms. To date, the AGWers, with an assist from the true believing useful idiots in the MSM, have the upper hand. We need to adjust and improve.
2. Steve Goddard’s study removes the volcanic eruption data from climate data because they are natural events and outliers. I am curious to know what the data would show if ENSO and LNSO data was also removed as outliers. The remaining climate forcings, including AGW, could be better approximated. Am I wrong? Why?
Steven
I was interested in the same thing a few months back and did a bit of work using the RSS TLS data and trying to compensate for the volcanoes. The trend changed from 0.0013 to 0.0012. I didn’t think it significant and thought my method was a bit “dorky”. Would you be interested in the spreadsheet just to see my method, which you may be able to develop with more sophistication?
G Alston (22:25:50) :
This is done all the time in real world data collection; sensors will often return data that needs to be averaged somewhat. And sometimes the readings are wierd enough that you declare data from point A to point B is simply an unusable outlier.
I agree, but with the caveat that first the experimental setup is examined to find the “light switch,” that the raw data is maintained, there’s transparency in the smoothing, etc. i.e. First you have to establish that the data in question is, in fact, an outlier and not something new and unexpected. (I’ve several times identified new things because I didn’t assume odd looking data was an artifact of the experimental setup.)
With regard to volcanic ash, one of the useful outcomes of the TTAPS Nuclear Winter scare was the increased research (primarily, as I recall, by the old Defense Nuclear Agency) into the behavior of particulate ejecta in the stratosphere. If memory serves:
Unsurprisingly, the heavier it is, the quicker it washes or falls out. Persistence is on the order of days for the heavier/larger particles (~10 micron) to months for the lightest. It takes up to a few years for the (finest/smallest) ejecta to completely wash out. The climate effects correlated well with size and quantity of particulates.
If there’s any interest, I’ll try to dig out some of the reports.
Would it not have been better to have used RSS MSU land data to plot the effect of any signal from the two events? I’m of the mind that any drop in Solar radiation would show up there first. The use of the words cooling effect on the lower atmosphere and the earth’s surface which can last for years,is ambiguous.
Wow, you really twisted that one around. You took the statement:
“Volcanoes have nothing to do with anthropogenic global warming.”
And turned it into:
“In the same line of logic, then you could remove every natural occuring cooling and warming phenomenon that influence the climate. Then what you are looking at has nothing to do with climate.”
Nice spin.
All this makes me remember the Willie Soon and Steven H.Yaskell´s article:
http://www.cfa.harvard.edu/~wsoon/1816-Mercury03-d/Summer_of_1816.pdf
Steven Goddard:
I only skimmed over the responses, so if I am repeating someone else, my apologies.
Would it not be better to remove the volcano events altogether, both the year and the anomaly, rather then setting them to zero?
If I use Excel, and calculate the slope, and I get a slope of 1.275 deg/century from 12/1978 to present, using all data.
If I delete the time periods in question (4/1982-12/1985 and 6/1991-12/1994), the slope is 1.0203 deg century.
If I input zero into the time periods in question, I get a slope of 1.0365 deg/century.
My feeling, even though the results are similar, is that you need to remove the year and the anomaly both. If you don’t know exactly what the value should be, all you are doing setting an arbitrary value. The base period should probably be recalculated too, by deleting the data.
I get an average anomaly of -0.02909 for the full reference period, using all data. With the deleted time period, I get a value of plus 0.025674. While this does not affect the slope, it reduces the amplitude of the positive anomalies, and increases the amplitude of the negative, when the difference of the average anomaly is subtracted from remaining data.
I used 12/1978 to 12/1997 as the reference period. I used a straight average to calculate the anomaly with out the volcano months.
Steve,
What you have basically shown is that if you eliminate two periods in the satellite record where the temperatures were below average then, because these periods occur in the early and mid part of the satellite temperature records, that tends to lower the trend over the whole satellite temperature record.
This is not surprising but:
(1) If you were able to look at the trend over a longer term (which you aren’t with the satellite data but could with the surface data), then you would find that eliminating these data would tend to increase the trend over earlier periods (say, 1970 to 1985) and would probably not make much difference to the trend over a longer period (say, 1970 to 2008).
(2) To the extent that the volcanic eruptions do have a long term effect on global temperatures (and they certainly ought to have some even if the short term effects are most dramatic), eliminating them would tend to increase the temperature trend. I.e., if there hadn’t been any volcanic eruptions, we presumably would have had somewhat more warming.
Hence overall, it seems to me that your approach here seems to pull out the result that you want when a more realistic approach to the question “How did the El Chichón and Pinatubo volcanic eruptions affect global temperature records?” would likely conclude that they caused the warming to be somewhat greater overall than it would otherwise have been without them.
Steve Hempell (10:11:06) :
Steven
I was interested in the same thing a few months back and did a bit of work using the RSS TLS data and trying to compensate for the volcanoes. The trend changed from 0.0013 to 0.0012. I didn’t think it significant and thought my method was a bit “dorky”. Would you be interested in the spreadsheet just to see my method, which you may be able to develop with more sophistication?
If I can use this as a springboard to jump in between SG and DAV, I’m not sure I follow DAV’s criticism that Steven didn’t supply a reasoning for the choice he made about where to “zero” the data to remove the effect of volcanic eruptions on the period data. I would have expected more questions about how Steven did it. A common technique in situations like this is to use a “dummy variable.” This is a variable that is set to “0” for periods where something is presumed to have no effect, and “1” where it is presumed to have some effect. Now in the ordinary case, this results in quantifying a shift in the constant term, something like what many here would probably refer to as a “step function.” But since our interest is in what effect it might have on the trend, then the appropriate thing to do is to use a “cross-dummy variable” in which we multiply the dummy variable times the trend variable.
I took a quick stab at this this morning, using UAH data through October, and doing it the way I just described, the result was more in line with what Steve Hempell suggests: it is there, but maybe not as great as what SG is saying. I’m going to put together a UAH dataset through December, and give this another whirl.
Meanwhile, I look forward to a fixed link/reference to the study David Douglass was intending to refer to.
I assume the comments in post Chris H (01:28:43) : have been
responded to .
A couple of other quick comments:
As someone has already mentioned, there was major el nino in 1982/83, but there were also moderate el ninos in 1991/92 and 1993. It’s reasonable to assume, therefore, that both volcano-affected periods would have been warmer than the periods immediately before and after. This would further flatten the trend – and, in the case of 1992(3), may have even pushed the “warmest year of the millenium” back a few years.
On the issue of “what ifs”. What if El Chicon and Pinatubo had not erupted in 1982 and 1991 respectively, but in 1995 (as per Hansen’s 1988 model) and 2004? Would we now be looking at significant global cooling?
Finally, and I’ve said this before, the reason Hansen’s scenario B trend ran so close to the actual observed trend for so long was down to the modelled volcano eruption (in 1995) compared to the actual eruption(s) in 1991 and, to a lesser extent, in 1983. Remember, although his projections go from 1988, the trends cited begin in 1984. There is a reason for the 1984 start date but I can never remember what it is.
Anyway – a good post which demonstrates just how sensitive temperature trends are to disturbances by all sorts of random factors.
Two correctioms necessary to my previous post:
1. “Chicon” should be “Chichon”
2. Apparently the Hansen projections began in 1984. The point remains, though, temperatures were at a local min in 1984.
Make that: “The weather effects correlated well with size and quantity of particulates.”
Sheesh I give up
A correction to my previous correction:-
“correctiom” should read “correction”
Ray @19:15 said:
“If we remove everything that has nothing to do with antropogenic global warming, you are eventually left with ONLY antropogenic global warming.”
That’s the goal.
If we back up to 1980 for a moment.
The best available historical temperature proxies had us coming out of the Little Ice Age with a pace of about 1C/century from 1700-1900. Entirely non-anthropomorphic. What the climatologists now recognize as oceanic effects (at least partially) gets added to this. Then add the effect of carbon dioxide. And now vulcanism.
That’s four things: Long term (non-human) trends, Oceanic effects, AGW, and volcanoes.
In 1998, Mann’s paper used a novel treatment to weight a very small set of trees quite heavily for determining a longer term temperature reconstruction. These trees didn’t see much of a Little Ice Age. So his temperature reconstruction effectively eliminated it from discussion. Set “Long term climactic trends” to near zero.
The effect of the oceanic effects was also thought to be more ‘weather’ than ‘climate’, and thus assumed to average out over longer time scales. (Which it should, it just happens that our best data starts at an extreme.) So oceanic effect was assumed to be near zero.
Volcanic effects were likewise deemed transient.
So the IPCC’s predictions essentially attribute the bulk of the warming to humans. So, something like 2.0C/c of anthropomorphic global warming is the result and prediction of the first couple reports using Mann’s reconstruction.
But this year, leading climatologists have admitted (paraphrased) “Well, the period 2000-2008 has had the underlying temperature trend suppressed by oceanic effects.” That implies to me that oceanic effects can be (at least) a full ±1C/c trend. And also that we were basically seeing the positive impact of this same cycle for the period 1980-2000.
If we can correctly remove the vulcanism, the long-term non-anthropomorphic trend, and the oceanic effects, we’re left with the human impact.
Even if you don’t use non-Mannian temperature reconstructions, that comes out a closer to zero than to 2.0C/c. If you think the historians are correct in reporting a widespread and strong MWP and LIA, then you end up extremely close to zero.
OT
http://news.yahoo.com/s/afp/20090112/sc_afp/denmarkresearchclimategeology_newsmlmmd
COPENHAGEN (AFP) – The earth’s climate has been significantly affected by the planet’s magnetic field, according to a Danish study published Monday that could challenge the notion that human emissions are responsible for global warming.
“Our results show a strong correlation between the strength of the earth’s magnetic field and the amount of precipitation in the tropics,” one of the two Danish geophysicists behind the study, Mads Faurschou Knudsen of the geology department at Aarhus University in western Denmark, told the Videnskab journal.
He and his colleague Peter Riisager, of the Geological Survey of Denmark and Greenland (GEUS), compared a reconstruction of the prehistoric magnetic field 5,000 years ago based on data drawn from stalagmites and stalactites found in China and Oman.
The results of the study, which has also been published in US scientific journal Geology, lend support to a controversial theory published a decade ago by Danish astrophysicist Henrik Svensmark, who claimed the climate was highly influenced by galactic cosmic ray (GCR) particles penetrating the earth’s atmosphere.
In other words I set those months to zero anomaly. This is a reasonable approach, because zero anomaly is what UAH considers to be the mean temperature for the period….The use of zero anomaly is the correct approach for those periods, because in the absence of other influences, the temperature should average to zero during those times
I think this is wrong for a couple of reasons, firstly the ‘zero anomaly’ in no way implies a ‘normal’ temperature. It is no more or less than the average reading from Jan 1979 – Dec 1998, you have to set a baseline somewhere and this is what UAH chose,. But by using this as your zero for infilling, and then recalculating (I presume, it is not clear) the trend to the present day your averaging period and your trend period do not align – you have a decade of trend that is not included in the averaging. If the average after Dec 1998 is higher than zero then your zero anomaly will be too low.
Secondly, the UAH zero anomaly was obviously calculated with the volcanic biases in place, so you are attempting to calculate a reasonable substitution value for the temperature without the volcanoes from data that includes the volcanoes!
I think an interesting exercise would be to calculate the average of all the data and substitute that as your infill value, then recalculate the average and use that as your infill and see how that affects the outcome, if at all.
PS Congratulations to AW on the Science Blog poll win.
Fascinating. Is it safe to say volcanic eruptions can counteract the (supposed) effects of global warming?
my famous take on global warming:
http://smellytourist.wordpress.com/2009/01/12/hunt-polar-bear/
from
http://www.smellytourist.wordpress.com
I just got back from the other side of the planet. This is my first chance to see WUWT in a week and a half, I tried dozens of times from four different servers – no luck for what seems to be at the top of the list for the best science blog of 2008.
On topic, I just completed a very long piece of work related to the satellite trend data. I used GISS data to remove a discontinuity between RSS and UAH and got a near perfect match of the two datasets.
http://noconsensus.wordpress.com/2009/01/14/give-a-kid-a-toy/
The discontinuity between RSS and UAH happened at around 1992, I have been unable to figure out why the problem exists there but perhaps the eruption created some problem in satellite data interpretation. Before and after 1992 the satellites match within the margin of error for the instrument data (the same margin of error tamino said was stupidly small).
The GISS correction to the section of the satellite trends which had a difference resulted in a reduction of the long term trend in both metrics. I found it pretty interesting.