The UAH Satellite Temperature Record With Volcanic Noise Outliers Filtered Out
A guest post by Steven Goddard
I’ve often wondered what the UAH global temperature record would look like if the cooling effects of the eruptions of El Chichón in April, 1982 and Mount Pinatubo in June, 1991 were removed. Large volcanic eruptions shoot fine ash up to very high altitudes, which makes the upper atmosphere less transparent, allowing less sunlight (SW radiation) to reach the lower atmosphere. This has a noticeable cooling effect on the lower atmosphere and the earth’s surface which can last for years, as can be seen in the figures below. Note how the lower troposphere temperatures were depressed during periods when the atmospheric transmission was also depressed.
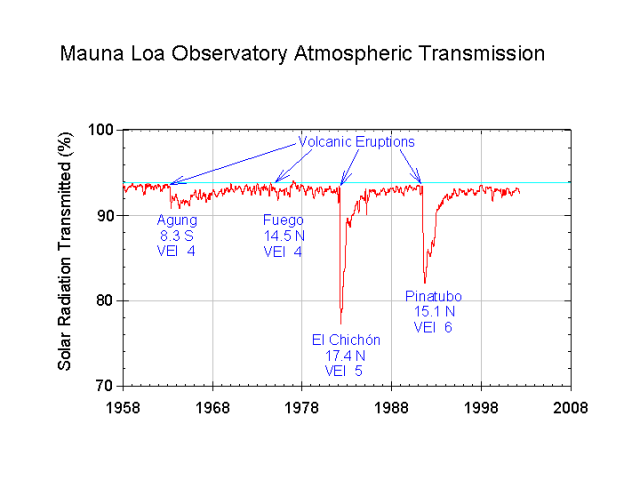
http://upload.wikimedia.org/wikipedia/commons/9/9c/Mauna_Loa_atmospheric_transmission.png
Next let’s look at the UAH satellite record:
http://www.woodfortrees.org/plot/uah/from:1978
Volcanic events are not related to man’s activities, and should not be included when calculating anthropogenic global warming trends.
My experiment was simple enough. I took the UAH monthly data and nulled out the periods of low atmospheric transmission (April 1982-December 1985) and (June 1991-December 1994.) In other words I set those months to zero anomaly. This is a reasonable approach, because zero anomaly is what UAH considers to be the mean temperature for the period. Using Google Spreadsheet’s linest() function, I then calculated the trend. With the volcanoes removed, the global warming trend dropped from 1.3 degrees per century to 1.0 degrees per century.
A far cry from the 6+ degrees at the high end of the IPCC scenarios.
What also becomes apparent from this graph is that recent lower troposphere temperatures have dropped back to near the 1978-1997 baseline. 2008 monthly temperatures averaged slightly lower than 1980 temperatures.
Why are people still allowing this guy to make posts? He clearly has no knowledge of climate science.
Allen – Which guy are you referring to? Author or commenter?
There is something I don’t understand. That is probably due to my limited intellectual capacities. However I would like to share my problem with the other visitors.
– Vulcanic eruptions lead to lower global temperatures.
– So without these eruptions temperatures shoud have been higher ?
– What is then the reason that the global warming trend DROPPED by 0,3°C per century when one removes the influence of these events from the temperature data set ? I had expected that the removal of cooling (temperature depressing) events would have shown an increased temperature rise ?
James Chamberlain (06:24:28) :
“Chris H,
As Steve M says, the cooling that is removed is near the beginning of data collection, thus reducing the trend. Not hard to follow……
Also, I must say I generally agree that natural events should not be removed from any data analysis or both sides will be doing it. All natural events, whether frequent or once in a lifetime are part of the game in a non-linear system.”
I know I’m a bit thick, but unless you remove the natural from the trend how do you establish what isn’t natural?
I really can’t pretend that I know anything about climate, but it makes sense to me to start off by assuming that every trend – upwards or otherwise – is natural and then filter out the knowns to leave the unknowns THEN try to work out what the unknowns are and how they effect the trend.
Sorry if that sounds a bit Rumsfeldish – but I know what I mean 😉
Perhaps this will make it more clear to some readers.
The UAH data set is assumed to be golden. Indeed, it is probably the most accurate representation of global temperature data over the last 30 years.
The choice of null years was made entirely based on the Mauna Loa atmospheric transmission data. There was no statistical or climatological analysis involved in this choice.
Of course a reduction in sunlight reduces surface temperatures. If you look at the Mauna Loa graph, you can see that at the peak, atmospheric transmission was reduced by 15%. Indeed, a related effect is believed to have lead to the extinction of the dinosaurs and the idea of nuclear winter.
A larger graph can be seen here.
http://spreadsheets.google.com/pub?key=pj0h2MODqj3gZXr12j4HMUw&oid=1&output=image
DAV,
Your point about substituting a linear trend is well taken, but the trend was essentially zero from 1978-1997. Thus would produce the same results.
Reading now through comments that have been approved overnight, I’m guessing Allen is probably suggesting the author.
I’ll ask this question then: why do people “let” all Gore still talk about Hurricane frequency to Global Warming links when that has been disproven or Mount Kilimanjaro being a climate indicator when it clearly is an indicator of reduced evapotranspiration of the upwind deforested area?
Some folks think the analysis here is wrong, and an “embarrassment”, and I’m sure you’ll all rush right over to Tamino or Joe Romm etc, and say “Look WUWT has another analysis we think is stupid”, followed by the usual bashing routine, you know the drill.
You may not agree with the method, but looking at things differently, and yes even using alternate or non traditional methods, can lead to insight. Some of the same people that regularly criticize me, WUWT, and the content initially told me I was “stupid” for photographically documenting weather stations, lately I get criticized for not completing my work fast enough for some folks expectations.
This post was mostly a visual and thought exercise what happens to the trend when these events are removed.
Yes there are different and probably better ways it can be analyzed. Data analysis can be done ina multitude of ways, with widely varying results. Maybe Mr. Goddard will do some of the suggestions next. This blog is about provoking thought, even thoughts we may not agree with.
The idea here is to get input and exchange of ideas. Even mistakes are very useful, especially when accompanied with suggestions from others. I have made them, so have others posting here, and we”ll all build on them. In a university environment, mistakes or ideas that won’t fly get discussed, filtered, and honed prior to any publications through collaboration with staff and faculty.
That’s what we are doing here, in full view of everybody, and we do so with the courage to put our names to it, unlike some of the intellectual cowards that do drive by commentary, or run blogs under fictitious names.
If you have criticisms, that’s fine, point them out in a constructive way. if you want to engage in drive by snark with no risk to yourself, there are other blogs for that.
In the meantime I’ve sent off an email to Mr. Douglas to see if I can get him to return and provide the link, so that we can see what his peer reviewed paper has to say about the idea.
A number of David Douglass papers at this address
http://www.pas.rochester.edu/~douglass/recent-publications.html
Some of these co-written with Christy, some dealing with volcanic forcing, though not w/ Christy. One of these is:
“Climate forcing by the volcanic eruption of Mount Pinatubo”
Allen (07:31:56) :
“Why are people still allowing this guy to make posts? He clearly has no knowledge of climate science.”
Whomever was being referred to, I suspect that 30 years from now this statement will be true for all climate scientists of today. This has been true in many scientific fields as new discoveries dismantle old ideas.
What bothers me more is the climate scientists of today that think they know enough they can claim the debate is over.
Steven Goddard (06:04:22) : This analysis does not remove statistical anomalies. It is removing two well defined non-climatological events, which have a well understood cooling effect. … It does not remove “high and low” temperatures. It removes two time periods when there was a known non-climatological bias to the temperature
IOW: they are outliers. One is NOT allowed to remove data if they are not outliers. “Outlier” really means “anomalous.” It does NOT mean “appearing in the tails” except in the literal sense. Those are just easier to detect and how they got their name. Call them anomalies if you prefer.
Even a 1% reduction in solar energy received at the surface, causes more than a 1C reduction in average surface temperature.
http://en.wikipedia.org/wiki/Black_body#Temperature_relation_between_a_planet_and_its_star
So then Pinatubo should not have had the same effect as El Chichón? Your chart implies Pinatubo had a larger effect than El Chichón which, according to the first chart, reduced solar transmission by another 3%. Why?
The arguments here that the null periods are too long, that this would somehow be analogous to removing climatological events, and that this is equivalent to removing statistical outliers – are simply not correct.
Why would the outlier status of the data have anything to do with the length of the null periods? How DID you choose the length?
The use of zero anomaly is the correct approach for those periods, because in the absence of other influences, the temperature should average to zero during those times.
You need to support this statement. The periods before and after El Chichón show a temperature rise. Why would it stop if there were no volcano?
—
I should really give you time to answer my previous criticisms. But I must ask: Is the original post irrevocably cast? Instead of replying in the comments, why don’t you place your reasoning as addenda? Not doing so has been a criticism levelled at AGW sites in the past (though not necessarily here). My criticisms may seem harsh but the AGW fold won’t be kinder.
I am happy to debate the scientific merit of this exercise, which is robust. However, it is impossible to debate ad hominem attacks.
Obviously, low numbers occurring on the left side of a graph with a positive linear trend, will reduce the magnitude of that trend. I am frankly surprised that anyone who believes that they understand science or math would object to that idea.
It is also obvious that reduced sunlight at the surface will reduce temperatures. This should be considered a simple, non-controversial exercise.
In my last post
Obviously, low numbers
should read
Obviously, removal of low numbers
DAV,
Again, I am not removing “outliers.”
I am removing time periods where the temperature record was strongly influenced by one time, short-lived, well defined, well understood, external phenomenon. This is not a statistical analysis, no matter how many times you repeat that idea.
Volcanoes have nothing to do with anthropogenic global warming.
Steven Goddard (08:08:46) : Your point about substituting a linear trend is well taken, but the trend was essentially zero from 1978-1997. Thus would produce the same results
Well, OK, but your likely to get disagreement on that. It certainly looks like the period following El Chichón is higher than the one preceding it and simply saying otherwise sounds strange.
Steve,
I think it would be useful if you updated this post, and got all data plotted on the same graph scales. Visual comparisons are difficult given these three different presentations.
I think that would make the presentation more understandable. As it stands now, it requires a lot of visual interpolation.
Applying physics and paleoclimatology to the Algore/UN/IPCC/Pachauri myth of man-made, and animal-made, global warming/climate change.
To paraphrase Alexander Graham Bell: What has the mutitude of UN/IPCC computer models and politicians wrought?
————————————————————-
Comment
http://www.klimamanifest-von-heiligenroth.de/manifest-bgr-e.htm
“Today UN Intergovernmental Panel on Climate Change (IPCC) develops scenarios on climate change in the future. The governments of the world have signed actions against man made climate change since Rio 1992. All activities are based on the thesis that additional CO2 in the atmosphere since the beginning of industrial revolution in the 19th century has led to warming in the 20 th century. As a background they use amongst others few measured temperature data since the end of the 19th century, CO2 data since mid of the 20 th century and results of computer models.”
“All laws of nature however prove the reverse connection i.e. that the temperature is the cause for a release of CO2. The diurnal variation of the CO2, the seasonal fluctuation and the proven time delay of the CO2-deagassing show that these processes are clearly controlled by temperature.”
“Because of this we cannot find any evidence of a warming caused by CO2 in 600 million years of climate history. The average concentration of CO2 in air is currently 380 ppm (parts per million). This is so minimal that a dominant influence on warming is excluded. Man made produced CO2 is about 3% of the whole emissions, that means 11.4 ppm (or 0.00114%) can contribute to warming by greenhouse effect. This is impossible due to laws of physics.”
“Today weather forecasts are valid for hardly more than three days and do not result on calculation of radiation conditions but exclusive on weather influencing parameters as pressure, temperature, humidity, windspeed in air and further data. 71% of the surface of earth is covered by oceans which establish the most effective control of heat and CO2. Human impact on cities and land use are neclectable compared to this. Because climate is weather statistics and in fact climate is influenced by asctrophysical processes, mankind do not change global climate.”
The Heiligenroth Climate Manifesto (15 September 2007)
There is no proven influence on the climate by man-made emissions of CO2.
Scenarios for future climate change derived from computer models are speculative and contradicted by climate history.
There has been climate change at all times of Earth history, with alternating cold and warm phases.
The trace gas CO2 does not pollute the atmosphere. CO2 is an essential resource for plant growth and therefore a precondition for life on Earth.
We commit ourselves to the effective preservation of our environment and support arrangements to prevent unnecessary stress to ecosystems.
We strongly warn against taking action under the assumption of an imminent climate catastrophe which will not be beneficial for our environment and will cause economic damage.
@ur momisugly wattsupwiththat (08:13:37) :
“…lately I get criticized for not completing my work fast enough for some folks expectations.”
I confess to having that thought cross my mind at times until I remember all that you have accomplished in such a short time. Not only is there the surfacestations project but just look at how vigourously this little blog of yours has grown. Frankly, I don’t know how you do it. Perhaps after tomorrow we’ll see a new element at the top of the sidebar.
As for this particular post, it took me a moment to grasp what Mr. Goddard was getting at. I think it is an interesting “what if” exercise. If the climate begins to cool over the next few decades and a number of volcanic eruptions occur, I have no doubt that AGW proponents will claim that those eruptions are masking the warming. Here we have a tool that can take out such effects, both at the early part of the trendline as well as later. With the data from Mauna Loa, the period to be set at zero anomaly can easily be determined and it can be shown if all other factors are still resulting in warming or if cooling is really happening.
While the ash may reflect sunlight and cool the earth while it is airborne, what effect does the ash have on the earths albedo when it settles on ice and snow?
Would it not make the ice and snow dingier and lower the albedo, thereby increasing warming?
This is not an attack on this article or on the exercise but a critique of the basics of doing such exercise. If you can’t take critiques then don’t publish.
“Volcanoes have nothing to do with anthropogenic global warming.”
If we remove everything that has nothing to do with antropogenic global warming, you are eventually left with ONLY antropogenic global warming.
In the same line of logic, then you could remove every natural occuring cooling and warming phenomenon that influence the climate. Then what you are looking at has nothing to do with climate. You end up with man made climate inductions – if there is such a thing and it could be just noise which could show that we have nothing to do with climate – which is not a bad thing to help proving our role in global climate change.
“I am removing time periods where the temperature record was strongly influenced by one time, short-lived, well defined, well understood, external phenomenon. ”
I question that it is so well defined and well understood. It is not an external phenomenon since volanic erruptions are part of the earth and have and important role in global climate regulation. It is more than just ashes in the atmosphere, the repercusions are manyfolds.
REPLY: Criticisms on exercise are welcome, it is only ad homs and snark that we object to. – Anthony
“Here is the Zoom-In for Krakatoa. While the models assumed a reduction in temperatures of about -0.4C for 5 years in this case, you can hardly see any net change in the monthly temperature trend of the time.”
Is it my imagination, or is there a five month lag from almost every volcanic forcing peak to a temperature anomaly peak? I’d be interested in seeing the chart with that red line shifted right about 4 to 6 months.
Yes, ash will temporarily lower the albedo of ice and snow, and will also affect (lower) oceanic albedo, also temporarily, though not necessarily for the same duration.
How much CO² does a volcano belch, anyway?
o/t
Looks to me a strange thing. When we have low solar activity looks that we have great vulcanoes iruptions, in the past. Is that correct or am I wrong? Is possible to have a great connection between the Sun and the vulcanoes? Perhaps magnetism? Thanks in advance.
Steven Goddard (08:36:25) : Again, I am not removing “outliers.” I am removing time periods where the temperature record was strongly influenced by one time, short-lived, well defined, well understood, external phenomenon. This is not a statistical analysis, no matter how many times you repeat that idea.
Just FYI: It’s hard to do any analysis without involving statistics. E.g., you can’t do a regression without using statistics. You have used the word “trend” when describing the temperatures between years XXX and YYY. How did you arrive at that “trend” without statistical analysis or does “statistical analysis” have some particularly restricted meaning to you?
Outliers are removed because of their strong and unfair influence (“bias”) on the analysis. The word actually DOES mean not normal, though. You can’t call them anomalies either because anomalies ALSO means not normal. So what should one call data that biases but is otherwise normal in appearance? I don’t know so I call them “outliers” because they have the same effect regardless of name.
Volcanoes have nothing to do with anthropogenic global warming.
Who said they do? Outside of the context of the AGW debate, what were you hoping to accomplish? Is your work the equivalent of tossing paint on the wall just to see what it would look like?
—-
I don’t want to get int a flame war over this. I think it needs improvement and, in particular, it lacks the reasoning behind your decisions. Whether you change it or not is of course up to you but I suggest you view your post in less adoring eyes than those of a loving parent.
possibly more significantly, ash, soot and other small particles aggressively increase the melting of ice and snow.
Bill P
Thank you, the link to Douglas’ publications (http://www.pas.rochester.edu/~douglass/recent-publications.html
) is very are helpful.
Ray (09:15:52) :I question that it is so well defined and well understood. It is not an external phenomenon since volcanic eruptions are part of the earth and have and important role in global climate regulation. It is more than just ashes in the atmosphere, the repercussions are manyfolds.
It’s valid because they are events that are random and otherwise independent of the temperature record. It’s fair to ask: what would the record look like if this event had not occurred? But that’s the rub. Any invalidity arises from the very real problem of choosing a replacement which amounts to a guess. It’s the biggest hole in Steve’s presentation. He needs to plug it by documenting his choices.
DAV I agree, and I’ve been in contact with Steve by email and he says he’ll post an update, but will not be able to do so until tomorrow. The gap could be replaced with a coupe of choices, yielding different outcomes.
I look at this as the ulterior motive of Global Warming, and that is as an excuse to play Frankenstein Monster experiments on our climate and attempt to control it.
When the Hurricanes were seeded and it all backfired in their faces, they withdrew to thier corners to nurse thier wounds. Now the climate control freaks are back, and they have a new box of matches to play with.