The UAH Satellite Temperature Record With Volcanic Noise Outliers Filtered Out
A guest post by Steven Goddard
I’ve often wondered what the UAH global temperature record would look like if the cooling effects of the eruptions of El Chichón in April, 1982 and Mount Pinatubo in June, 1991 were removed. Large volcanic eruptions shoot fine ash up to very high altitudes, which makes the upper atmosphere less transparent, allowing less sunlight (SW radiation) to reach the lower atmosphere. This has a noticeable cooling effect on the lower atmosphere and the earth’s surface which can last for years, as can be seen in the figures below. Note how the lower troposphere temperatures were depressed during periods when the atmospheric transmission was also depressed.
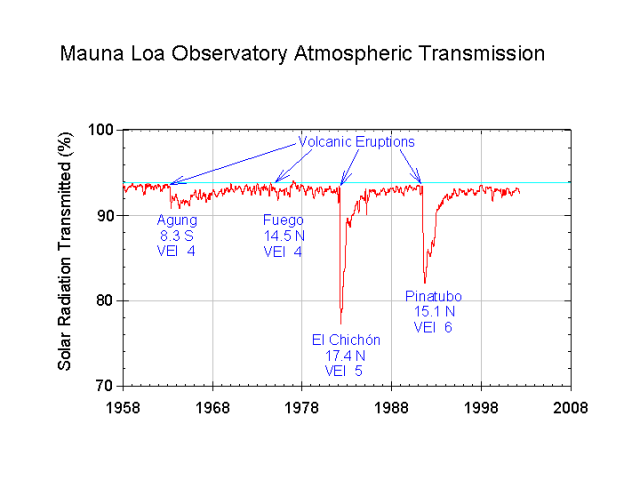
http://upload.wikimedia.org/wikipedia/commons/9/9c/Mauna_Loa_atmospheric_transmission.png
Next let’s look at the UAH satellite record:
http://www.woodfortrees.org/plot/uah/from:1978
Volcanic events are not related to man’s activities, and should not be included when calculating anthropogenic global warming trends.
My experiment was simple enough. I took the UAH monthly data and nulled out the periods of low atmospheric transmission (April 1982-December 1985) and (June 1991-December 1994.) In other words I set those months to zero anomaly. This is a reasonable approach, because zero anomaly is what UAH considers to be the mean temperature for the period. Using Google Spreadsheet’s linest() function, I then calculated the trend. With the volcanoes removed, the global warming trend dropped from 1.3 degrees per century to 1.0 degrees per century.
A far cry from the 6+ degrees at the high end of the IPCC scenarios.
What also becomes apparent from this graph is that recent lower troposphere temperatures have dropped back to near the 1978-1997 baseline. 2008 monthly temperatures averaged slightly lower than 1980 temperatures.
What’s more….if Steven Goddard had presumed a warming trend for 6 years (at say the rate of that decade) you’d probably see the trend drop to near 0 for the 30 year period.
I think the impact of Volcanoes has been considerably overstated.
I’ve looked into the temperature impact of each of the major ones in the temperature record and, although, there is certainly an impact, it is less than previously thought and it is certainly less than the global warming models have built in for them.
This is what GISS Model E has built in for volcanoes with as much as -0.4C impact for several years for the major volcanoes of Krakatoa and Mount Pinatubo for example.
http://img101.imageshack.us/img101/7802/modelevolcanoesmr4.png
Here is the Zoom-In for Krakatoa. While the models assumed a reduction in temperatures of about -0.4C for 5 years in this case, you can hardly see any net change in the monthly temperature trend of the time.
http://img297.imageshack.us/img297/16/krakatoata5.png
Here is the Zoom-In for El Chichon. Temps actually increased by +0.5C immediately after El Chichon (compared to the global warming models which included a -0.35C impact). Note there was a Super El Nino in 1982-83 which effectively overwhelmed the El Chichon volcano.
http://img232.imageshack.us/img232/760/elchichonks8.png
Here is Mount Pinatuba. It seems to have had the biggest impact on temperatures of all the volcanoes and the global warming models seem to have got this one closest (of all the volcanoes) but the modelled impact is still off by quite a bit in the long-term.
http://img55.imageshack.us/img55/2716/mountpinatubanb7.png
Note there is no longer any negative impact built into the warming models for volcanoes since it has been over 17 years since the last major one.
I got to experience volcanic effects first hand while living in Anchorage, Alaska from 1975-1978 (supporting missle systems for our uncle).
Woke up one winter morning and thought things looked a bit more “dingy” than usual outside, even though the sun was out and shining brightly.
I went outside, and there was a layer of volcanic ash covering everything. If you took a shovel and scooped off just the top inch or two, the “pristine” snow underneath almost glowed.
It was a strange experience, and it lasted for quite some time.
JimB
off topic… or complimentary topic… looks like he who shall not be named has a new paper out.. look at the summary, do I sense a bit of back peddling there? He actually mentions *shock* ocean currents.:) The rest is more of the same old crap. I still wonder why this guy has his job. http://www.columbia.edu/~jeh1/ See Jan 13th post. Got to love a guy who uses himself as three references.. hahahahaha!!!
Can someone share the link to the Douglas and Christy paper?
This might be of interest
http://landshape.org/enm/announce-new-fraud-detection-website/
“Detecting ‘massaging’ of data by human hands is an area of statistical analysis I have been working on for some time, and devoted one chapter of my book, Niche Modeling, to its application to environmental data sets.
The WikiChecks web site now incorporates a script for doing a Benford’s analysis of digit frequency, sometimes used in numerical analysis of tax and other financial data.
I have posted some initial tests on the site: random numbers and the like. I also ran each of the major monthly global temperature indices through the site: GISS, RSS, UAH and CRU. The results, listed from lowest deviation to highest are listed below.
RSS – Pr<1
GISS – Pr<0.05
etc etc
A few points.
This analysis does not remove statistical anomalies. It is removing two well defined non-climatological events, which have a well understood cooling effect. Even a 1% reduction in solar energy received at the surface, causes more than a 1C reduction in average surface temperature.
http://en.wikipedia.org/wiki/Black_body#Temperature_relation_between_a_planet_and_its_star
The arguments here that the null periods are too long, that this would somehow be analogous to removing climatological events, and that this is equivalent to removing statistical outliers – are simply not correct.
It does not remove “high and low” temperatures. It removes two time periods when there was a known non-climatological bias to the temperature.
The use of zero anomaly is the correct approach for those periods, because in the absence of other influences, the temperature should average to zero during those times.
The inclusion of ENSO data would be interesting as a more complex multi-variate analysis, but this analysis intentionally uses only one degree of freedom of a well understood non-climatological bias to the data set.
Shocking cold wave drops temps to 40 below zero
http://news.yahoo.com/s/ap/20090114/ap_on_re_us/snowstorm
volcanic eruptions do nothing, only man and his release of the evil CO2 will destroy the planet, it’s in Hansen’s bible of destruction.
I was going to say what Chris H said, only probably snarkier.
david douglass,
Do you agree with Steven’s analysis here?
Chris H,
As Steve M says, the cooling that is removed is near the beginning of data collection, thus reducing the trend. Not hard to follow……
Also, I must say I generally agree that natural events should not be removed from any data analysis or both sides will be doing it. All natural events, whether frequent or once in a lifetime are part of the game in a non-linear system.
Jan 14, 2009
NOAA: 2008 Temperature for U.S. Near Average, was Coldest Since 1997; Below Average for December
http://www.icecap.us/
More weather:
http://news.yahoo.com/s/ap/20090114/ap_on_re_us/snowstorm
I can’t remember many of these weather events in the last 20 years. The number of these has clearly increased in the last two years. Either more cold air is building up in the Arctic or something in the jet stream is now allowing this air to drive further south. Does anyone have an explanation?
The point about eliminating bias to find a valid trend is reasonable … if we can remove all biases. Not sure if this is possible in a chaotic system where so little is known.
@ur momisugly Steve M. & Chris H:
“Why would the global warming trend dropped from 1.3 degrees per century to 1.0 degrees per century, when you REMOVED the effect of volcanoes, which by definition block sunlight (and reduce warming)?”
I had exactly this question in mind. The comment by Steve M. clarifies nicely. We are not dealing with an observed mechanism, but an artifact of statistical manipulation of data, correct?
Chris H.
Remember we are looking at total spread of signal variation, how much the temps have changed, and not actual temps.
Volcanic ash would have an affect wherever it happens to be in the atmosphere. Climate in that atmosphere would determine how long it stays afloat or gets washed out. I still think the premise to start with is that ash will not be well mixed globally so finding a global signal is probably the result of post raw data averaging by the folks that give us global temperature data. Because of adjustments that go both forward and backward in the anomaly (and don’t ya wish they’d stop doin that!?!?!?) data, one would be hard pressed to determine exactly when to start and end the filter. Still, I ask the question or pose the ponder that I wonder if ash from volcanoes in the Pacific Northwest behave differently in the atmosphere (washes out earlier) than ash in the Southern Hemisphere (lasts longer).
This got me too. I guess the way to think about it is that while removing cooling events should raise the overall average, the trend is a different matter. What’s interesting to me is that how quickly temperatures rebound to a more typical value after the volcano is over. I’m not sure what that tells us exactly but it seems interesting. I’ve been reading Svante Arhennius’s book “Worlds in the Making”. His take on global warming was a little different than the current hand wringing. He regarded it as a good thing that a future return of an ice age would be forestalled. He also stated that CO2 concentrations were lower over the oceans because the ocean absorbs so much of it. It seems that the wiggles in Keeling’s graph of CO2 concentrations at Mauna Loa tell us something similar – that there is a strong tendency to pull excess CO2 out of the air. Why else would its concentration be so low compared to Oxygen or Nitrogen? It tends to get pulled out, and I assume ends up in carbonate rocks.
Any attempt to ascribe any particular event with X-units-of-influence will always generate an uproar. If you state volcanoes cause X units of cooling you are bound to provoke a fascinating debate.
I feel this is great. Debate is good; what I dislike is the idea that “the debate is over.”
Beyond the initial cooling, I’ve read some ideas which suggest volcanoes may have a secondary effect, which warms the earth. Some suggest the cooling may instigate a rebound, a sort of slosh of the Pacific which manifests as a El Nino. Therefore volcanoes cause warming, as well as cooling.
The chemistry and photo-chemistry of the upper atmosphere is also involved. I can’t remember the exact steps, but either the SO2 attacks the Ozone, or the SO2 breaks down to something which attacks the Ozone. With less Ozone the UV radiation is effected, and you move on from there: One level of the atmosphere is warmed, which causes another to be cooler, and so on and so forth.
You can research a lot of this stuff if you Google “Ozone Hole” rather than “Global Warming.”
In any case, the more we learn the more we see how elaborate, intricate and wonderfully elegant the world we live in is. It becomes more and more obvious that Hansen’s and Mann’s models are way, way, way too simplistic.
Even something like plankton-rising-to-feed-at-nightfall can influence sea-surface temperatures, which influences the rainfall in the sub-Sahara, which influences the amount of dust in the atmosphere, which influences the amount of microscopic iron sifting down to the surface of the sea to feed plankton and algae and cause coral bleaching.
Debate is great. Study is wonderful. But for any one man to claim he understands all the nuances and interactions of our atmosphere indicates the man has achieved some sort of Cosmic Consciousness, or else is a fabulously arrogant nut.
Nice work but I think it can be improved by superimposing all three charts. Another thing to look at: the “UAH Without Volcanic Outliers” chart appears to have uniform spacing along the x-axis but some labels have been skipped. The x-axis is way too crowded and hard to read. A link to a larger image would have been nice.
What you’ve done is essentially the same thing as removing an object from a photograph. It becomes necessary to replace it with “what should be there” which is always open to interpretation. In this instance you’ve chosen to replace the cooling with zero anomaly. Some might argue that perhaps a linear trend exhibited connecting say, the before and after of the El Chichón period would have been more appropriate.
I think it’s already been mentioned that the attributed effects may be too long.
It may also occur to someone that Pinatubo seems to have had the same effect as El Chichón during an even warmer period despite different solar radiation transmission rates.
You need to add the reasoning behind your decisions.
E.M.Smith (01:37:38) :
This is not a climate issue so I will say this only once.
There is a “received dialect” in English. It is that given by the International Phonetic Alphabet (IPA) entries after main word entries in most dictionaries. See http://en.wikipedia.org/wiki/Help:IPA_for_English
That said all the English people I will admit to knowing rather like to hear it spoken in many different ways and would certainly encourage others to use it as best they can (generally) without criticism.
(Although it sometimes makes for a good chuckle – you shouldn’t “misunderestimate” our sense of humour)
Maybe we won’t have long to wait
http://www.iceagenow.com/Chait%C3%A9n_Volcano_a_Tambora-sized_Event.htm
Remember that around Maunder minimum, on 19 february 1600 the Huaynaputina erupted in the biggest eruption recorded in history:
http://en.wikipedia.org/wiki/Huaynaputina
This is interesting
“The rapid shrinking of glaciers in Greenland during recent years may stall, diminishing the Arctic island’s potential contribution to rising sea levels blamed on global warming, a U.K.-led research team found.”
http://www.bloomberg.com/apps/news?pid=20601100&sid=aXm16yRTS344&refer=germany
The more i learn the less i worry.
This issue takes us back to solar cycles.
See: http://petrology.oxfordjournals.org/cgi/content/full/46/4/783
“Estimates of the stratospheric loading of H2SO4 following the eruption of the Huaynaputina, Peru, in 1600 are consistent with this eruption causing the low temperatures for the summer of 1601, which were among the coldest in 1500 years in Fennoscandia (de Silva & Zielinski, 1998). A similar temporal link has been established between the low temperatures recorded in 1816 (‘the year without summer’) and the eruption of Tambora (Sumbawa island, Indonesia) in April 1815. This eruption produced an estimated stratospheric loading of 200 Mt H2SO4 and is considered the greatest S-producing eruption of the last 750 years (Stothers, 1984; de Silva & Zielinski, 1998; Palmer et al., 2001). If high-S volcanic eruptions are associated with, and perhaps triggered by, oxidized basaltic melts (as in Mt. Pinatubo), modeling of these processes needs to account for S being present as sulfate in the basalts.”
Lame-man question:
“Large volcanic eruptions shoot fine ash up to very high altitudes, which makes the upper atmosphere less transparent, allowing less sunlight (SW radiation) to reach the lower atmosphere.”
When the ash settles in the Arctic, could that have been part of the cause of the Sea Ice doing poorly?