
A few days ago I wrote in State of the Sun for year end 2008: all’s quiet on the solar front – too quiet that “No new cycle 24 predictions have been issued by any solar group (that I am aware of ) in the last couple of months.” Coincidentally and shortly after that, NASA’s David Hathaway updated his solar prediction page here. He’s made a significant backtrack over previous predictions, and now for the first time he is claiming cycle 24 will be less than cycle 23, not greater.
Kudos to our WUWT resident solar physicist Leif Svalgaard for his foresight. He has been saying for many months that cycle 24 would be significantly reduced, and not greater than 23.
Here is Hathaway’s most familiar graphic, which has an active sun in the background. Perhaps it is time to update that background to something more reflective of the times…..oh wait, read on.
Click for a larger image
Here in this graphic, from Klimadebat.dk we can see how much has changed since Hathaway’s last prediction update in October 2008:
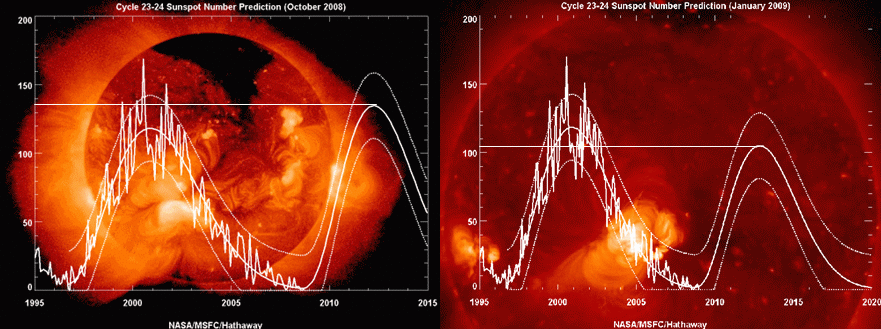
Click for a larger image
Note that Hathaway did indeed change background graphics from October to January. Its just not quite the smooth and nearly featureless ball we see today.
Courtesy of Mike Smith, here is the March 2006 prediction graphic:

Click for larger image
Hathaway’s predicted Cycle 24 maximun in March 2006: 145
Hathaway’s predicted Cycle 24 maximun in October 2008: 137
Hathaway’s predicted Cycle 24 maximun in January 2009: 104
I’d say that represents a sea change in thinking, but the question now is: How low will he go?
I was looking for a substantial quote from Hathaway in his prediction page, but it appears he is being quite conservative in his language, focusing mostly on methodology, not the prediction itself. I don’t blame him, he’s in a tough spot right now.
Meanwhile we’ve had an entertaining episode with the most recent Cycle 24 transient sunspot/sunspeck that appeared briefly yesterday then disappeared almost as fast as it appeared. See the area on the lower right of the sun:

In response to my query asking if he concurred with my assessment of it being an SC24 speck, (he did) Leif wrote to me: “Seems that it has received even a region number 11010. Somewhat ridiculous.”
Then about 12 hours later: “And SWPC has withdrawn the number. No numbered region after all.”
It will be interesting to see which organization counts this event, or not, in the month end tally. Up until this point, we had 25 consecutive spotless days. Now we have more, or not.
h/t to Frank Lansner for the Klimatdebat.dk graphic link and a bunch of other commenters who made note of the Hathaway page
I saw that recent anemic sunspeck twice. The first time it was so small I suspected it was an SP (stuck pixel); then it disappeared, reappeared briefly before finally disappearing again. Never did see SWPC assign it a number but then I wasn’t watching their site like a hawk.
2009 should be a most interesting time for Dr. Hathaway. If the anemic nature of SC24 persists through the year, I wonder what a revised prediction will then look like.
And then there’s this interesting article from the UK press about the danger to astronauts because of a weakened solar wind which would see greater levels of cosmic rays. Nothing said about possible impacts on the planet itself:
http://www.dailymail.co.uk/sciencetech/article-1108983/Astronauts-threatened-cosmic-rays-sun-active.html
About the steepness…it looks like he’s actually starting to come down to earth. Here’s an update from a post I did last August, showing a comparison of SC “transitions” for the longer falling cycles (more than 139 months), and the rise/magnitude of the cycle that followed.
From Hathaway’s prediction of June 2008, he only had SC21 with as steep a rise after such a long cycle (SC20).
http://i36.photobucket.com/albums/e7/niteowl496/Cycle_Transitions_200806.png
Same thing for his prediction last October.
http://i36.photobucket.com/albums/e7/niteowl496/Cycle_Transitions_200810.png
Now, he’s got SC14-15, and SC09-10 in the same neighborhood.
http://i36.photobucket.com/albums/e7/niteowl496/Cycle_Transitions_200901.png
I think he’s still a bit high, though. I’m guessing a max of around 80 in the SC24 pool.
PS. Help with a blink comparator, anyone?
TerryBixler (08:39:05) :
” Specs not counted here
http://www.swpc.noaa.gov/ftpdir/indices/DSD.txt ”
Sunspotter (08:45:33) :
” NOAA is currently listing 01/07/09 as a big fat “0″ in the SS field. http://www.swpc.noaa.gov/ftpdir/indices/quar_DSD.txt ”
Shades of the Great Summer Sunspeck Debacle !
http://wattsupwiththat.com/2008/08/31/sun-has-first-spotless-calendar-month-since-1913/
WAS there a NOAA number or was there NOT ?
Those who get the daily “Ursigram” saw that the “ISN” (International Sunspot Number) was ZERO, yesterday and today.
Will it STILL be zero at the end of the month, AND for the “Definitive” count released by SIDC some months from now ?
Stay tuned to WUWT !
Given the error of margin..sun spot count could stay close to 0 out to 2010, and still be with in this prediction.
MSM finally reporting on Alaskan cold
http://news.yahoo.com/s/ap/20090108/ap_on_re_us/alaska_extreme_cold
I think I will find a Tarot card reader for advice. No better, perhaps, but much cheaper.
In defense of Hathaway?
I will give this to him:
He is willing to revise his models when they are faulty, and he has claimed that this is an exciting time (my paraphrase) for solar science, since it will validate some models or statistical approaches to solar cycle prediction and negate others.
Unlike the AGW camp who start calling cooling as the new sign of warming!
I noticed sunspot 1010 mentioned on spaceweather.com but couldn’t see it; only a slight speck even in the magnetogram
With the December number, we are now in the realm of “once in a lifetime” averages for all recent averages up to five year averages. It’s really quite fascinating.
I did a recent post taking a look at how current averages compare to historical and then looked at consecutive cycle lenghts to see how we are stacking up historically.
If interested, you can find it here:
http://digitaldiatribes.wordpress.com/2009/01/06/december-2008-update-on-sunspot-stats/
crosspatch (08:55:51) :
Dr. Hathaway’s forecasts before he seemed to me to be basing his prediction of cycle 24 on solar magnetic properties of cycle 23. The gist of it was something like “historically, when the properties of a cycle have been X, then the strength of the following cycle has been Y”.
It is precisely known how Hathaway makes his predictions. And it has nothing to do with the length of the cycle. Cycle 20 was also long, yet cycle 21 was the second highest cycle observed. David’s method is simple: it has been noted that geomagnetic activity often has a peak some years before solar minimum and the assumption [it is just that, as there is no physical basis for it] is that the size of that peak is related to the next cycle [the ‘evidence’ for this is that it seemed so in the past, but, remember that correlation is not causation, and the method failed for cycle 23]. So it comes down to identifying which peak to choose as ‘the peak’. There was a very large peak in 2003, then a smaller one in 2005, and an even smaller one in 2008. So we have three choices and three predictions: 2003 -> 145, 2005 -> 95, 2008 -> 75 [these numbers are just approximate, one should read them off David’s graphs to get more ‘precise’ ones]. All that has happened is that Hathaway has changed his view on which peak to pick. First he picked 2003, now he goes for 2005; should he go for 2008 [which he might claim he should have done to save his method when the Sun actually peaks at Rmax = 75] he will predict an even lower cycle. As a final touch he averages the number with a prediction by Thompson based on the number of disturbed days at minimum. This bumps up the final prediction a bit to 104 or so. No mystery here. Everybody can join in. Hathaway is very transparent on how this is done.
I just read Landscheidt’s paper published in 2003.
http://bourabai.narod.ru/landscheidt/new-e.htm
Very scary. No wonder Putin is using energy (natural gas) as a “weapon.”
Thanks L. Gardy LaRoche (08:28:09) :
Repeatedly “adjusting” a “forecast” is not forecasting at all as the predictive value is nil. Looked at with a generous eye, the only glimmer of science left is Hathaway somewhat modifying his “hypothesis” in light of recalcitrant data.
i don’t believe he’s adjusting a forecast – rather making a new one. might be a nitpicky distinction, but Hathaway doesn’t appear to be saying that his oct 2008 forecast was for 104, rather his jan 2009 forecast is for 137.
@chris Schoneveld, why do you have more faith De Jager’s over Hathaways? Sorry for any elementary questions, but i’m just starting to wrap my head around solar activities.
Dr. Hathaway will be more respected if he simply says he doesn’t know what the future portends… there’s nothing wrong with admitting that… to throw up numbers and constantly changing his predictions is not science.
That latest potential sunspot (1010) was only seen by spacecraft (SOHO) so it does not count.
As for Hathaway, he is going to end up being a household joke if he keeps dealing off the bottom of the graphic. His latest concoction is being eroded already, as it is saying “Ramp here, Ramp now!”.
Fiddlesticks.
“he still hasn’t changed his forecast that cycle 25 will be extremely weak based on certain properties of cycle 23.”
I think Hathaway’s original 24 and 25 predictions were based on different models and 25 was not based on 23, per se, but current values of Dikpati’s conveyor.
See:
Astronauts threatened by cosmic rays as sun becomes less active
By Daily Mail Reporter
Last updated at 10:19 AM on 08th January 2009
Hathaway wouldn’t be in “tough spot” now had he not oversold his predictions and hyped them with GW craps some years ago.
Wounded by his own sword. Serves him well.
Hathaway might next try a bleak sun setting in a frozen Antarctic wasteland for his backdrop.
tetris (09:20:44) :
” Repeatedly “adjusting” a “forecast” is not forecasting at all as the predictive value is nil. Looked at with a generous eye, the only glimmer of science left is Hathaway somewhat modifying his “hypothesis” in light of recalcitrant data…”
See Jan Janssens’ discussion of the perils of forecasting Solar Maximum using Solar Minimum parameters.
http://users.telenet.be/j.janssens/SCMinpredMax.pdf
(“Though these relationships seem to exist, the uncertainty in them is very high, making the uncertainty in the predicted amplitude really big and hardly of any practical use.”)
Hathaway’s original forecast was based on the idea that, “According to theory and observation, the speed of the [Sun’s Great Conveyor] belt foretells the intensity of sunspot activity ~20 years in the future…”
http://users.telenet.be/j.janssens/SC24.html
http://science.nasa.gov/headlines/y2006/10may_longrange.htm
Has he now abandoned this idea ? We don’t know.
However, if he is, as tetris suggests, merely adjusting his forecast to better match uncooperative data, then he is in effect simply pulling in Solar Minimum data to predict Solar Maximum, and introducing the errors and uncertainties Janssens identifies (though at this late date, it may seem as though Hathaway has little left to lose either way).
I for one would like to know what the now re-re-re-revised numbers are based on.
I would also like to hear from Dikpati, de Toma and Gilman, whose new model…
“Breakthrough Research to Improve Forecasts of Sunspot Cycle”
http://www.ucar.edu/news/releases/2004/sunspot.shtml
“Scientists Issue Unprecedented Forecast of Next Sunspot Cycle”
http://www.ucar.edu/news/releases/2006/sunspot.shtml
…was going to banish uncertainty forever from the prediction of solar cycles.
Press releases and hype, confident predictions, fun and excitement…
until the real data comes in.
How about a Press Release now, Ms. Dikpati ?
Pearland Aggie (09:21:56) :
Claim: Low solar activity and Little Ice Age was correlation was merely ‘coincidence’
http://co2sceptics.com/news.php?id=2489
The link goes on to say: “come on Nigel the above Solar Irradiance Graph looks like its saying it’s more then a coincidence.
But the ‘above graph’ is an obsolete reconstruction of solar irradiance that is not consider valid today. For a more probable reconstruction that reflects what we have learned the past decade see the red curve on: http://www.leif.org/research/TSI-LEIF.png
Are these predictions anything more than guessing by someone with a big job title and a big diploma? Is there an objective way to know when the curve is going to start a new uptrend, and at what rate?
SOLARCYCLE24.com says 26 official days since last spot…
http://solarcycle24.com/
we’ll see what the end of the month brings…
Leif Svalgaard (09:58:44) :
“…David [Hathaway]’s method is simple: it has been noted that geomagnetic activity often has a peak some years before solar minimum and the assumption [it is just that, as there is no physical basis for it] is that the size of that peak is related to the next cycle [the ‘evidence’ for this is that it seemed so in the past…”
Here’s that paper:
http://users.telenet.be/j.janssens/HathawayWilson2006.pdf
“Geomagnetic activity near the time of sunspot cycle minimum has been shown to be a good indicator for the level of maximum activity during the following cycle.”
Jan Janssens was able to quickly show that even if that method were correct, Hathaway’s prediction was too high by 7%.
http://users.telenet.be/j.janssens/CommentsHathawayaa.pdf
“More importantly, it is shown that the applied smoothing leaves out
valuable information in the aa-i data, and contributes to an excessive amplitude prediction for SC24.”
This paper says hurricanes may be related to cosmic rays, sunspot activity.
http://www.sciencedirect.com/science?_ob=ArticleURL&_udi=B6V3S-4RC2S41-1&_user=10&_coverDate=11%2F03%2F2008&_rdoc=1&_fmt=&_orig=search&_sort=d&view=c&_acct=C000050221&_version=1&_urlVersion=0&_userid=10&md5=dbf0cf4a752a93b8069e592ff41dd8e6
Hathaway has been willing to scale back his forecasts, unlike some climate people who simply shift the past data upwards to match their earlier predictions.