reposted from ICECAP
By Dr. Richard Keen, University of Colorado
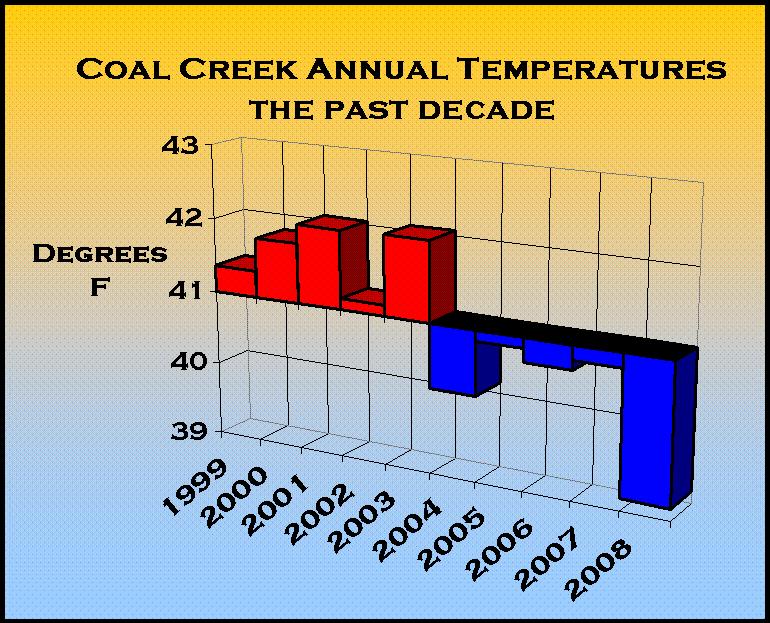
I’m the NOAA co-op observer for Coal Creek Canyon, Colorado, elevation 8950 feet, in the foothills NW of Denver. Here is a graph of average temperatures for the past ten years. 2008 is by far the coldest year in the past decade, with an average of 39F.

See larger image here.
That’s full 3 degrees F colder than 2003. Each of the past five years is colder than any of the previous five years.
This is only one station of the thousands in the NOAA co-op network, but I thought I’d show you the data before it’s adjusted and homogenized by the usual suspects.
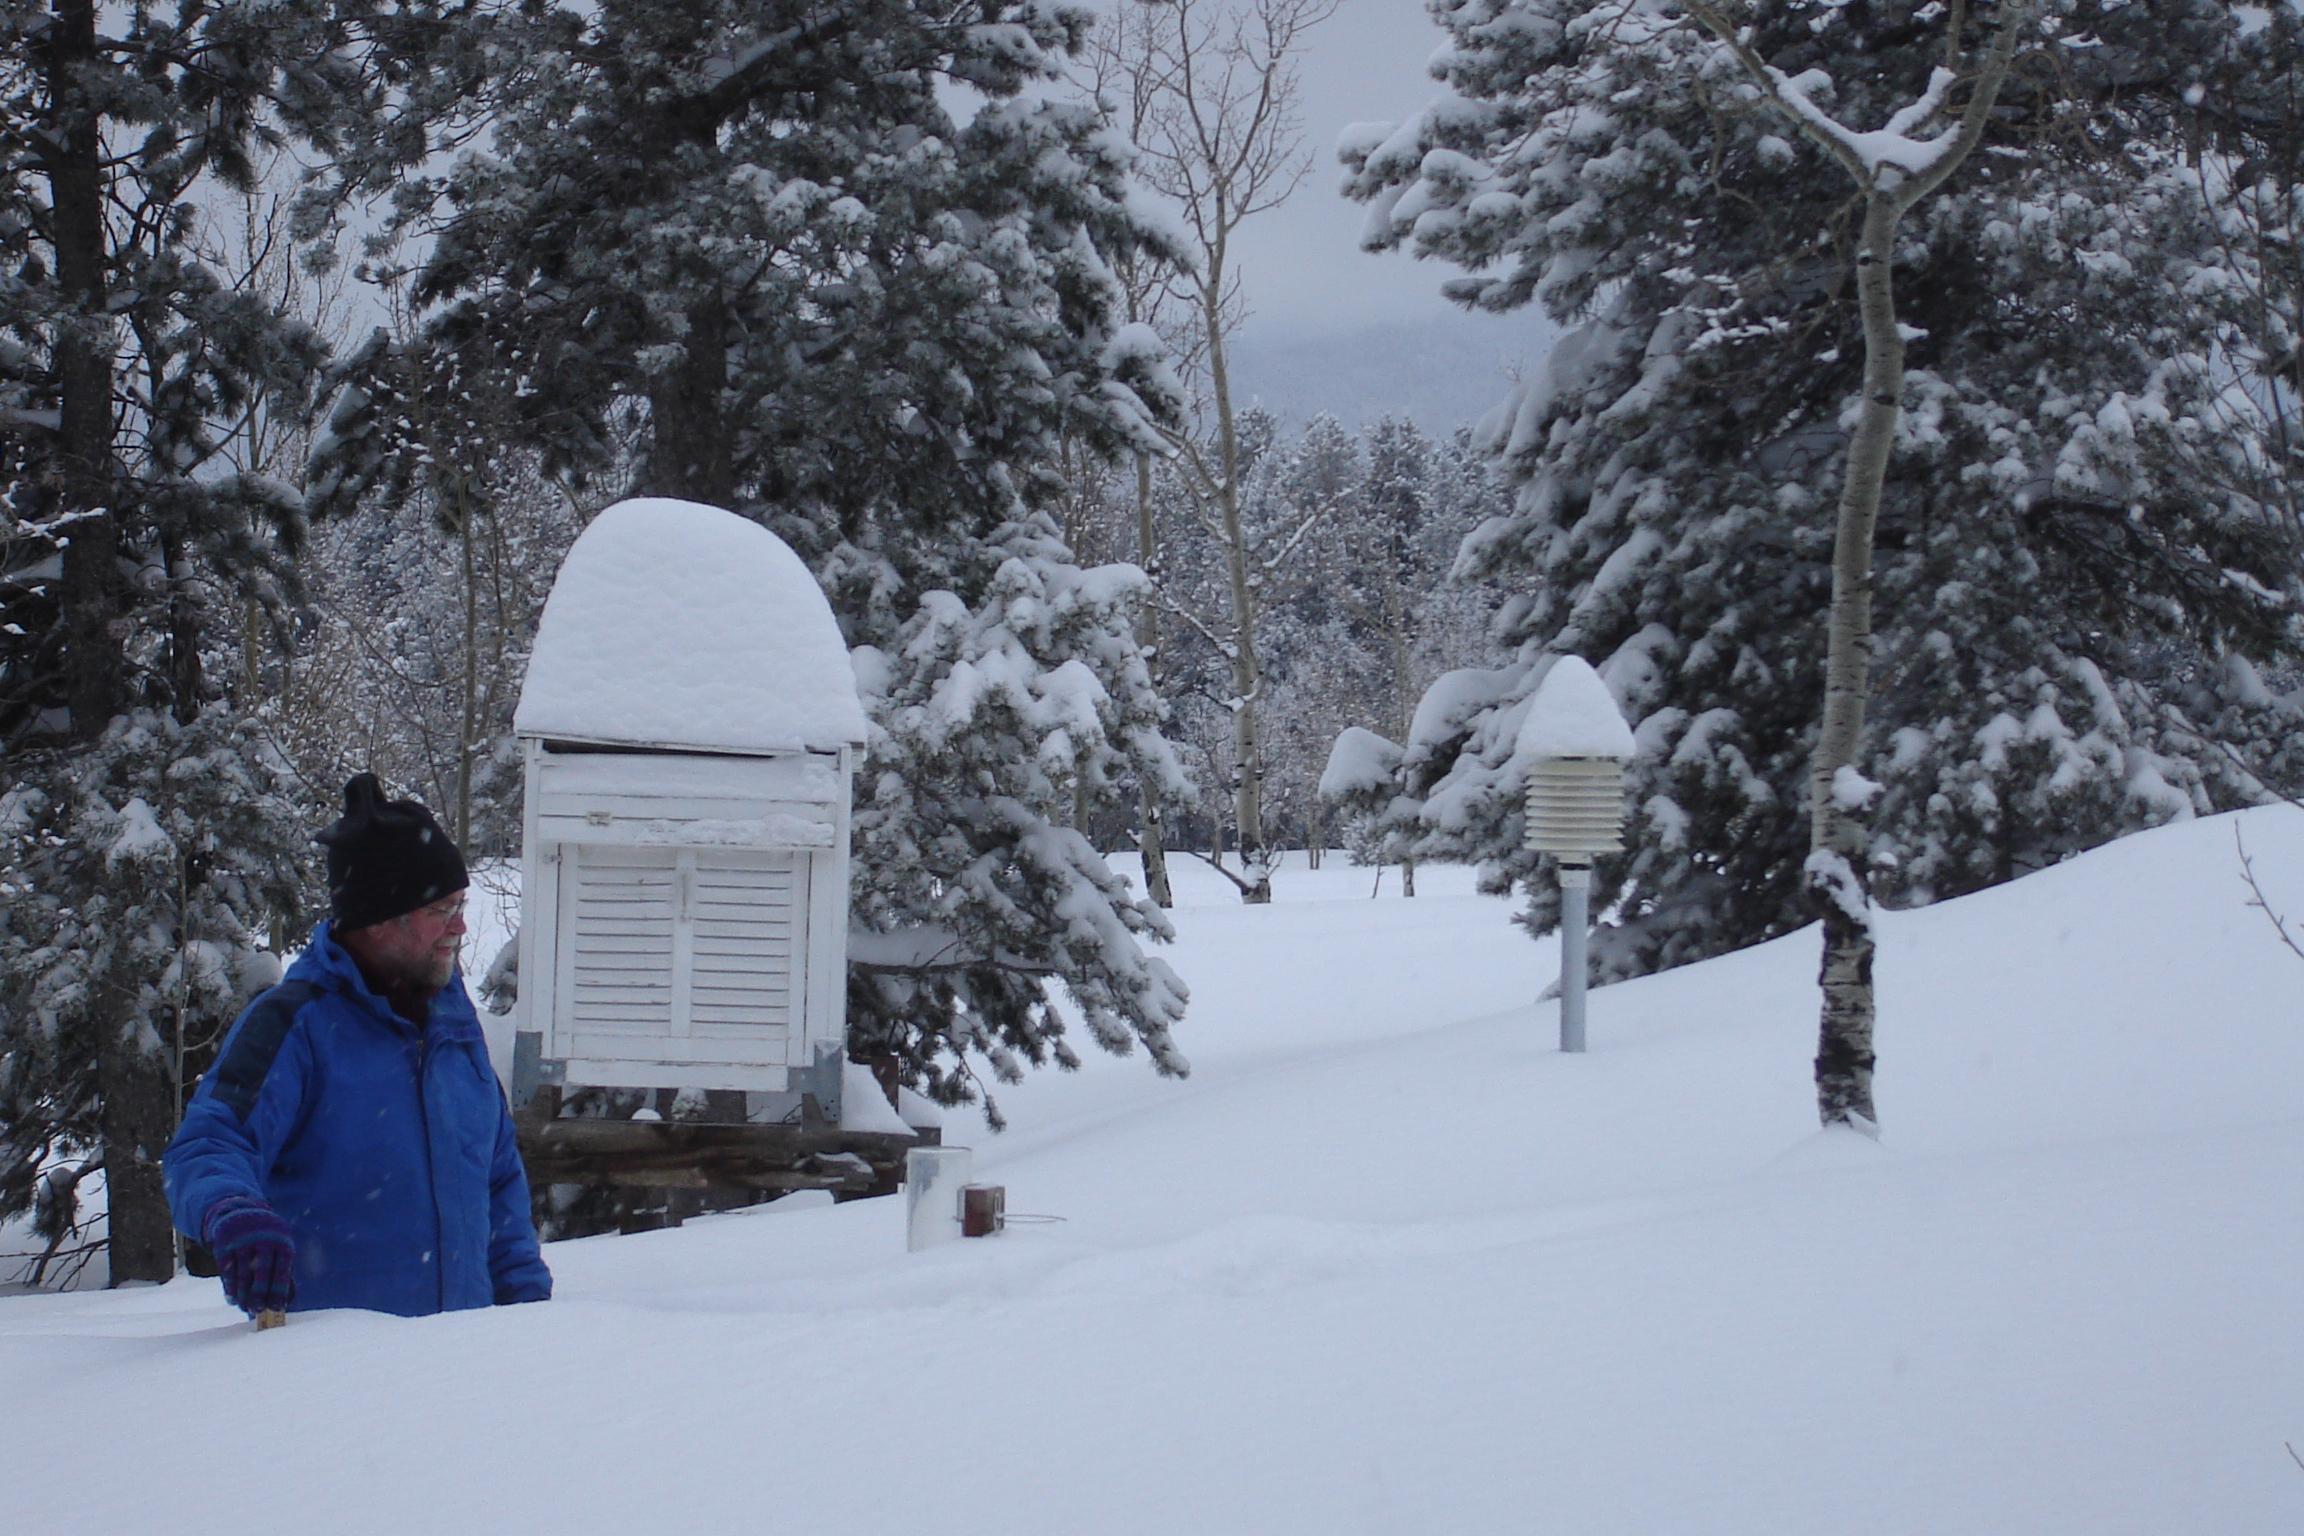
Here’s a photo of the station in January 2007, in the midst of a record round of snow storms in Colorado.

See larger photo here.
TonyB (16:19:11) :
I’m sure you wont be able to get Namibia back to 1850 but you might for Cape Point in SA. Long term British influence there and of naval importance. I’ve looked at the SA weather bureau but if it is available it seems you have to subscribe.
Namibia would have been German South West Africa (Deutsch-Südwestafrika) after 1884. Germany would have been responsible for any records prior to the end of World War I and after the German surrender, South Africa was given the League of Nations mandate.
So if you want to go back to 1850, about the only records you are likely to find are going to be reports from ships and missionaries. After 1884 you might find some stuff in German archives until WWI. South Africa after.
Hi all,
First, I’m awe-struck that there have been over 150 comments about my data!
I’ll copy some of the comments and add my comments…
Tim F (20:29:34) :
This is a great article–many thanks to Dr. Keen. In the interest of forwarding citizen science could anyone post how the yearly average is calculated for a station. Is it simply the arithmetic mean of the daily average/365? How many readings are sufficient for a daily average?
Reply: A co-op observer reads the 24-hour max and min once a day (at 9 pm, in my case). The daily average is simply the average of the max and min for each day, and the yearly average is the mean of the 365 (or 366) days.
The co-op network has thousands of citizen scientists, and I’m delighted to be one of them.
Sean Ogilvie (20:43:21) :
Writing from Georgia, it looks positively balmy out there!
Question: Is it policy to remove the snow? I would think that it would make a difference.
Reply: when my son took that picture, it was 50 degrees warmer than the all-time min of -36 in Feb. 1989. No, the snow stays put. Most of the time it blows off, however. Since the snow is sitting atop an already efficient double roof, I don’t think it affects the screen temperature very much. If it warms up suddenly and there’s a mass of 32-degree snow on top while the air temperature is, say, 50 degrees, there could be a refrigeration effect. But that would most likely occur on a sunny day, in which case a bigger effect would be reflected sunlight (from the snow covered ground) filtering into the box and raising the temperature. I suspect this can amount to a degree or more sometimes.
Another effect of the deep snow is to raise the effective ground level closer to the thermometer. However, the local terrain is sloping, which prevents sharp inversions from forming, so the changing ground level won’t be as critical as it might be in a flat, level location with more shallow inversions.
An extreme case occurred in March, 2003, when a 72-inch storm raised the effective ground level to ABOVE the thermometers! But that is rare, of course (otherwise we’d have glaciers!), and typical snow cover in winter is usually 6 inches or so.
Gary Palmgren (06:17:38) :
I see there are trees close the the thermometers. I’ve always wondered about the proper siting for the temperature gauges in a forested region. Shouldn’t they be located in the forest? The site rating for this post is irrelevant as it was stable over the last 10 years with no artificial heat sources.
It’s kind of hard to keep the thermometer clear of snow when it snows a foot overnight. Would you use heater to keep it snow free? 😉
Chris D. (06:31:41) :
Dr. Keen or Anthony,
I didn’t find Coal Creek in the Surfacestations gallery (nor a placeholder). Would this station qualify for inclusion in the gallery (record of sufficient duration)? Also, how free of microsite bias would you say this station is, and has been, over the duration of the record? I see it’s on a slope, but assume that’s fairly representative of the general area. Thanks for the post!
REPLY: It is not a USHCN station, simply a COOP station. The reason it is not USHCN is duration of record. – Anthony
Reply: Some of you have noted the trees, and indeed, there is partial shade on the shelters at times. The vegetation coverage is representative of the general area (Colorado foothills, with lodgepole pines broken by meadows). It would be impossible to find a location that fits Tony’s ideal – a 2-degree horizon doesn’t exist in the Rockies! That criterion would be as unnatural as, say, a short-cut grass surface in Antarctica! I think a more important criterion, and one which the NWS tries its best to fulfill, is to have an observer who is conscientious, consistent, will keep observing for a long time, and who believes missing data is a sin. I actually started observations 25 years ago, but became a co-op station in 1993.
Jim B in Canada (22:12:08) :
The people who frequent Wattsupwiththat, climateaudit, climatesci.org are proud to be called Dorks, Nerds, and Geeks, because we breath the minutiae of science, because in the end, that’s where all real science is done.
Reply: Right on! As Yogi Berra said, “You can observe a lot by just watching”. I like to think that 200 years from now, some future geek will look at my data – and everyone else’s – to discover some great truth about our world. Just like today’s geeks look at data taken 200 years ago by Franklin, Jefferson, et al.
robert gregg (22:33:07) :
I am surprised he has a 4″ plastic precip gauge instead of a
Standard 8″ gauge. With that much snow it seems his readings for total precip may be too low.
Reply: The 8-inch gauge was inside the house at the time, its contents melting for measurement. I also have a 4-inch gauge, several small wedge gauges, and a heated tipping bucket. As I said, missing data is a sin, so I don’t rely on just one gauge. There’s also several backup thermometers in the box.
Michelle (02:28:45) :
Cooling at “Coal Creek”? I assume then that all that nasty black coal at Coal Creek has been left in the ground, otherwise there is no way there would be cooling there?
Reply: Actually, it’s “Coal Creek Canyon”, SW of Boulder and NW of Golden. “Coal Creek” is in SW Colorado, over a hundred miles away. Mail has been misdirected more than once. The local geology is granite. The coal that the creek is named after is out on the plains, after the creek leaves the foothills on its way to the South Platte River.
CookevilleWeatherGuy (03:46:04) :
When the snowfall is WAIST DEEP, I’ll give the guy a break on some snow accumulating on top of the instrument ’shacks’….
Reply: Thanks for the break. When you’re up to your a** in alligators….
Sullivan (07:50:41) :
Obviously Dr. Keen is not much of a scientist. We all now know that real scientists work with corrected data and not the stuff actually observed. Any high school chemistry student knows – you have to screw around with the data to get the result the teacher wants.
Dr. Keen – Did you pass high chemistry?
/sarcasm
Reply: I can smooth, adjust, blend, and homogenize data as well as the best of them! I actually enjoy doing it – it’s relaxing! But this time I sent out the data before playing with it.
I did pass HS chemistry, but it was easier then – only 4 or 5 known elements, including sulfur and carbon, the favorites of high school alchemists.
George E. Smith (14:49:37) :
Dr Keen,
Where abouts is your barbecue, under all that “partly cloudy” ?
It looks like you have a nice job though. Should we send someone to dig you out; or can you hold your own for a while?
George
Reply: the BBQ is on the other side of the house, and, needless to say, there is no AC (except for the natural kind). Please don’t dig me out; I love being stuck here and unable to go to work (I teach at the U of Colorado). The fridge is full; I can last for years!
REPLY: Insignificant in your view, which apparently is only global. We however don’t view individual or regional issues as insignificant as they make up the whole record, and individual examination of these stations is what we do. If you don’t like it, then please don’t dwell here simply to cast snark. – Anthony
Reply: Among other classes, I teach one about weather and climate data. “Watts Up With That?” and “Surfacestations.org” have been absolutely fabulous resources. I’ve pulled many an example of how to – and how not to – make observations from these sites. Thanks Anthony!
Dodgy Geezer — kudos, and mega-dittos!
I would add, although I am not a scientist rather an engineer turned attorney, that beyond getting the data right, some other things must be right before any of this is believable. Or, as we say, passes the laugh test.
As examples, basic physics cannot be violated: no matter (mass) can be created nor destroyed (we are not having nuclear reactions in GW), there must be conservation of mass and energy in calculations, second law of thermodynamics obeyed, and some others. I get particularly irritated when arguments are made that *the energy just disappeared* and such. Basics of chemistry also cannot be violated, such as gas solubilities in liquids, reaction mechanisms and equilibrium considerations and temperature-sensitive reaction rates.
Engineers are sometimes disparaged in these discussions, but fundamentals are not to be violated with impunity. The fundamentals have served not only me, but countless others very well over our long careers. Screw ups occur when someone forgets to check their results against the basics.
We do have our missing-data issues in engineering, and we deal with that in various ways, including data reconciliation algorithms. I wrote more than one of those in my career, and sometimes we incorporate artificial intelligence techniques coupled with appropriate models. But the model that uses that reconciled data had better match the real world, or there is hell to pay.
So, I welcome each day with reading WUWT and a few others.
Roger E. Sowell
Marina del Rey, California
Crosspatch wrote:
“Also, greenhouse warming should raise average temperatures by decreasing nighttime lows.”
I think he meant “increasing nighttime lows.”
Roger Knights:
I did indeed mean “increasing nighttime lows”.
Basically greenhouse warming would make record low temperatures more rare and record high temperatures more frequent. In fact, from looking at the IPCC projections from around a decade ago, it would seem that the current amount of accumulated warming projected by them would make record low temperatures very, very rare and it would be impossible for an annual global average temperature to be as low as they were *before* the projections were released.
If you buy their notion that CO2 is the primary climate driver and that solar variation has little to nearly no impact, what can explain the disappearance of all of that heat without any major volcanic activity over the past 20 years? According to their models, the situation we are in would be impossible. Again, their models say that our current global average annual temperature would be an impossible situation. So either I have suddenly shifted to an alternative universe or their models are wrong. One of those possibilities has a much greater probability of being true than the other.
This image and this image pretty much say all there is to say. The first one is the IPCC predicted trends with range and the second shows CO2 change vs. global temperature since 2002.
Anyone who still “believes in” global warming after looking at those presentations of the observed data is basically living in a fantasy land. The observation could simply not happen if the models are correct.
Oops, meant to say “The first one is the IPCC predicted trends with range compared to the observed global average temperatures over the same time period”
More reality checks on climate data:
Look at an animation of disappearing stations
http://climate.geog.udel.edu/~climate/html_pages/Ghcn2_images/air_loc.mpg
And the article:
Jan 09, 2009
2008 Coldest Year Since 2000 and Clearly Not a Top Ten Warmest Year
By Joseph D’Aleo, CCM, AMS Fellow at http://www.icecap.us
Dr Keen,
Thanks for letting us look in on your operation, and for providing us with some insight into your work. It would seem that at least some students in Colorado are getting some good science training.
If I was aloud to ship across State Lines, I would send you a case of Newcastle Brown ale to add to your carbonated beverages maintenace supplies.
George
Has anyone wondered or worried about the reliability of temperature records between 1860 and 1940?
What is the source of these records?
And, for example, HOW can data from less than 16% of the globe be used to determine a “Global” average temperature?
Is anyone the least bit curious about this?
Eyas
I have been posting about this on a variety of threads for some time. Global temperatures since 1850 are a nonsense, as the number of stations started at only 100 in 1850-many of them unreliable. Numbers remained small and unrepresentative until 50 years ago -then suddenly halved in the eighties when the Soviet Union collapsed and with it funding for its weather stations. Many of the cold rural ones subsequently disappeared, fundamentally affecting average temperatures.
I am collecting reliable national records as an antidote to the pot pourri of global readings -the longer the better-so if you come across a link please post it so I can add it to my collection which I will publish as a resource for others to use.
TonyB
Never attack peoples religion.
You could be burned.
My Pear Trees and my neighbors Peach trees have only had one crop since 2003 because of the frost killing any blooms that tried to make it. My trees say its colder. I guess I’ll have to burn them.
Hillsboro Kansas
ak,
“everyone” DOESN’T know that humans are causing global warming. Everyone with an agenda does.
I live at the top of Coal Creek Canyon. I had to shovel 7 feet of snow in March ’03 and would have appreciated some global warming.