reposted from ICECAP
By Dr. Richard Keen, University of Colorado
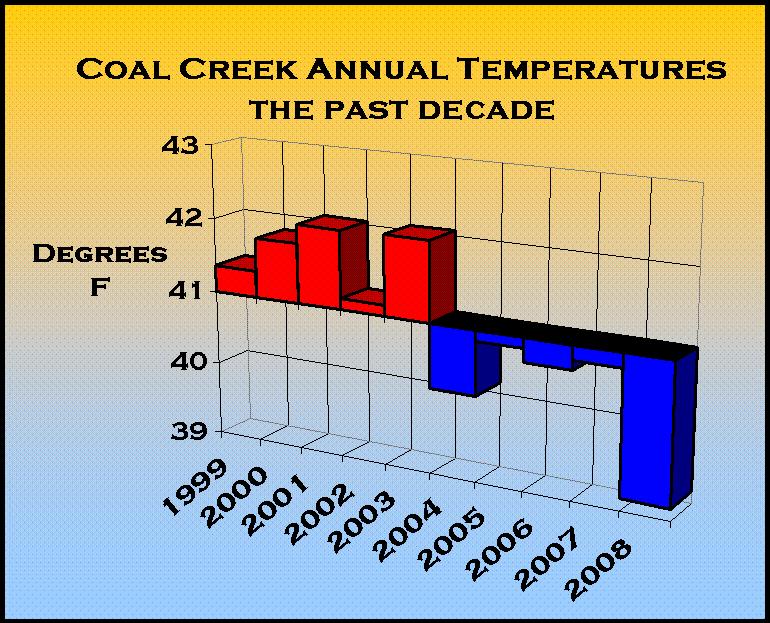
I’m the NOAA co-op observer for Coal Creek Canyon, Colorado, elevation 8950 feet, in the foothills NW of Denver. Here is a graph of average temperatures for the past ten years. 2008 is by far the coldest year in the past decade, with an average of 39F.

See larger image here.
That’s full 3 degrees F colder than 2003. Each of the past five years is colder than any of the previous five years.
This is only one station of the thousands in the NOAA co-op network, but I thought I’d show you the data before it’s adjusted and homogenized by the usual suspects.
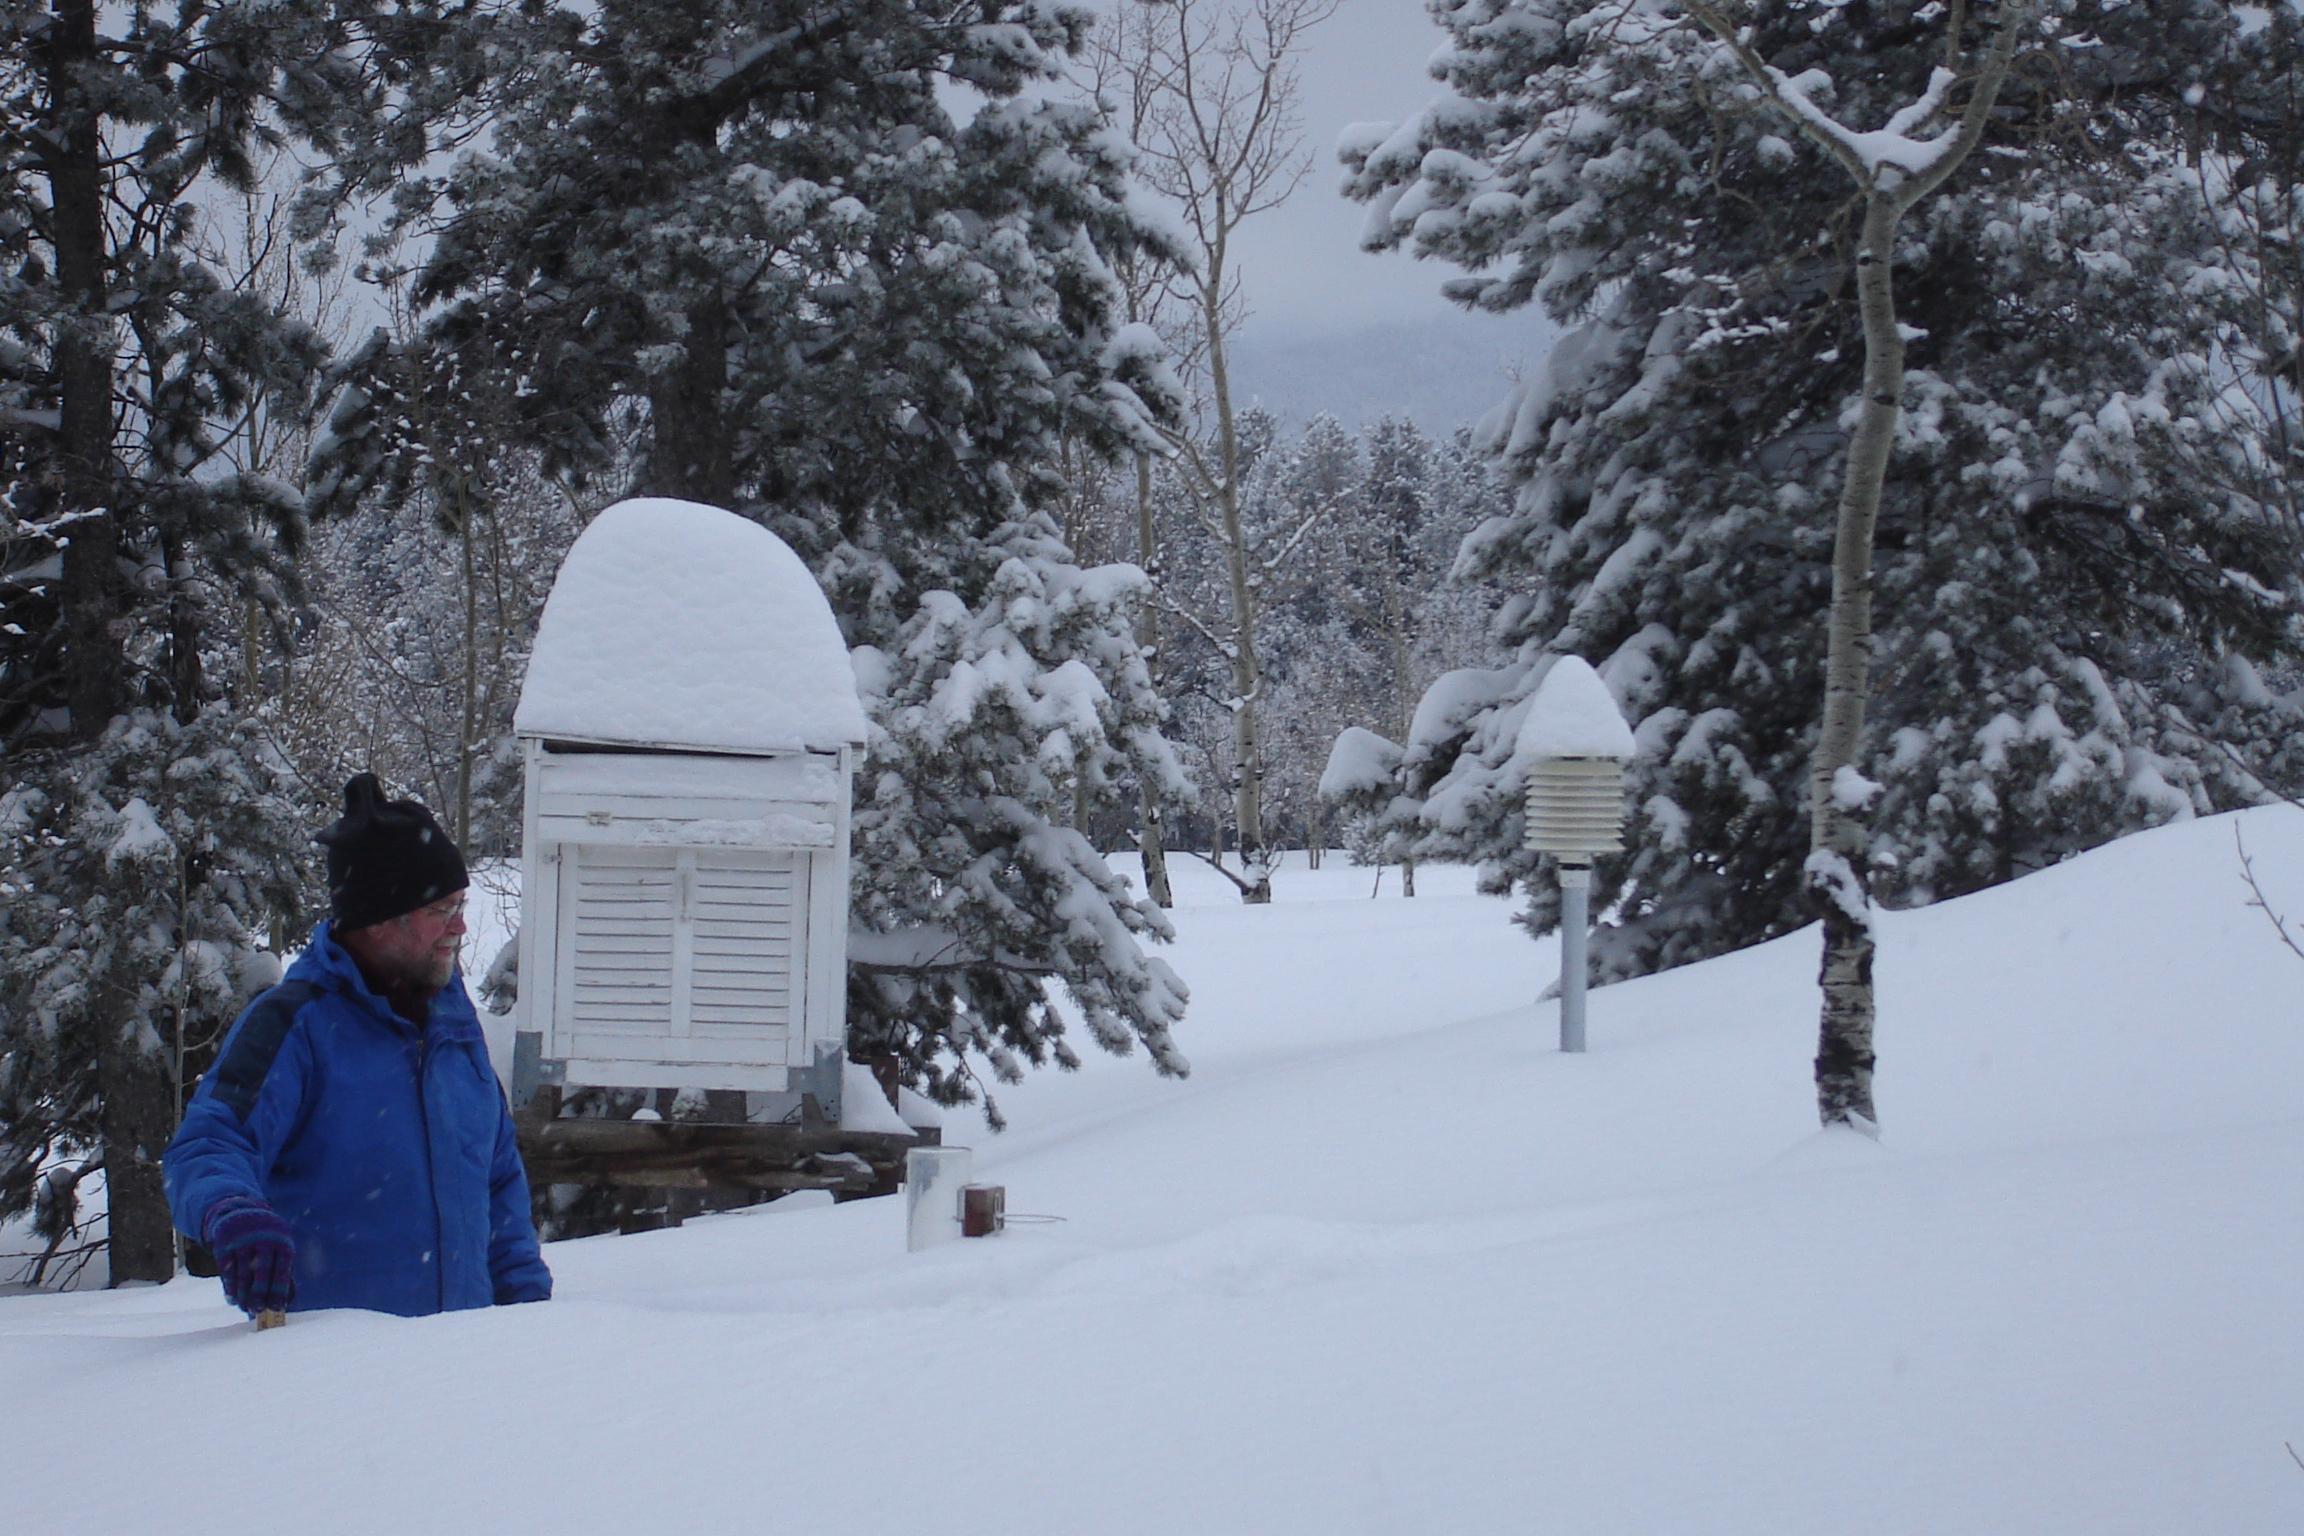
Here’s a photo of the station in January 2007, in the midst of a record round of snow storms in Colorado.

See larger photo here.
crosspatch, is atmospheric CO2 really all that “well mixed”? Judging from the information coming from the JPL’s AIRS project, it sure doesn’t look that way to me.
http://airs.jpl.nasa.gov/story_archive/Measuring_CO2_from_Space/
http://www-b.jpl.nasa.gov/news/news.cfm?release=2008-189
It looks to me as though the distribution of CO2 in the atmosphere is just as variable as the distribution of heat or water vapor.
Nelthon (09:30:47) :
“The graph is significant because CO2 is “well mixed” in the atmosphere and “Global Warming” is supposed to be, well, global.
That’s a horribly simplistic misunderstanding of how climate works.”
In the same way as my belief that 2 + 2 does not equal 5 indicates a horribly simplistic misunderstanding of how mathematics works.
This whole climate debate was started by people who foisted a horribly simplistic theory of climate change onto fellow citizens, trusting that our horribly simplistic minds would not recognize that colder + colder does not equal warmer.
You want simplistic? Go watch “An Inconvenient Truth” again.
dh
Please help us set this guy straight. Vote every 24 hours!
ak
“…i came here looking for good counterpoints to my own belief – that humans are affecting our environment, and one consequence of that will be warming of the earth.”
————————————————————–
Explain how humans activities are warming the Earth.
John W: “According to the New Zealand Meteorological Service, the highest forecast high for today is 29C in Christchurch.”
According to my morning paper, the official NZ high for yesterday (8 Jan) was around 36 deg C, in Christchurch. So while short of 40, it was still historically on the high side.
From memory, the highest officially recorded New Zealand temperature was around 42 deg C, so 40+ deg sounds like an exaggeration, but could be true in a local hot spot.
So what’s it to be today? Beach, BBQ, or just a beer in the shade? Those ol’ summertime decisions.
Here’s the most important thing to my mind. If you follow the IPCC projections made in 2001, using the “middle” projection which they deemed most likely, we should now be seeing global average temperatures (smoothed) 0.28 degrees higher than they were in 2001 and trending upwards.
What we see today are temperatures (smoothed) 0.10 degrees cooler and trending downward. In fact, they have been in a steady down trend since the IPCC issued the projection. 2008 wasn’t “weather”, it wasn’t an odd blip, it wasn’t a spike. It is part of a regular trend downward that increased its downward slope in 2006.
It doesn’t matter if one believes Hansen’s hypothesis is plausible or not. We now have enough information to say that it is just plain incorrect and isn’t happening.
81F in San Antonio right now (3pm), but…going down to 34F Sun. night.
Not unusual tho. A pleasant respite from winter.
Summer temperatures in New Zealand today range from 38F up to 81F. Mostly in the 50s and 60s.
http://www.wunderground.com/cgi-bin/findweather/getForecast?query=new%20zealand&wuSelect=WEATHER
Anthony: “Perhaps you’ve missed what we do. See http://www.surfacestations.org This blog has had a long history of looking at individual stations, and we are collecting quality control data on the entire USHCN network, something that has never, ever, been done before.”
On perusing the stations org site I notice that a quality rating (1-5) is given for the various stations, distinguishing between well maintained and sited stations and those not so well maintained and sited.
It would be interesting to compare the temperature records of the different stations according to their quality rating. Has any analysis been done in this regard?
Estimation of the Radiative Forcing
for CO2 Doubling
by Peter Dietze
http://www.john-daly.com/forcing/forcing.htm
“…observations did not support the exaggerated warming, the IPCC assumed, the discrepancy was an effect of aerosol cooling while other effects (e.g. amplification of solar forcing) were considered to be insignificant. Their exaggerated aerosol cooling and the gain in parameter variability was ideal to maintain a far too high CO2 climate sensitivity, thus compensating for missing solar forcing amplification and any other model discrepancies, just as required.”
“IPCC authors so far refused to disclose details about the modelling assumptions and computation of their core parameter, demanding us to believe in their results – which is an unprecedented offence against rules in public funded science, and the TAR again follows this line.”
“Even if most of the error sources in ground temperature series (not to forget ocean measurements) would be eliminated, the trend should still not be (mis)used as a “proof” for the correctness of the CO2 sensitivity parameter the IPCC model results were based on. The estimation of radiative forcing done here and previously in the solar fraction analysis show that the CO2 climate sensitivity has indeed to be reduced considerably, just resulting in a rather harmless (if not beneficial) warming till 2100 – when fossil reserves become rare and mankind may turn to bulk power production from thorium breeders and fusion reactors anyway.”
————————————————————-
Bottom line: The ratio of natural CO2 to man-made CO2 in the atmosphere is 5.76 to 1
Mr Watts, you might want to change your recommendation for weblog awards Huffington Post voting based on this:
More here.
From ak:
” “So we’ve got global warming, Coal Creak is on the globe so why is it colder? There could be plenty of reasons, but you don’t say.” -davidc
i’m not disputing the data, but your comment doesn’t make much sense, for instance people say the US economy is in bad shape right now, but i just got a job, so i say it’s good! my getting a job doesn’t make the economy any better than it already is, nor does the fact that thousands of people are losing their jobs mean that my paycheck doesn’t benefit me.”
Well, we’re talking about GLOBAL warming as the problem and (we’re told) only GLOBAL action to prevent to prevent GLOBAL contamination of the atmosphere by CO2 can be effective. The IPCC projections tell us that this is happening now, is continuing and will be catastrophic. The fact that it has been cooling in many parts of the world simply means that those projections are wrong if we take them at their word that this is GLOBAL. Now, if they want to revise their projections and say it will be warmer in some places but cooler in others, OK but unless they have something to say about where it will be cooler or hotter I think the reaction would be …um, we knew that already. But even if they could do it, the IPCC wouldn’t want to specify local changes in temperature because that would make obvious what they want to conceal: that even if we could engineer reduced global temperatures (I don’t think we can) many people (at least the populations of Northern Europe, Central Europe, most of North America) would be much worse off.
Two Australians killed by advancing glacier.
http://www.news.com.au/story/0,27574,24890577-38196,00.html
Had they been killed by a retreating glacier, doubtless Global Warming would have been blamed.
A vertical or overhanging terminus, which is what killed these 2 unfortunate young men, is characteristic of a rapidly advancing glacier.
“The IPCC projections tell us that this is happening now, is continuing and will be catastrophic.”
Uhm, no. None of the IPCC projections have come true and not a single thing they have projected have come to pass. Not one thing.
Also, CO2 is not a contaminant. CO2 levels were at all time record lows as far as I can tell before they started climbing again during the industrial era. The atmosphere is actually *recovering* to something closer to what CO2 levels have been through geological history. We have a ways to go yet, though, before levels are back up to something more “normal”. Maybe another 1000 ppm will be better for the plants and animals that eat them.
Dr Keen,
Where abouts is your barbecue, under all that “partly cloudy” ?
It looks like you have a nice job though. Should we send someone to dig you out; or can you hold your own for a while?
George
“” Tom Woods (22:40:21) :
From the Anchorage sea-ice desk
…JANUARY YEAR GROUP ANALYSIS AND OUTLOOK… “”
Tom, look under the Tab key on the left of your keyboard; push that one !
George
“” the_Butcher (23:37:32) :
New Zealand is burning at the moment with temperatures of +40C + “”
New Zealand has the same problem that Australia has; they are both on the crusty side of the pizza; and just when we are having good skiing weather in Colorado; the Kiwis and Aussies decide it is time to go to the beach.
So don’t worry about it; in a few months, when we set fire to California again, you Mates down there can go skiing; well the Kiwis can; the Aussies don’t have any mountains; so they have to go skiing with the the man in the gray suit in Sydney Harbor.
“So what’s it to be today? Beach, BBQ, or just a beer in the shade? Those ol’ summertime decisions.”
The beach is nice, just watch out for those rising sea levels. BBQ, uh, no making CO2, not nice to habitability… Beer? Excellent, enjoy it now before Global Warming makes it available only to the elite. 🙂
“” ak (05:31:09) :
@Anthony, i came here looking for good counterpoints to my own belief – that humans are affecting our environment, and one consequence of that will be warming of the earth. i believe that good arguments can be made. if this blog’s aim is simply to deal with individual stations, then that’s fine. it just seems that you are trying to make larger inferences to the globe from individual data points – the NCDC post was temperatures for 2% of the earth’s surface over 10 years, now it’s a single point over 5.
REPLY: Perhaps you’ve missed what we do. See http://www.surfacestations.org This blog has had a long history of looking at individual stations, and we are collecting quality control data on the entire USHCN network, something that has never, ever, been done before. Yes we’ve had the old “but the USA is only 2% of the landmass” argument tossed at us thousands of times…so what?
<>
If I stopped to listen to critics who tossed out the same objections you have, we’d not be anywhere in the project. But we are now more than halfway done in surveying the 1221 USHCN network. “”
So ak; are you trying to make a point that this “data” isn’t relevent, because it violates the Nyquist condition of sampled data systems ? If that is your point, then perhaps you can explain the basis on which you believe that Hansen’s GISStemp complies with the Nyquist theorem; given that it is widely accepted that GISStemp pretty much relies on the very sparse sampling network confined to the USA; did somebody say that is only 2% of the earth’s surface ?
Perhaps you could also explain how the AlGorythm used in “An Inconvenient Truth.” plotting Vostock Ice core data on pages 66/67 is a representative sample of the total global climate. Is it logical to base one’s beliefs on data from the coldest place on the planet?
ak (05:31:09) :
@Anthony, i came here looking for good counterpoints to my own belief – that humans are affecting our environment, and one consequence of that will be warming of the earth. i believe that good arguments can be made. if this blog’s aim is simply to deal with individual stations,…
AK, there are lots of posting here over several years. Some are global in perspective, some are detail oriented. Both matter. Each station and its quality matters. The whole picture matters. All of it’s here, just dig back through the history a bit.
“” Gary (05:37:29) :
That station looks to be out of compliance with standard siting criteria. The trees are too close. Shading and elevated humidity probably skew the temperatures a bit. That might be tolerable for a comparison of temps at this one location over the years, but not so good for comparison to other stations. I might trust it to estimate local skiing conditions, but not much else. FWIW, this station isn’t in the USHCN and has only been active since 1993. “”
Gary,
I’m curious; are you suggesting that Planet Earth excludes ALL locations, such as Coal Creek Canyon, when it computes just how much solar radiation to let in and how much total EM radiation it should allow to escape in order to set the gloabl climate.
I am sure that the planet correctly allows for the effects of Urban Heat islands, and it also properly accounts for all the official USHCN barbecues that Anthony has been chronicling here on this forum; so I don’t see why it would discriminate against Dr Keen’s good clean operation.
Can you give us the global co-ordinates for a pristine location that is properly situated at the current value of the GISStemp Anomaly, so we can google earth it, to see what the best places to live look like.
Well we know it isn’t Vostok Station; and it certainly isn’t an Iraqi desert; but I know for sure that Planet Earth includes all of those places in its AlGorythm for setting the temperature.
Mike Bryant (15:04:52) :
Beer? Excellent, enjoy it now…
Hmmm… Beer contains CO2. I consume beer therefor I consume CO2. I pee out non-carbonated therefor I must be a carbon sink… 😎
I hereby offer to sequester one beer worth of CO2 inside my person for each dollar sent, via the expedient of drinking beer. Your carbon offsets will be sent when I sober up later… Beer may be sent directly in leu of $.
😉
Sunspotter (09:08:38) : A conundrum has been puzzling me lately. All these “surface stations” are elevated, and so, are in fact measuring atmospheric temp. If we really want to know what’s going on with the Earth, shouldn’t we also be measuring the temp. in the surface? At, say, a depth of 2-1/2 to 3cm? Just a thought.
The simple answer is that “surface temperature” is defined as the temperature at (as I remember) 60 inches above ground level.
Some synoptic stations report soil temperatures (or at least used to) which I always assumed are used for forecasting agricultural conditions.
Most of New Zealand has never seen 40C temperatures. The exception is a small area of the South Island susceptible to Chinook-type winds.
The winds are caused by differences in adabatic lapse rates, which greenhouse gases have exactly zero effect on.
“” Philip_B (14:26:24) :
Two Australians killed by advancing glacier.
http://www.news.com.au/story/0,27574,24890577-38196,00.html
Had they been killed by a retreating glacier, doubtless Global Warming would have been blamed.
A vertical or overhanging terminus, which is what killed these 2 unfortunate young men, is characteristic of a rapidly advancing glacier. “”
Christmas of 2006, I took my family to NZ, mostly to tour the South Island very quickly, and we visited both the Fox, and the Franz Joseph Glaciers; which currently are advancing, but over the longer haul have retreated quite a bit. Well they come down to sea level at somewhere from -45 to -50 latitude; so what do you expect.
There were Danger Keep out signs at least 1/4 mile below the terminus which was quite overhung on both glaciers. Bits fall off (this was summertime), and sizable blocks of ice come bounding down the terminal morain which is quite sloped. So we crossed the terminus below the lowest ice blocks, and ascended on the other side canyon walls, high enough off the morain to not get hit by anything coming off the end.
This got us safely all the way to the face of the glacier, except off to the side, and with an overhanging rock cliff to stop higher altitude stuff that might come down the side.
We were thus able to take people pictures within 200 feet of the terminal face.
While we were taking such pictures; there were at least a half dozen Darwin Award contestants who were at least 100 feet inside caves that were at the bottom of the terminal face, and probably overhung by another 150 feet of tilted ice face outside the caves. Water drops falling from the very top of the glacier face landed at least 25 feet down stream of where these idiots were cavorting.
If that stuff came down on them, it would be another 50 years or more before anybody ever got another look at what was left of them.
There were guided tours that climbed up on top of the glacier for those more athletic than I am (I coulda done it; wife wouldn’t), but they climbed along rock canyon wall trails that were well clear of the glacier, till they were far above the terminal cliff.
Well the wealthy Europeans, who were down there to avoid the European winter global warming, could get a helicopter flight right to the upper reaches of the glaciers, where they might fall down a crevasse if they were lucky.
Having tried to win a Darwin award myself on at least three occasions, I can say that I am cured of those antics; and only go where the laws of physics prohibit such mayhem.