From ICECAP
By Joseph D’Aleo CCM, AMS Fellow
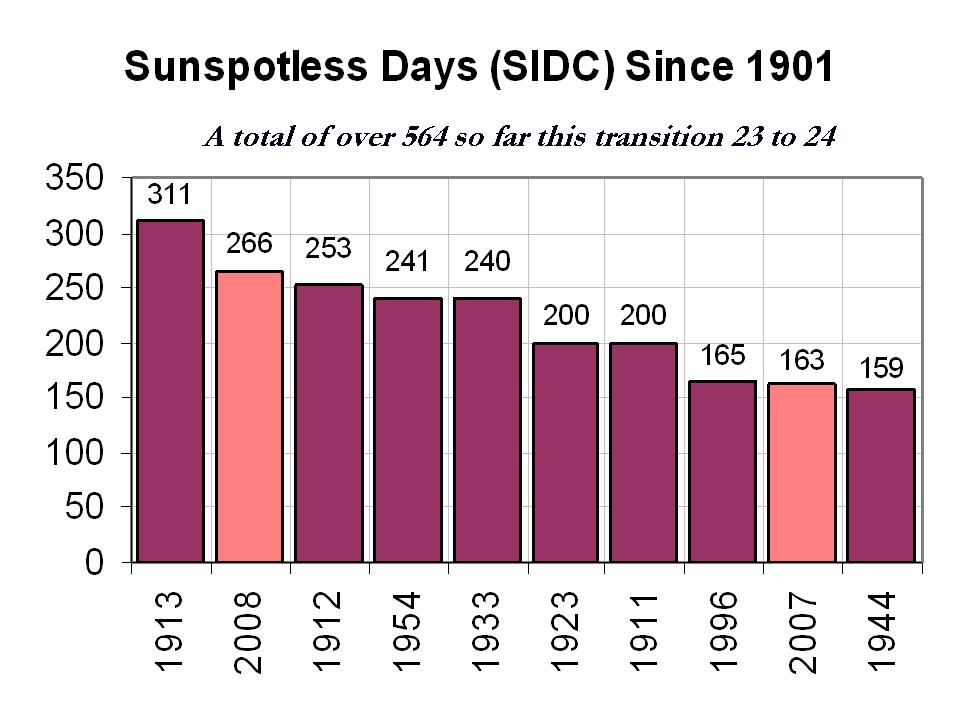
2008 will be coming to a close with yet another spotless days according to the latest solar image.

This will bring the total number of sunspotless days this month to 28 and for the year to 266, clearly enough to make 2008, the second least active solar year since 1900.

See larger image here.
The total number of spotless days this spolar minimum is now at around 510 days since the last maximum. The earliest the minimum of the sunspot cycles can be is July 2008, which would make the cycle length 12 years 3 months, longest since cycle 9 in 1848. If the sun stays quiet for a few more months we will rival the early 1800s, the Dalton Minimum which fits with the 213 year cycle which begin with the solar minimum in the late 1790s.

See larger image here.
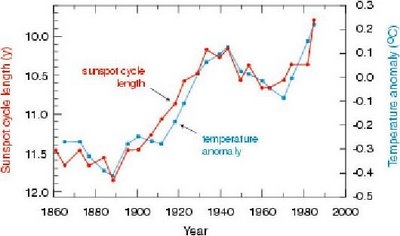
Long cycles are cold and short ones like the ones in the 1980s and 1990s are warm as this analysis by Friis-Christensen in 1991 showed clearly.

See larger image here.
In reply to the arguments made that the temperatures after 1990 no longer agreed with solar length, I point out that it was around 1990 when a major global station dropout (many rural) began which led to an exaggeration of the warming in the global temperature data bases. Also the length from max to max of 21 to 22 was 9.7 years and cycle 22 length min to min 9.8 years, both very short suggesting warm temperatures in the 1990s. The interval of cycle 22 max to cycle 23 max centered in the mid 1990s began to increase at 10.7 years and the min to min length of cycle 23 is now at least 12.3 years.
With the Wigley suggested lag of sun to temperatures of 5 years and Landscheidt suggested 8 years, a leveling of should have been favored around 2000-2003 and cooling should be showing up now. Looking ahead, put that together with the flip of the PDO in the Pacific to cold and you have alarming signals that this cooling of the last 7 years will continue and accelerate.
Phil
The data points on the solar cycle length extending the FC plot forward are clear now with length from max to max of 21 to 22 (mid 1980s) 9.7 years and cycle 22 length min to min 9.8 years (centered arounf 1990), both very short supporting warm 1990s and much in line with the 1991 FC plot. The interval of cycle 22 max to cycle 23 max centered in the mid 1990s is also known at 10.7 years but the min to min length of cycle 23 is still TBD but at least 12.3 years.
What is not clear is the surface temperatures which because of station dropout around 1990 http://icecap.us/images/uploads/Stationdropout.jpg and other factors http://icecap.us/images/uploads/DataIntegrity.doc is likely exaggerrated. Instead of thinking temperatures proving the solar connection incorrect, maybe we should use the long term solar correlation to prove the Hadley/NOAA/NASA temperatures are faulty. I chose the FC chart that ended at 1990 before most of the temperature issues arose.
In other news, globaloney hits Malibu!
Feel the envy:
Magnus and others
Thank you for your links to the two Landscheidt’s documents. It answers my earlier question (15:32:55) regarding the 213 year period and solar inertial motion. You are likely aware of the Richard Mackey presentation of Rhodes Fairbridge’s work on SIM http://www.griffith.edu.au/conference/ics2007/pdf/ICS176.pdf
I’m curious as to your take on the relationship between the two.
I am still also interested in a brief explanation of how the end of the minimum will be established. Can you or fellow expert provide such?
Mark (15:14:04) :
You think that’s bad, we finally have it from the horse’s mouth – the real purpose behind the AGW myth, redistribution of wealth: (letter from James Hansen to Barack Obama).
http://newsbusters.org/blogs/noel-sheppard/2009/01/01/nasas-hansen-obama-use-global-warming-redistribute-wealth
QED.
Robert Bateman (16:04:40) :
What to name the Grand Minima if it occurs?
Badalyan had a 50 for SC 24 in 2000.
Svalgard has a 70 for SC24 in 2005.
And Cliverd has a 42 for SC24 in 2006.
Depends on where we land.
There’s a big difference in proposing a next low min based on precursor methods or whatever and predicting a full solar grand minimum…how many have done that?
Tallbloke (16:44:49) :
Anyway, I’ve read your stuff on the Landscheidt repository site, great progress, and all the best for 2009.
Thanks…might be an interesting year
Ron de Haan (16:40:07)
‘The new “Maunder Minimum” already is named after Dr. Theodore Landscheidt and it’s called the Landscheidt Minimum which will have it’s Maximum by 2030.’
Darn, I was hoping for the name Gore’s Minimun.
If we do go into a mini ice age (which I hope we don’t), It should be named Gore’s little ice age.
Folks, attendance to family matters [I was a Santa Claus impostor] has left me off the keyboard for while. It has been fun to see the unbridled speculations that apparently can thrive when left alone. I do have a few general comments:
1) use of polar fields [deJager]: he said polar ‘activity’ not polar fields, and I have no idea what he is taking about.
2) F-C&L was a poor paper. It is usually considered inadmissible [or just plain wrong] to mix filtered and unfiltered data. If the effect was present for the last few of the unfiltered data points, it should also have been present in the unfiltered data as a whole, so the need to ‘jack up’ the correlation by filtering over several cycles is a severe weakness. In addition, the ‘length’ of a solar cyle is a somewhat artificial concept [that the Sun doesn’t really know about. A cycle typically lasts ~15 years overlapping with previous and next cycles.
3) Re Hung’s paper: I don’t known what a ‘proper’ reading of a paper is. My main objection to his claim is that if the planetary tides [or positions] can trigger major flares, they should be even more effective for triggering smaller flares [of which we have thousands]. People looking at flare statistics [myself included] have not observed any clear periodicities in the occurrence. Hung also notes that the syzygies and the solar cycles are getting out of sync [with the sun leading!]. His conclusion is that the solar cycle is not caused by tidal forces, but only weakly modulated. Yet some people that claim Hung as supporting evidence ascribe the cycle itself to tides of ‘angular momentum’ and such. The various ‘planetary’ theories are not mutually coherent and are [as Hung notes] energy challenged.
It is every scientists dream to overthrow the standard paradigm, so papers [well, it was only a ‘report’] like Hung’s are often studied to see if there might be something there. Scientists quickly learn to separate the wheat from the chaff, and I have seen precious little wheat, and chaff is not something anybody wants to spend time refuting, because it is not necessary: chaff advertises itself as such.
nobwainer (Geoff Sharp) (17:50:25) :
There’s a big difference in proposing a next low min based on precursor methods or whatever and predicting a full solar grand minimum…how many have done that?
My seven-year old grandson [Peter] for one. I was looking at http://sidc.oma.be/html/wolfaml.html and he looked over shoulder and commented: “it sure looks like the next one will be small as the three drawings look pretty much alike”.
Interesting SC24 presentation from Hathaway on solarcycle24.com for those who havent seen it.
http://sprg.ssl.berkeley.edu/RHESSI/napa2008/
Here’s a controversial graph showing the past grand minima going back 11,000 yrs from Usoskin. It only shows major grand minima (misses the Dalton etc) but it certainly shows some very big gaps in between. All the blue troughs line up with Neptune/Uranus conjunctions but do start to drift out as the records get older….perhaps the conjunctions could be used to re calibrate the carbon dating process?
Here’s a controversial graph showing the past grand minima going back 11,000 yrs from Usoskin. It only shows major grand minima (misses the Dalton etc) but it certainly shows some very big gaps in between.
All the blue troughs line up with Neptune/Uranus conjunctions but do start to drift out as the records get older….perhaps the conjunctions could be used to re calibrate the carbon dating process?
http://users.beagle.com.au/geoffsharp/previousgrandminima.png
That grandson of yours is very observant, Leif. When you look at all those cycles squished down into tiny shapes, it makes it hard to pick out the patterns amidst all the data clobbering.
And when I split and rejoin that graph the result is mind blowing.
http://users.beagle.com.au/geoffsharp/11000c14.jpg
Check the background curve that is now easy to see…far from something a random number generator could do, I bet its the angular momentum curve that controls when we have Grand Minima as well as the strength of each solar cycle.
nobwainer (Geoff Sharp) (21:04:28) :
Check the background curve that is now easy to see…far from something a random number generator could do,
And even further from a periodic orbit-driven generator. But, actually, the spacing of minima has a random character with both large and small gaps. If they were more equally spaced they wouldn’t be random. And the Sun has ‘persistence’: low groups often go together and high groups often go together, but the transition between them is pretty unpredictable. The Earth’s dynamo has similar randomness.
Joe D’Aleo (17:00:30) :
Phil
The data points on the solar cycle length extending the FC plot forward are clear now with length from max to max of 21 to 22 (mid 1980s) 9.7 years and cycle 22 length min to min 9.8 years (centered arounf 1990), both very short supporting warm 1990s and much in line with the 1991 FC plot.
Oh really did you apply the same filtering?
Also if you’re going to post figures from papers it’s considered good form to include the caption.
So you used dodgy data from a paper which had been repudiated by its authors who said “Northern Hemisphere Land surface temperature variations did no longer (since 1985) follow the solar activity variation expressed by the solar cycle length” as support for your title “Portends Cooling”.
I chose the FC chart that ended at 1990 before most of the temperature issues arose.
And yet the MSU data agree with the surface data as far as the trend since that time is concerned. Basically you cherry-picked a graph that fitted your prejudice and used it regardless of the science.
Leif Svalgaard (22:38:53) :
And even further from a periodic orbit-driven generator.
That would depend on the period i would think…how long does it take for the solar system take to come back to exactly the same positions? if someone has worked that out, “that would be the orbit period”….and the C14 graph and matching 10Be graph are probably in tune with J+S+N+U most aligned days.
Sounds like a great job for our friend Jean-Pierre Desmoulins.
Leif Svalgaard (22:38:53) :
But I suspect that the “orbital period” will be around 100,000 yrs just like the Milankovitch cycle that controls our own orbit shape around the Sun…..and you know that cycle is caused by Jupiter, Saturn, Neptune & Uranus.
Usoskin work is only an estimate and should be considerd with great deal of reservation. Although cosmogenic isotope intensity depends inversely on solar activity, there are number of other variables about which there is no certainty. Geomagnetic shielding factors, field intensity and GM equator position are only estimates, the last one being particularly unreliable. Main factor of uncertainty is the intensity of galactic and intergalactic cosmic rays over the period considered, it can not be assumed to be constant, having in mind events such as supernova explosions etc.
It is odd that during the period of 10000y, three least active solar periods took place at 1300-1700. Record of cosmogenic isotope deposited over the period, could be only a rough indicator, not a reliable guide.
“Hung also notes that the syzygies and the solar cycles are getting out of sync [with the sun leading!]. His conclusion is that the solar cycle is not caused by tidal forces, but only weakly modulated.”
I agree with Hung that the solar cycle is not caused by tidal forces.
A beat resonance effect between V,E,J syzygies and another effect (yet to be determined) which gives the sun a ~10 year rhythm seems to be what is modulating the solar cycle intensity.
Given that the tidal forces are small, and given Hungs successful prediction of large solar flares (electrical events par excellence) occuring at locations on the sun where a planet is overhead, and bearing in mind how much stronger electromagnetism is compared with gravity, it seems likely that this would be a more fruitful line of enquiry for those who don’t avert their eyes from demonstrably good correlations for lack of a sufficient theoretical mechanism acceptable to the current paradigm.
It’s great to have stalwarts like Leif to act as reliable touchstones and keepers of solid data. It’s also great to have pioneering spirits like Geoff sharp to head out into unexplored waters on a voyage of discovery. Accusations of haunted demonology and astrology aren’t necessary or warranted IMO. This is a blog for all, not the preserve of published peer reviewed science.
Thanks Tallbloke…but isnt it a great time to be alive and aware. This is all new ground for me…but the further i dig the better it looks.
“You do realize that Tallbloke’s graph is not an update of the one under discussion, it plots a different variable? In fact it disproves F-C’s original thesis since it is detrended.”
HJere’s the non-detrended graph:
http://www.woodfortrees.org/plot/hadsst2gl/from:1950/mean:43/offset:0.6/plot/sidc-ssn/from:1950/scale:0.0015/mean:12
The solar signal in the data is still obvious (as are the effects of the major solar activity events of 1998) , and the key question becomes;
How much of the rising temperature trend is due to a succession of comparatively strong short solar cycles leading to additional oceanic heat storage via a loss of cloud cover, and how much is due to the 30-50% inflation (according, allegedly, to some peer reviewed papers) of the temperature data due to the Hansen/Jones selectivity of station reports, non-adjustment for UHI etc.
In either case, my graph doesn’t disprove Christensen at all. One thing we do know from established science is that given the dropping humidity, is that the temperature rise isn’t due to greenhouse gases.
For a look at how the events of 1998 caused a ‘step change’ in temperature of around 0.2C, have a look at the linear trends in the satellite data:
http://www.woodfortrees.org/plot/uah/to:1997.2/trend:1980/plot/uah/plot/uah/from:1997/to:2008.5/trend/plot/uah/from:2002/trend
vukcevic (02:21:36) :
Usoskin work is only an estimate and should be considerd with great deal of reservation.
My thoughts too, but suspect there is an underlying truth to it…the patterns there, but perhaps needs tightening. A lot of people (incl Leif i think) think that if its all affected by planets it should be the same every 179 yrs…but they fail to see that the positions are similar but different, and its not a random event as it follows a curve relative to the strengths of the alignments .1280 till now is an extraordinary time, but it was very different during the MWP and huge slabs of time around 2000BC….the alignment records certainly concur with that.
I tend to ignore “magnetic ” models and their influence on climate. We each have our biases.
Today, January 2, I saw a formation of geese over Athens, Greece, going south. This is very unusual at this time of the year. October, November, yes. They were too high for me to ask whether they were leaving the north of Greece or coming from further up from the Balkans :). In any case they foretell a tough winter from now on. Considering how sensitive migrating birds are to magnetism it is not out of the question that they are reading the magnetic fields and deciding from that, that it will get bitterly cold. ( that is if we exclude ESP and other metaphysics). That they have not stopped at our northern lakes means they foresee a freezing.
nobwainer (Geoff Sharp) (03:13:25) :
the patterns there, but perhaps needs tightening. A lot of people (incl Leif i think) think that if its all affected by planets it should be the same every 179 yrs…
I believe there is a strong magnetosferic factor (feedback hypothesis) and its relationship to the strength of the heliosphere, which beside level of the solar activity depends on the intensity of the galactic and intergalactic cosmic rays pressure, which we cannot assume to be constant. I believe that 1300-1700 type periods are more frequent than Usoskin’s graphs suggest.