From ICECAP
By Joseph D’Aleo CCM, AMS Fellow
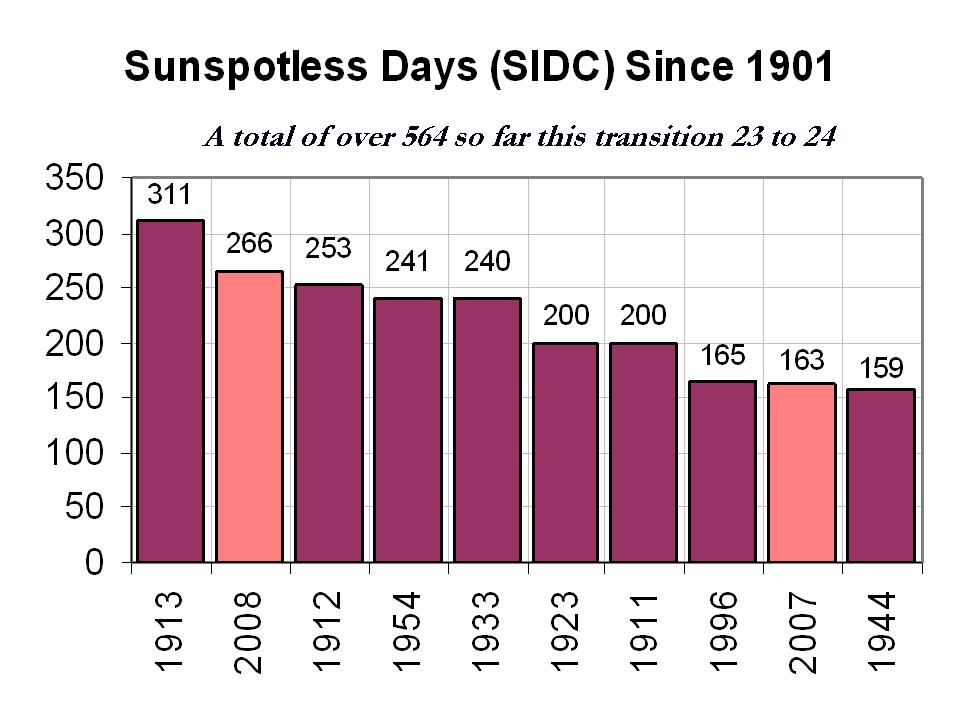
2008 will be coming to a close with yet another spotless days according to the latest solar image.

This will bring the total number of sunspotless days this month to 28 and for the year to 266, clearly enough to make 2008, the second least active solar year since 1900.

See larger image here.
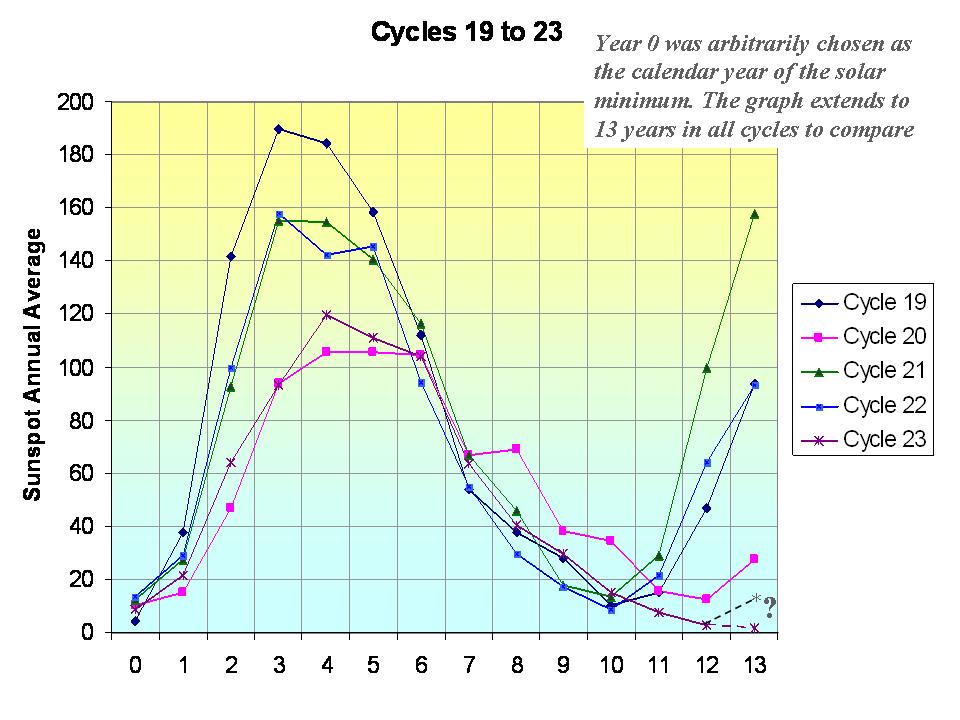
The total number of spotless days this spolar minimum is now at around 510 days since the last maximum. The earliest the minimum of the sunspot cycles can be is July 2008, which would make the cycle length 12 years 3 months, longest since cycle 9 in 1848. If the sun stays quiet for a few more months we will rival the early 1800s, the Dalton Minimum which fits with the 213 year cycle which begin with the solar minimum in the late 1790s.

See larger image here.
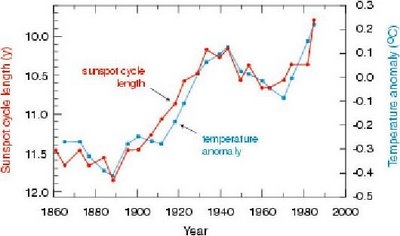
Long cycles are cold and short ones like the ones in the 1980s and 1990s are warm as this analysis by Friis-Christensen in 1991 showed clearly.

See larger image here.
In reply to the arguments made that the temperatures after 1990 no longer agreed with solar length, I point out that it was around 1990 when a major global station dropout (many rural) began which led to an exaggeration of the warming in the global temperature data bases. Also the length from max to max of 21 to 22 was 9.7 years and cycle 22 length min to min 9.8 years, both very short suggesting warm temperatures in the 1990s. The interval of cycle 22 max to cycle 23 max centered in the mid 1990s began to increase at 10.7 years and the min to min length of cycle 23 is now at least 12.3 years.
With the Wigley suggested lag of sun to temperatures of 5 years and Landscheidt suggested 8 years, a leveling of should have been favored around 2000-2003 and cooling should be showing up now. Looking ahead, put that together with the flip of the PDO in the Pacific to cold and you have alarming signals that this cooling of the last 7 years will continue and accelerate.
jorgekafkazar,
here is an interesting way for the sun to transfer energy to earth:
http://science.nasa.gov/headlines/y2008/30oct_ftes.htm
haven’t seen any articles on how much difference this might make!! With the sun at a low phase, they may be seeing a rather low level of effect!!
The older I get the more the Plasma Universe guys seem to have a better handle on “things”. The Plasma guys say they can explain the universe without the modern day Phlogiston called dark matter and energy!!
http://en.wikipedia.org/wiki/Phlogiston_theory
http://www.holoscience.com/synopsis.php
http://plasmascience.net/tpu/TheUniverse.html
http://plasma.lanl.gov/
http://www.thunderbolts.info/home.htm
In the Tertiary, after 25 million years of global cooling, there was a slight warming trend, in the mid-Miocene, from 17.5 to 15 mya. Rainfall increased, too, called the Miocene pluvials. Forests were everywhere in North America, coast-to-coast, the Caribbean to the Arctic.
The warm bump is associated with the incredible outpouring of molten rock known as the Columbia River Flood Basalts. There is some debate as to what caused them, meteor impact, thinning continental crust, mantle plume, or all three. Whatever it was, it was big. The Earth cracked from Washington to Nevada, and a lava lake formed in eastern Oregon. It overflowed within hours and liquid rock flooded into the Columbia River Basin, filled it up, and turned it into the Columbia River Plateau.
The lava, so hot, so liquefied, and seemingly unending, flowed all the way to the Pacific Ocean, 600 kilometers to the west. It pushed the ancestral Columbia River 200 km north to the Okanogan. Over 164,000 square km were flooded by molten rock, in places over 2 km deep.
The original lava lake became a recumbent volcano, so-called because when one blows, it explodes with such fury that it destroys its own mountain. The terrain is blasted flat and bathed in floods of hot lava that spread over thousands of square miles. Over the next few million years the Columbia hot spot erupted again and again, spewing out dozens of monumental lava floods. In volume, the Columbia River Basalts contain over 175,000 cubic km of rock.
The single cause theory is suspect because at nearly the same time the Steens Mountain Basalts also flooded a vast region, apparently bursting from a different hot spot 400 km south. Two meteor impacts? Multiple hot spots? Plate thinning over there, too? The Steens hot spot vent moved east as the NA continental plate drifted west. Subsequent eruptions then may have formed the Snake River Plain Basalts. The problem with this theory is that the Snake River basalts are evidently somewhat older. The geology is confusing. At any rate, the Steens hot spot, or one of them, is under the Yellowstone recumbent volcano now, and due for another big blow. When it does, the lava will run for hundreds of miles, and the atmosphere will receive a healthy dose of carbon dioxide.
Miocene flood basalts warmed the climate nicely for two million years or so, a respite from the inexorable Big Chill. But then in the Oligocene global temperatures started plunging again. In the Pliocene, about 4 mya, global temps dropped past the Point of No Return. Our planet has not been that warm, or rainy, or forested, or productive, or biologically rich and diverse, ever since.
Leif has been very clear that the difference in average energy coming from the sun within the sunspot cycles is too small to directly affect the climate.
Nevertheless, the little pendulum site he pointed us to http://www.maths.surrey.ac.uk/explore/michaelspages/Coupled.htm gave me another image.
Imagine how many coupled “pendulums” the climate is” PDO etc ocean currents, clouds, storm systems, etc that I do not know. One of these pendulums is the change in local insolation during the day/night and the year. Day/night, though enormous, seem to me too fast to be seen in the system, but winter/summer, which on overage may be 7% but between poles again it is enormous, certainly surface currents, storm systems and cloud systems can be coupled to these oscillations and have resonances appear and disappear.
Within this framework, the small difference in energy between solar maximum and solar minimum, might be the straw that broke the camel’s back at certain points where the coupled system is either on an upswing or a downswing, similar to the the way that close to a metastable state, a very small change in parameters can push a system one way or another.
It is good that Anthony does not discourage speculations :).
James Hastings-Trew (16:28:08).
I believe that graph is for Mars, James. Odd how these boffins forget the simple things, isn’t it.
I wished that the following paper gets more attention:
Solar activity and its influence on climate by Prof C. de Jager
Free abstract can be found on http://www.njgonline.nl/index.html
Prof de Jager is an eminent scientist with impeccable credentials. See http://www.cdejager.com/about/
According to de Jager the Sun’s polar activity (as opposed to the equatorial activity) has always been neglected in Sun-climate studies. In this paper he does take account of the polar magnetic fields.
He also makes a prediction for cycle 24: ” These analyses, together with observations of the polar magnetic fieldstrength during the past few years, in combination with considerations of the long-term and short-term components of solar variability enable us to forecast the maximum strength and time of maximum of the next solar cycle #24 (de Jager and Duhau, 2008). We predict a maximum sunspot number of 68 +/- 17 in 2014.”
On the climate-sun relationship: “In a preliminary investigation, that is presently repeated and improved, we found that about half of the Sun’s equatorial magnetic fields and one third of the Sun’s polar fields contribute to tropospheric temperature, with in addition a small gradual temperature increase.”
I hope Leif could explain to us why he never mentioned the polar fields in his posts and whether he thinks they are of any importance.
phil.
This isn’t Anthony’s document, so I don’t think he can switch graphs.
Also you didn’t mention the reply by Svensmark [1]. The document by Laut you link is just a stupid rant (which complete its stupidity by “proving” CO2 is the main climate force with the hockey stick graph).
It was no error with Svensmarks graph. That was the official numbers proper to use when the document was released. (Laut didn’t had correct values to defend his criticism either, which you can see here below, in Svensmarks anwer, and Lauts answer on that [2]).
Laut actually recieved money from the government to humiliate Svensmark, and Laut recieved gratitudes for this by the former chairman of IPCC. Read it here (in Danish; I suggest you to use a good translator) :
http://www.berlingske.dk/article/20071215/danmark/712150037/
—
[1]
http://www.dsri.dk/getfile.php3?id=290
[2]
http://stephenschneider.stanford.edu/Publications/PDF_Papers/Laut2003a.pdf
—
Q about The Real Issue: How can we come through in the media and political world with the facts that AGW is junk science — from the accumulation oof CO2 in the atmosphere to the totally unlikely positive feedback, which also are large?
My link to the answer by Svensmark was wrong. This one will hopefully work:
http://www.spacecenter.dk/research/sun-climate/Scientific%20work%20and%20publications/Comments%20on%20Peter%20Lauts%20paper.pdf
Phil. (17:38:12) : “It has been but the newer versions don’t fit D’Aleo’s story so he chose to use the old discredited one!”
You rely on this old poor accusation from Laut? In fact a positive argument: Palle et al in this peered document shows a correlation betwen CR and low level clouds at a significance rate at 99.5 percent:
http://www.arm.ac.uk/preprints/433.pdf
Palle et al has also showed that ~5 percent less clouds between 1993 and 2001 dedreased the albedo with ~2 percent (during temperature increase) :
http://solar.njit.edu/preprints/palle1266.pdf
They writes: “a surface average forcing at the top of the atmosphere, coming only from changes in the albedo from 1994/1995 to 1999/2001, of 2.7+-1.4 W/m2 (Palle et al., 2003), while observations give 7.5+-2.4 W/m2. The Intergovernmental Panel on Climate Change (IPCC, 1995) argues for a comparably sized 2.4 W/m2 increase in forcing, which is attributed to greenhouse gas forcing since 1850”
–
Other scienetist (mentioned by Svensmark have also showed a CR cloud correlation, and Sloans and Wolfendales critics was poor with an obvious error:
http://climatesanity.wordpress.com/2008/09/05/applying-monte-carlo-simulation-to-sloans-and-wolfendales-use-of-forbush-decrease-data/
Spotting the solar signal in the temperature date is easy if you average it over 1/3 of the cycle length. This example shows 1950-2008 detrended to remove positive PDO, Phil Jones effect etc.
Here’s the link: :o)
http://www.woodfortrees.org/plot/hadsst2gl/from:1950/mean:43/detrend:0.5/offset:0.6/plot/sidc-ssn/from:1950/scale:0.0015/mean:12
nobwainer (Geoff Sharp) (19:33:04) : “Landscheidt doesnt predict the next grand minimum to start at SC24, he infact states less than 80 SSN with most of the action around 2030…so who will it be named after if it starts now?”
The temperatures we have now isn’t a grand Minimum (or even a little one).
You’re right about Maunder Minimum conditions 2030 [1], but due to Landscheidt a substantial drop in temperature will start 2014, after the maximum of SC24 [2].
[1] http://landscheidt.auditblogs.com/archives/17
[2] http://landscheidt.auditblogs.com/archives/44
“The relative positions of U,S,J,E and V start to fall into diminished configurations from late 2013/early 2014, leading to a lower sunspot count in second half of the cycle. This will be accompanied by increasingly lower global temperatures from 2014 to 2020.”
Maunder Minimum conditions (no sunspots) from now on I don’t think anyone believe in, but already 2015 we may see if Landscheidt is right. (He’s right about the El Nino 1998, or? Interresting times…)
Chris Schoneveld (02:01:27) : I hope Leif could explain to us why he never mentioned the polar fields in his posts and whether he thinks they are of any importance.
http://www.leif.org/research/Polar%20Fields%20and%20Cycle%2024.pdf
Thought I’d save Leif another posting of this site as he just sent me there a couple of days ago:)
Mike D. (00:23:37) :
Glad you brought the flood basalts up. The vulcanologists aren’t sure whether an ‘effusive’ eruption like this would chuck enough into the atmosphere to affect world wide climate.
Seems to me that a few degrees of solar heating over a few hundred sq. miles sets off pretty respectable hurricanes. Would anyone care to speculate as to the weather system that would build up over 100s,000 sq miles with a ground temp of > 100C say.
Surely it would dominate weather world wide?
I’m seeing some kind of hyper-hyper-hurricane probably spinning off very respectable storm systems in their own right?
Magnus (03:13:47) :
The temperatures we have now isn’t a grand Minimum (or even a little one).
Its not about temps although we seem to be heading south quickly, its about the Sun falling into grand minimum( my view is less than 50SSN). I am predicting SC24 will be the start of the next grand minimum which is happening now even though its early days and will will prob start to climb out around 2030. The positions are very good right now and will be at full force at Feb 2010. Expect SC25 to be the same.
Maunder Minimum conditions (no sunspots) from now on I don’t think anyone believe in
We wont get Maunder Min conditions this time around…perhaps even less than Dalton conditions I think, more likely 2 low cycles followed by a recovery, the J+S positions are now weakening and this might be the last grand min for some real distance into the future….we are on the tail end of a truly golden era.
BTW you are quoting links from the site I manage….see my theory here. http://landscheidt.auditblogs.com/archives/58
Landscheidt has done some great work, but I believe what Carl Smith has extracted might go further.
keith (09:36:33) :
“and what does the Sun have to do with heating the Earth?”
and what does my boiler have to do with heating my home?
Concerning Yellowstone:
http://www.telegraph.co.uk/earth/environment/4032098/Yellowstone-Park-shaken-by-hundreds-of-earthquakes.html
My own simple calculations (using data from relatively remote temperature stations with long, unbroken histories) indicate temperature tracks the sunspot cycles (with a physically based delay of a few years). Credible scientists, like Leif, indicate changes solar energy cannot be the “basis”. Thus, I assume there is some other mechanism. However, not knowing the mechanism (yet), does not make the phenomenon disappear, I think.
Is that a spot down there?
http://sohowww.nascom.nasa.gov/data/realtime/mdi_mag/1024/latest.html
Shame – that IBD article starts out with a statement that misinforms the public:
When the sun is active, it’s not uncommon to see sunspot numbers of 100 or more in a single month.
Folks just starting to pay attention will read that and see a feeble start as back to business as usual.
Magnus: Geoff is probably aware of what Landscheidt said (since he runs the website you link to), but it should be noted that Landscheidt’s predictions based on planetary alignment considerations should be reconsidered in the light of Ching Cheh Hungs paper which considers V,E,J to be sufficient to account for most of the effect. This shows the syzurgies going out of phase earlier, around 2004.
I can’t get Leif Svalgaard to comment on Hung’s paper despite many attempts, he always dismisses anything to do with the planets effect on the sun as ‘Astrology’ despite the successful predictions of solar flares and the substantial correlation presented, and despite Ching Cheh Hung’s status as a published NASA scientist. Leif is adamant that gravity is too weak, and electromagnetism is too ‘WOO WOO’ to be considereed.
I think he is wrong to dismiss the interesting and as yet unfalsified theoretical and hypothetical mechanisms on offer.
New Little Ice Age Instead of Global Warming?
by Dr. Theodor Landscheidt
http://www.schulphysik.de/klima/landscheidt/iceage.htm
Let’s see, we are starting off 2009 with the possibility of a grand minimum and Yellowstone is rocking like crazy. Interesting times we live in.
I am curious, how does 2012 affect the sun, I understand the earth is at the center of the galaxy or something?
Those values from max to max of 21 to 22 of 9.7 years and cycle 22 length min to min 9.8 years were based on the data not the graph. They fit the original graph. They both are very short suggesting warm temperatures in the 1990s. The interval of cycle 22 max to cycle 23 max centered in the mid 1990s began to increase at 10.7 years is nearere normal and the min to min length of cycle 23 now at least 12.3 years is well above normal.
Also all the arguments/questions (Phil et al) seem to focus on the cycle length plot but not with the global temperatures. Remember all the other posts here showing the warming in the global data bases is likely exaggerrated for a number of reasons including bad siting, lack of urban adjustment, station dropout. This exaggerration may be 50% (at least 5 peer review papers suggest values 30-50%).
pkatt (03:27:33) :
Many thanks for Leif’s PDF link
:Issued: 2009 Jan 01 0927 UTC
:Product: documentation at http://www.sidc.be/products/ri
#——————————————————————–#
# MONTHLY REPORT ON THE INTERNATIONAL SUNSPOT NUMBER #
# from the SIDC (RWC-Belgium) #
#——————————————————————–#
Provisional International monthly mean Sunspot Number for
December 2008 : 0.8 (zero point eight)…