From ICECAP
By Joseph D’Aleo CCM, AMS Fellow
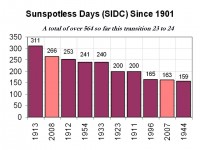
2008 will be coming to a close with yet another spotless days according to the latest solar image.
This will bring the total number of sunspotless days this month to 28 and for the year to 266, clearly enough to make 2008, the second least active solar year since 1900.
See larger image here.
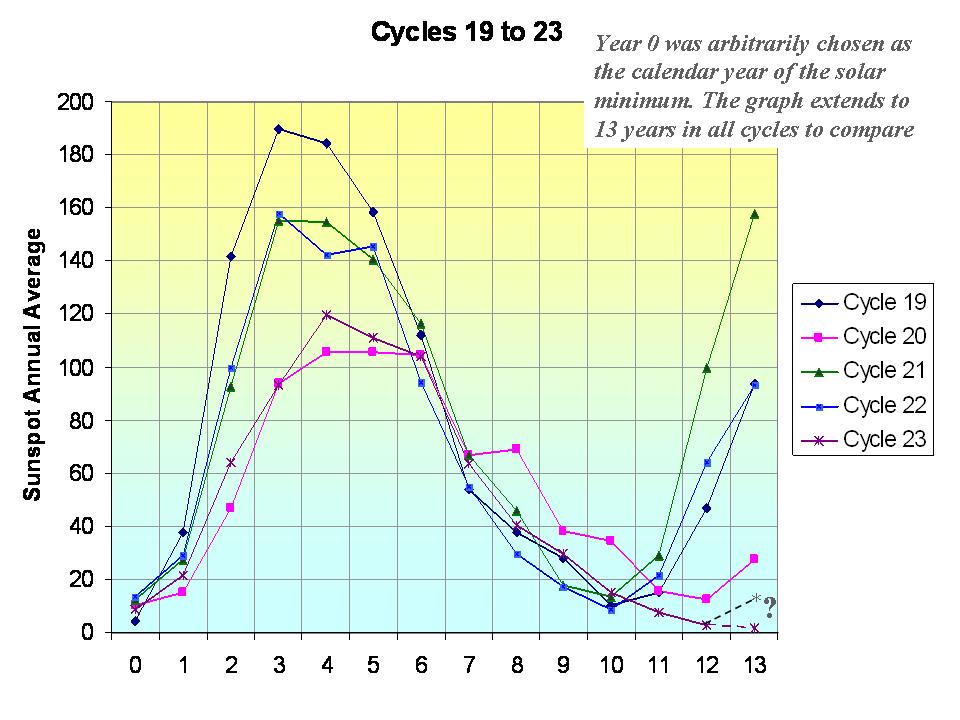
The total number of spotless days this spolar minimum is now at around 510 days since the last maximum. The earliest the minimum of the sunspot cycles can be is July 2008, which would make the cycle length 12 years 3 months, longest since cycle 9 in 1848. If the sun stays quiet for a few more months we will rival the early 1800s, the Dalton Minimum which fits with the 213 year cycle which begin with the solar minimum in the late 1790s.

See larger image here.
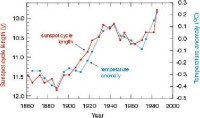
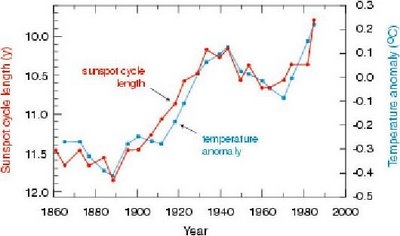
Long cycles are cold and short ones like the ones in the 1980s and 1990s are warm as this analysis by Friis-Christensen in 1991 showed clearly.
See larger image here.
In reply to the arguments made that the temperatures after 1990 no longer agreed with solar length, I point out that it was around 1990 when a major global station dropout (many rural) began which led to an exaggeration of the warming in the global temperature data bases. Also the length from max to max of 21 to 22 was 9.7 years and cycle 22 length min to min 9.8 years, both very short suggesting warm temperatures in the 1990s. The interval of cycle 22 max to cycle 23 max centered in the mid 1990s began to increase at 10.7 years and the min to min length of cycle 23 is now at least 12.3 years.
With the Wigley suggested lag of sun to temperatures of 5 years and Landscheidt suggested 8 years, a leveling of should have been favored around 2000-2003 and cooling should be showing up now. Looking ahead, put that together with the flip of the PDO in the Pacific to cold and you have alarming signals that this cooling of the last 7 years will continue and accelerate.
I keep looking for this cycle to get off of the SC4-5 plot, but it refuses:
http://www.robertb.darkhorizons.org/DeepSolarMin.htm
If 2009 lies as flat as a pancake, we’re there.
What exact shape will SC24 then take?
I’m guessing the opposite of SC5, or not the double hump.
No science, just pattern matching.
SC24 max = 50 +_10 in 2014.
If the shoe (cycle) fits, wear it.
The Stephen Schneider paper refuting the Friis and Christensen paper didn’t use the “actual” solar cycle length data – they used a variation based on the 22 year Hale solar cycle versus the more common 11 year Schwabe cycle.
Friis and Christensen’s conclusions continue to stand.
You can do your own math here – although this page has solar cycle 24 starting in January 2008 when it is still not clear when and if solar cycle 23 has ended yet (probably July or August 2008 though).
http://en.wikipedia.org/wiki/List_of_solar_cycles
Joseph (12:04:45) :
Your correct, I keep forgetting that politics is the opposite of truth and logic.
WOW, 273 earthquakes in the past 7 days!
CO2 causing this as well? Call Hansen, Gore and Obama asap.
The Laut paper was discussed in passing by Nir Shaviv here:
http://www.sciencebits.com/CO2orSolar
To the solar experts –
It is often argued that TSI has not changed enough to explain global temperatures. Of this Total Solar Irradiance, is there a component of it (perhaps a few wavelength bands) that does vary, plus others that make up the total, such that the oscillations of the more important bands are varying but the total is not much? i.e., is there a component that is mostly reflected that doesn’t matter much, but another that is absorbed that does? – and what are the oscillations of these components?
Thanks… And Happy New Year!
Warren over at climate skeptic has a good article about the same thing except he has added ocean circulation.
Isn’t it strange that if man is controlling the climate, why can he only sit and watch what will be. Shouldn’t we be doing something other than sit here and freeze? Warm is far friendlier to mankind.
Communism and it’s brethren, from socialism to outright skull crushing tyranny, killed by some estimates, between 100-125 million people in the 20th century. I doubt that any worst case scenario of AGW or a natural ice age either, can top that mark. Man seems to have his own ways. I note, isn’t it warming that we don’t know how many millions died, because of socialism/Communism, to better than +-10 million?
Rather than trying to control the uncontrollable, maybe man should try to control what he can — His own lust for power and ruthless domination of others.
May I suggest to this extraordinary site an idea?
Make the following experimental test, which could be seen through a live cam:
Build two crystal boxes, put a plant (or several) in each box. Remove all CO2, continuously, from one box, circulating the air through a Lithium Hydroxide filter, and connect the second one to a CO2 cylinder, keeping CO2 concentration above 5000 ppm or more. Then name the first one: Al´s world, and the second one: Human´s world.
Everybody will watch how life decays in Al´s world and flourishes in Human´s world.
A cool cold next year for all of you!!
David L. Hagen (13:45:07) saith: “For variety, here is a 2007 paper claiming the opposite: ‘Recent oppositely directed trends in solar climate forcings and the global mean surface air temperature’ –MIKE LOCKWOOD, CLAUS FROHLICH”
Very interesting. On first reading, I see no obvious flaws, and it’s well written. Definitely worth another read or three, and a thread. Thanks for the link! Anybody else read it?
anna v (13:53:52) wrote
David Archibald has plots from specific regions/stations that show a correlation of sunspot cycle length and temperature
http://www.warwickhughes.com/agri/Solar_Arch_NY_Mar2_08.pdf
Thank you for the link to this paper Anna. He states his case quite succinctly, but I really, really, hope he is wrong.
MattN (15:58:54) :
As much as I like the sunspot duration/temp graph, it’s old. The last data is 1980. We now have 28 more years of data. Why hasn’t that graph been updated?
It has been but the newer versions don’t fit D’Aleo’s story so he chose to use the old discredited one!
Cary (14:37:31) : I hate to break in to your Holiday thoughts but Tamino’s last post calls Mr. Watt stupid and/or a Liar. He also implies that all readers of wattsup are stupid also.
Says more about Tamino, I think. The high road obviously isn’t his usual route.
I liked the comment there from TCO’s alter ego which Tamino has left unanswered: “how many years decline or plateau would be sufficient to make you decide major problem with AGW” Of course, Tamino’s whole post was that every year this century has been the hottest on record so he would be in a real bind to answer it.
And, while railing about misleading statistics, he stops at 2001 with his 5-year and 10-year averages claiming insufficient data for those following. I guess he feels that “stupid” people won’t notice anyway there is no real need to start on a year divisible by 10 although one commenter did point it out. Tamino’s response: “I started with 1880 because that’s an even multiple of 10, and that’s when GISS data begin. I suspect that anything else would compromise the ‘keep it simple’ principle.” — not to mention it might contradict his argument.
Nor does he see anything wrong with allowing one exceptional year to be propagated to the surrounding years. He has a LOESS curve but neglects to tells us how he got it (although implies he used the annual averages). What he should have used instead was monthly data and even then, it may not be enough data. The last thing anyone should do when using LOESS is eliminate local structure. Here are some thoughts from NIST on using it. Read the section regarding pitfalls.
http://www.itl.nist.gov/div898/handbook/pmd/section1/pmd144.htm
One is the general caution regarding outlier affect on regressions and another is “LOESS needs good empirical information on the local structure of the process in order perform the local fitting”.
His methodology almost completely eradicates the cooling trend from 1940 until almost 1980. A trend which caused nearly as great alarm then (among fear-mongers, that is — one of them named James Hansen — though not as much media attention then) as the trend at the end of the last century has.
So, who is using misleading statistics on the unwary?
REPLY: Ask Tamino about Ian Joliffe, and why no other scientists and contributors guest publish on “Open Mind”, like they do on WUWT. The answer will help you decide. – Anthony
Thank you Google Books. Here’s a month-by-month account of Philadelphia weather from 1790 to 1847. First surprising bit of info: in January 1790, the temperature reached 70, and boys were seen swimming in the Delaware River.
http://books.google.com/books?id=yXkWAAAAYAAJ&pg=PA9&lpg=PA9&dq=temperature+philadelphia+1790&source=web&ots=kDcJ9xhG8H&sig=ocb5JfGI5A8j5ApWfBacyRyY2pY&hl=en&sa=X&oi=book_result&resnum=3&ct=result
Robert Wood: Do you have any references for the 60-year ocean time constant you mentioned?
The latest version of the Southern Ocean SST (ERSST.v3b) has it rising for 75 years from ~1920 to ~1995, before it started its decline.
http://i44.tinypic.com/2uen29u.jpg
But in the earlier version (ERSST.v3), the rise lasts until the early 1980s, making it approximately 60 years, hence my question.
http://i35.tinypic.com/s3djds.jpg
Michael S (17:21:31) saith: “To the solar experts – It is often argued that TSI has not changed enough to explain global temperatures. Of this Total Solar Irradiance, is there a component of it (perhaps a few wavelength bands) that does vary, plus others that make up the total, such that the oscillations of the more important bands are varying but the total is not much?”
I’ve studied astrophysics and orbital mechanics at school, but I’m surely no expert. What the heck, why should that stop me?
Yes, there is another solar ‘component,’ I believe. Pick one: u.v. radiation, x-rays, and magnetic flux. UV flux has dropped by about 1/2 lately; x-rays are down by 10000:1; magnetic flux varies by about 3:1 over a solar cycle. There is also the interplanetary magnetic field, which has dropped off by 10:1 since July of 2003 (peak value 35 –> 3.5). TSI is a constant; these others are wild-ass variables, as you can see.
Read that Lockwood & Froehlich paper referred to above for some good stuff. What’s really happening? Nobody knows. My favorite is this: {woo-woo ON} Moving a conductor in a magnetic field produces current. The Earth core and oceans are both conductors, one strong, one weak. As the Earth orbits the Sun, electricity flows from core pole to core pole via the ocean, warming it. The oceans store this heat and give it up periodically, according to laws that we know not.
Another candidate is raising of the blackbody temperature of the night-time sky by refracted uv/x-rays/cosmic radiation. {woo-woo OFF}
Does this help?
jorgekafkazar (18:00:20) :
The Earth core and oceans are both conductors, one strong, one weak.
I’m not so sure the ocean as a conductor would be considered weak. Resistance should increase with distance linearly, but decreases with area of the conductor linearly as well. It’s a long distance but also a huge area. Just guessing here but I would be inclined to think that current would flow very easily through the oceans especially if you consider all the possible paths of the circuit… Has anyone published anything on this concept? Looking up the conductivity of ocean water…
Anyone know where to find examples of the cyclical nature Jorge mentions?
Long cycles are cold and short ones like the ones in the 1980s and 1990s are warm as this analysis by Friis-Christensen in 1991 showed clearly.
Certainly not in all cases, perhaps his graph needs to go back further. Assuming extra activity=more temperature….we have had several long cycles (over 11.9 yrs) with varying modulation strengths SC5 & 6 are a product of Grand Minima so are controlled by outside forces, SC4 & 23 (could be the 2 longest) were strong cycles that were/are precursors to Grand Minima. SC9 was a medium strength leaving SC13 & 14 which were low activity (expected at the time of lowest angular momentum)
Ron de Haan (16:40:07) :
The new “Maunder Minimum” already is named after Dr. Theodore Landscheidt and it’s called the Landscheidt Minimum which will have it’s Maximum by 2030.
Landscheidt doesnt predict the next grand minimum to start at SC24, he infact states less than 80 SSN with most of the action around 2030…so who will it be named after if it starts now?
‘nobwainer (19:16:10) :
SC4 & 23 (could be the 2 longest) were strong cycles that were/are precursors to Grand Minima. ‘
Sure is shaping up that way.
They already do.
He should call it Open Skull, because the cold air is definitely getting in.
James Hastings-Trew (11:40:06) saith:
“Phil: …The article then goes on to discuss political and sociological implications of the “incorrect” graph rather than merely discuss the matter in a purely scientific / mathematical manner. Sorry, but for me, this paper (already 4 years old) doesn’t pass the sniff test….
I, too, smelled a rat as I read the Damon & Laut paper, probably based on the grotesque, insulting and unprofessional phrasing. On re-reading it, I kept wondering if I sensed the hand of at least one unlisted author. It took a while to notice that M. Mann was one of the referenced data sources.
Anyone else notice that a couple of those low spot years occured at, or around, the time of intense cold in Europe? Times that saw alot of people freeze to death? Specifically World War I, The Ukranian Famine of ’32-33 and World War II. Correlation may not be causation, but it sure as heck is concidental.
I was going to refer to this before, but some time ago I did a correlation analysis to HadCrut anomaly changes versus the length of time elapsing since the min/max antecedent to the most recent min/max (among other correlation analyses I did).
The study I did generally agrees with the relationship of solar cycle length versus temperature change. The reason for the above correlation study was that the temperature is positively correlated with time elapsing since the most recent min/max with time, but as the successive cycles lengthen, there is a definite negative correlation. These two effects will somewhat offset, but as the cycles lengthen, the negative correlation dominates. Multiple lengthy cycles will drive temperatures down.
The full study I did is here:
http://digitaldiatribes.wordpress.com/2008/10/07/solar-cycle-length-sunspot-count-and-temperature-an-insurance-pricing-analysis/
The specific charts that show the negative correlation are here:
http://digitaldiatribes.files.wordpress.com/2008/10/parameter22.jpg
http://digitaldiatribes.files.wordpress.com/2008/10/parameter42.jpg
I hope to build on this study. I am currently compiling the Ocean Index data, Carbon Dioxide data, as well as the sunspot data. Through a similar correlation and minimum bias analysis, I hope to improve on eliminating cross biases and painting a truer portrait of what elements truly have a significant impact on temperature.