Old Radar Sites In Greenland Show Icecap Growth Over the Years
(And let’s not forget what we’ve learned about the temperature reporting from the DEW line Radar Stations – Anthony)
By Joseph D’Aleo, CCM, AMS Fellow
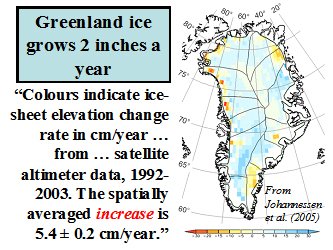
Though the ice may be melting around the edges of the Greenland Icecap in recent years during the warm mode of the AMO much as it did during the last warm phase in the 1930s to 1950s, snow and ice levels continue to rise in most of the interior. Johannessen in 2005 estimated an annual net increase of ice by 2 inches a year.

(Above: Recent Ice-Sheet Growth in the Interior of Greenland, Ola M. Johannessen, Kirill Khvorostovsky, Martin W. Miles, Leonid P. Bobylev, Science Express on 20 October 2005 Science 11 November 2005: Vol. 310. no. 5750, pp. 1013 � 1016, DOI: 10.1126/science.1115356)
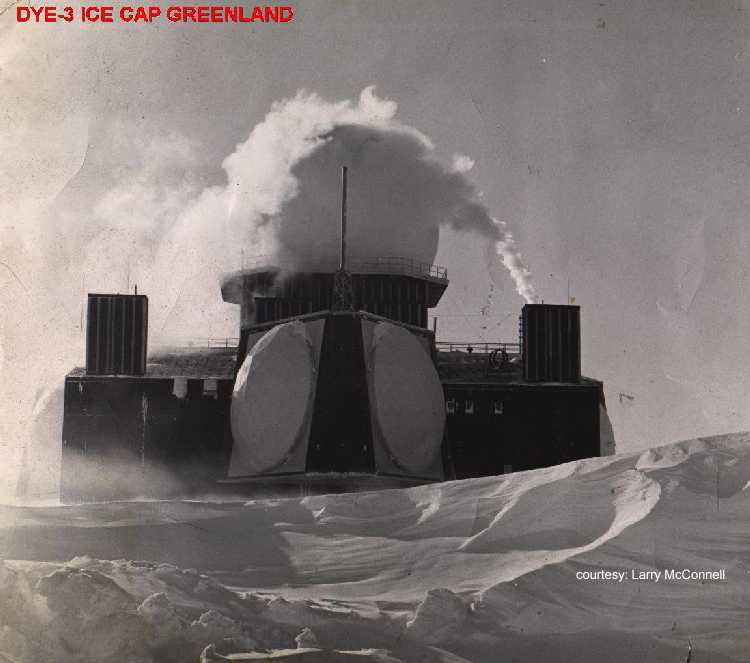
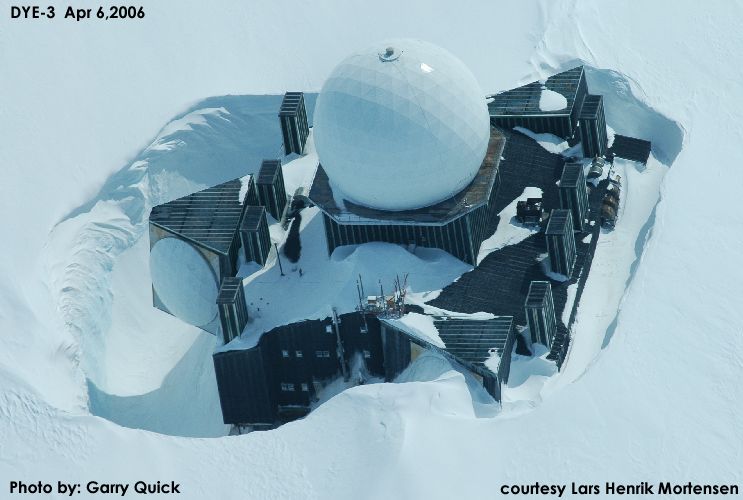
A Canadian Icecap emailer noted during the cold war there were two massive radar sites built on the Greenland icecap now abandoned. They are called Dye-2 and Dye-3. When built they sat high above the snow, recent pictures show how the snow is building up around them, proving the snow build-up in recent times. This demonstrates this snow accumulation over time.
Dye-2 and 3 were among 58 Distance Early Warning Line radar stations built by America between 1955-1960 across Alaska, Canada, Greenland and Iceland at a cost of billions of dollars. Their powerful radars monitored the skies constantly in case Russia decided to send bombers towards America. After extensive studies in late 1957, the USAF selected sites for two radar stations on the ice cap in southern Greenland. Dye-2 was to be built approximately 100 miles east of Sondrestrom AB and 90 miles south of the Arctic Circle at an altitude of 7, 600 feet, and Dye-3 was to be located approximately 100 miles east of DYE II and slightly south at an elevation of 8,600 feet.
The selected locations for the new radar sites were found to receive from three to four feet of snow fall each year. Since the winds were constantly blowing with speeds as much as 100 mph, this snow accumulation constantly formed large drifts. To overcome this potential problem, it was decided that the Dye sites should be elevated approximately twenty feet above the surface of the ice cap.
Dye 3 was built in 1960. From a distance the structure, with its onion-shaped dome, looks like a Russian orthodox church. Dye 3 was an ice core site and previously part of the DEW line in Greenland. (The Distant Early Warning (DEW) Line: A Bibliography and Documentary Resource List Arctic Institute of North America, Page 23). As a Distant Early Warning line base, it was disbanded in years 1990/1991. The Dye 3 cores were part of the GISP (Greenland Ice Sheet Project initiated in 1971) and, at 2037 meters, was the deepest of the 20 ice cores recovered from the Greenland ice sheet as part of GISP. Samples from the base of the 2km deep Dye 3 and the 3km deep GRIP cores revealed that high-altitude southern Greenland has been inhabited by a diverse array of conifer trees and insects within the past million years. (Eske Willerslev, et al. (2007) Ancient Biomolecules from Deep Ice Cores Reveal a Forested Southern Greenland Science 317 111-114)
The first image below is from 1972.

See larger image here.
Here it is in 2006.

See larger image here.
In looking back at the time the sites were abandoned, one console operator lamented “We were very busy during this time and I was sad to see it end. I remember thinking of all the waste,” he said. The site is slowly disappearing into the snow. Its outbuildings are no longer visible and drifting snow will consume it completely one day, but that day appears to be decades away.” Read more here.
To Carlo:
According to the above discussion, Greenland may have lost of order 1000 km3 of ice in the recent 10 years. Take for simplicity only 100000 km2 of southern Greenland and attribute all loss to that area. Makes it an average loss of 1 meter ice in that area. And this should lead to an annual raise of 4 cm per year or 40 cm in 10 years?
That really would be a special sort of jelly (following Jerry).
I know the total area of Greenland is 1.7 million km2 with about 3 million km3 of ice, equivalent to approx. 7 m sea level.
How odd that the fall out from 40s/50s open air nuclear tests in many places can no longer be found. Meaning, no topping up.
As for the principle of building sand or snow dunes, just put any obstructive buildup and it will, thus zero surprise those radar stations now lying deeper in.
Just so that we can be clear on this could you tell us what the signature would be for:
a) No warming or cooling.
b) Cooling.
Presumably these signatures would be completely different from a warming signature and so would be easily distinguishable.
P-38 was a fighter (i.e. pursuit plane). B-17 was a bomber.
The ice is “plastic” as evidenced by the flow of glaciers. Any heavy structure built on the ice will sink over time.
Bruce said,
(21:05:06) :
“I think the truth is they are still calibrating Grace.
http://www.sciencedaily.com/releases/2008/12/081215091013.htm
Some ice melts, the bedrock rises. More ice acculumlates, the bedrock sinks and they have to guess what it all means.”
The article you pointed to was about Antarctica. The article on Greenland I linked had a section about the changes in the earth’s crust. It said,
“To confirm just how much of the mass Grace detects in Greenland and Antarctica is due to snow and ice, scientists also have to determine the contributions from another source, Earth’s changing crust. “When Grace sees a change in polar gravity,” says Watkins, “part of it is today’s ice melt and part is what is called post-glacial rebound.”
“A long time ago during the last ice age, this region was pushed down by even more snow and ice, and now this mantle wants to come back, or rebound,” explains Erik Ivins, a JPL Earth scientist and Grace science team member.
One way to look at the problem, says Ivins, is to imagine a bathtub filling up with water from a faucet but losing water from holes in the bottom of the tub. At the same time, the bathtub may be changing shape.
Ivins and his colleagues are refining the computer models used to understand and predict post-glacial rebound. It turns out that beneath the ice sheet covering Greenland, the mantle isn’t changing the shape of the “bathtub” very fast. “This tells us that the large mass changes Grace detects in the southeastern region of Greenland aren’t due to post-glacial rebound,” says Ivins. ”
So the rebound could make us think that greenland was actually losing less ice than it is, if it were not taken into account.
You have to view it like a water bed. If somone lays beside you, you go up. If that same person gets up and leaves, the area of the departing person rises, and you sink.
Land rising in itself does not necessarilly mean that the ice it carries is diminishing. It could also mean that the nieghbouring land is just getting a heavier load (more snow). Kind of Like a teeter-totter.
266 spotless days in 2008 – 2nd most spotless year since 1900.
http://icecap.us/index.php
Jack Simmons (21:06:25)
“Sometime in the future, and I don’t think it will be decades, people will simply laugh at this silliness.”
But will we and our children be laughing at the taxes, both overt and hidden, and lost liberties which are constantly being eroded?
Once a cap ‘n trade is and the giant bureacracy required to run it (gov’t run of course) is in place, good luck removing it. It needs to be fought now.
Canadians sent a resounding “No” to carbon taxes, but now they are trying to negotiate a cap ‘n trade policy with the USA. A little summary of the expected regulatory environment from the National Post is here:
http://network.nationalpost.com/np/blogs/fpcomment/archive/2008/12/02/cap-and-burn-canada.aspx
I’ll go out on a limb and say:
2007/2008 are likely the most spotless consecutive 2 years in a couple of centuries.
And keep in my our modern observational technologies!
I don’t think the change in snow depths around the DYE stations mean much. I suspect that snow drifting is somewhat like sedimentary deposits in water.
My parents used to live on a tidal estuary in Florida. Think mud flats.
One year a small concrete post with a sign warning of a submarine cable crossing was emplaced in the middle of the estuary. The post was perhaps 8″ square. At low tide the base was in maybe two feet of water, and it protruded about 6′. At hightide the post protruded maybe 3′. The flow was perhaps 4 mph at peak.
Ten years later the post was towards one end of a mud island, perhaps 100′ x 20′ at high tide and 400′ x 40′ long at low tide. Perhaps 18″ of the post protruded from the soil. About 40′ from the post there was now a deep water channel 6′ or so deep at low tide whereas formerly one could only navigate in that area by canoe.
As far as I could tell the cause of the radical transformation of the topography was solely the result of the small perturbation in the current and the consequent “drfiting” of the sediment caused by putting that little post in.
Similarly in my back yard the planting of an apple tree, a meager sapling, caused a far larger drift of snow to occur stretching for many yards.
I have seen several foot deep snow drifts formed in a flat featureless plain by the minor wind perturbation of a ground level railroad track.
I would not attach much importance to the “burying” of features like the DYE stations in Greenland.
O/T Maybe a Q for Leif,
On Spaceweather.com, the holographic image of the Sun, which is normally four or five days later than the current image, shows a possible far-side sun-spot. Shouldn’t it be visible from Earth by now?
If anybody can contact Mr D’Aleo, please let him know his Icecap.us site is down.
philincalifornia
The link below leads to information on projected future sea level rises in San Francisco bay of 20-80 cm. This estimate goes directly back to what I said in an earlier post that govt agencies are being instructed to use IPCC projections whether or not they are rooted in reality –this estimate goes from the bottom to top end at from 8 inches per century-(reasonable) to getting on for three feet-(fantasy figures).
http://www.climatechange.ca.gov/events/2006_conference/presentations/2006-09-14/2006-09-14_KNOWLES.PDF
The next link gives information on the bay-you appear to have the longest tide gauge measurements in the western world. Over the last century the mean sea level rise has been eight inches. Intriguingly the first report above seems to have taken a projection that doesn’t match the actual figures-sea levels appear to have dropped over the last 2 years but the projection is taken from the high point.
http://oceanservice.noaa.gov/topics/navops/ports/san_francisco_tide_gauge.pdf
There is a famous sea level mark in Australia made about the same time as your tidal gauge was established, held up by the Australian authorities as ‘proof’ of considerable rise-nicely debunked by John Daly in this link
http://www.john-daly.com/ges/appendix.htm
This all demonstrates that sea levels go in cycles as does the climate-I would hazard a guess that the warm periods prior to 1850 would have had a higher mean sea level than when the tide gauge was established in the 1850’s and todays levels are merely approaching it again
This is my own graph of Hadley CET figures (I am British) which shows temperature spikes back to the 1660’s. If your part of the world resembles this dataset the thermal expansion mentioned below would only kick in during the warm years thereby raising sea levels.
http://cadenzapress.co.uk/download/menken_hobgoblin.jpg
San Francisco bay sea levels are complicated by regular cyclical thermal expansion (the PDO?) Building and seismic activity-it is difficult to believe your famous earthquakes haven’t had some effect on sea levels locally.
All things being equal however I would say nothing extraordinary is happening and there is no evidence whatsoever to support a 80cm rise and the next few years might see a continuation of the current apparent fall (eyeballed only)
TonyB
Carlo:
Using the current rate of isostatic readjustment to prove current changes of an icecap is nonsense and those “scientists” must know that. In northern Sweden the land is rising about 3 feet per century, in Stockholm about 1.5 feet per century. That is due to a melting ice-cap allright, but one that melted about 11,000 years ago. Rock does flow, but not fast. Also we don’t have a good understanding of the rheology of the Earth, so we can’t really estimate how fast isostatic readjustmen occurs.
By the way it is this uncertainty about isostasy that make the GRACE data extremely dubious. The results must be adjusted by ‘modelling’ the movement of the rock under the ice-cap. So to calculate the current change of the icecap thickness, you first have to know the current and past changes of the thickness and integrate their effect on isostasy.
By the way that New Scientist writer doesn’t seem to have the slightest idea of the magnitude of glacial isostasy. “Leaving beaches often metres above the water”, indeed. 285 metres in Central Sweden to be exact.
A little note on the difficulty of determining sea level. The sea level during the last interglacial is an AGW poster child. It is invariably stated to have been 4-8 meters higher than at present. Actually nobody knows how high it was since it is extremely difficult to find a place where the land hasn’t either sunk or risen during the last 100,000 years. The last interglacial coastline can now be found anywhere from +190 metres to -130 metres depending on where you look for it. This means that the land has risen from +2 to -1 millimeter per year over a 100,000 year period. Short term changes are of course much larger. Measuring sea-level changes of fractions of millimetres per year without a very good independent coordinate system (meaning GPS) is in my opinion impossible.
Isn’t Obama amazing?
He said that “this is when the oceans stopped rising” when he accepted the Democratic nomination and he was right!
Just looking at the provided image, the integration of the losses and gains points towards a net gain.
The losses are not all along the coast like you would expect, but are limited to certain areas. Perhaps 60% of the coastline has shown losses with the other 40% showing no change.
Jerry:
To add to your discussion about isostacy: remember that ocean plates also aren’t fixed and will sink under the weight of water due to ice melting.
Secondly, ice sheets also have gravitational effects, so during the last glacial maximum, the northern hemisphere ice sheets pulled more ocean water towards them due to gravitation.
Jerry, let me echo the thanks of people before me on your very educational response to my question.
I Googled around a bit for more local information. This is pretty interesting:
http://www.bcdc.ca.gov/planning/climate_change/SLR_strategy.pdf
These people, who appear to be looking at practical approaches to conservation of the Bay (as opposed to the carbon swearbox approach) quote a rise in the Bay water levels of 7 inches between 1900 and 2000. I assume that would’ve been measured using tide poles. There is no mention of local land elevation rises (or declinations) affecting this number (although this might not necessarily be the forum for getting into the specifics of that). Given the high seismic activity of the region and known changes in elevation (for example tide pools rising many inches following the 1989 Loma Prieta quake in 1989), one would have to believe that this would affect the numbers for the SF Bay to some extent.
A quote from the authors:
“1 It is particularly difficult to develop a thoughtful strategy for dealing with sea level rise in the Bay when the temperature increase scenarios used by the California Climate Change Center yield possible increases in water level in San Francisco Bay over the next 100 years that have a tenfold difference between the lowest and highest potential increases.”
Good luck with that guys.
It’s so much easier to just legislate against carbon dioxide, isn’t it ??
Alan The Brit — “The problem is that the Tyndall Centre & the Hadley Centre were all set up to find evidence of Global Warming caused by mankind. “
Sort of. Their models were designed from the start to look at the effect(s) of CO2. They put variables in, slosh it about, and not so surprisingly, the answer is that CO2 has something to do with it all. (Wow. Who knew?)
Models don’t discover correlations with solar output, geomagnetic flux, or cosmic rays. They can’t; they’re designed to model what happens when CO2 is increasing.
That models support the CO2 hypothesis is expected, yet the reporting on this seems to not quite grasp that these models are wholly unable to come to any other possible conclusion. I reckon it’s the reporters who don’t grasp it therefore are unable to frame things in context in their “reporting.” None of them seem to know the difference between technology and magic anyway, thus exposing themselves as the butt of Arthur C Clarke inspired after-dinner barbs. Unfortunately, most politicians have no idea who Clarke was, either.
Let me get this straight – The ice and snow melt – -the sea rises – but nothing gets flooded because the land rises along with the sea. Where’s the problem?
“Grace measurements have revealed that in just four years, from 2002 to 2006, Greenland lost between 150 and 250 cubic kilometers (36 to 60 cubic miles) of ice per year.”
It will be interesting to see what things have done since 2006. It would not surprise me to learn that those conditions have reversed since then.
As for sea level, I think we can state with fair certainty that the last interglacial saw higher sea levels even if we can not determine accurately exactly what they were. We would know this simply from seeing where the tree line was. I believe I read that the tree line was some 400 (either km or mi. I can’t remember the units used but I remember the number 400) North of where it is now in North America. If the tree line was 400 miles North of its present location and the continents haven’t shifted much from their present location in that period, we could reasonably assume that Southern Greenland, for example, would have been much warmer than it is now.
If retreating glaciers in Greenland were to expose any small ponds that would have existed during that period, pollen from sediment at the bottom of those ponds/lakes might give us some idea of the glaciation cycles of that area.
But overall, glacial periods are becoming longer. The “normal” state of the system is glaciation with “interglacial” warm periods a temporary state. I believe we would be best served to look at things in that light when making plans for such things as nuclear contamination storage. A good place might be, instead of a mountain in Nevada, a place blasted into bedrock in Northern Canada that will be under a mile of ice for 100,000 years starting at some point in the not too distant future.
And since the switch to glaciation appears to happen quite rapidly we need to have at least some idea of what we are going to do to help our citizens in Alaska and our neighbors in Canada when climate shifts suddenly and their land becomes uninhabitable. As we are entering a period of orbital shape that is increasingly favorable to glaciation, it might take only one deep solar minimum to trigger the switch. If the Little Ice Age were to repeat today, we might not come out of it. And if we do, and if it happens again 200 years from now, we would stand an even better chance of not coming out of it as the orbit will be even more favorable to glaciation than it is now.
The answer to some of the questions upthread with regard to the settling of the DYE-2 station can be found here [scroll down to the second to last graphic: “Table 1”].
Yeah, I’ve mentioned this here before (been a while). Good thing all that ice melted…
Y2K wasn’t a complete delusion, there was some risk. It was, however, blown WAY WAY WAY out of proportion.