It has been 10 years since the super El Niño of 1998 helped to spike global temperatures dramatically. Now since it appears we are in the opposite phase, I thought it would be interesting to look at the 10 year trend from January 1998 to January 2008.
Here’s a link to a 2-minute video called “The El Niño Factor”. Bob Tisdale points out to me this interesting graph: (slightly modified the key placement to fit the image in this blog)

Here’s the link to the Webpage that’s the source of the data for the above graph.
Now let me be clear that a 10 year trend period is not typical for climate analysis. Typically a 30 year period is used to establish a climate baseline. For example, NOAA publishes climate summaries for cities in the USA based on 30 year periods. I’m not trying to do anything to compare to the last 30 or even the last 100 years. I’m simply curious about what the trend looks like since the last big El Niño event in 1998 now that we are in a La Niña. Of course this may upset some folks, and I’ll probably get the usual invective hurled at me and furious scribblings on other blogs refuting this as “He’s doing it wrong”, but I think looking at what has happened globally between a large a large El Niño and La Niña is both interesting and useful.
To do this, I used the same global temperature anomaly datasets that I’ve used for the last few posts I made on the subject of global temperature anomalies. I created a new file, using all four global metrics, with only the last 10 years of data, which you can inspect here: 4metrics_temp_anomalies_1998-20081.txt
Here are the four charts of global temperature anomalies, note that there are links to each original organizations data source below each graph. Click each image to get a full sized one.
University of Alabama, Huntsville (UAH) Dr. John Christy:

Reference: UAH lower troposphere data
UAH shows a slightly positive anomaly trend of 0.028°C for the last ten years.
Remote Sensing Systems of Santa Rosa, CA (RSS):

Reference: RSS data here (RSS Data Version 3.1)
RSS shows a slight negative anomaly trend of -0.01°C for the 10 year period. This may have to do with the fact that RSS reported an anomaly for January 2008 that was twice the size than what UAH reported (-0.08 for RSS, -0.044 for UAH) owing to a different methodology of the satellite data preparation.
UK’s Hadley Climate Research Unit Temperature anomaly (HadCRUT) Dr. Phil Jones:

Reference: above data is HadCRUT3 column 2 which can be found here
description of the HadCRUT3 data file columns is here
The HadCRUT land-ocean global anomaly data shows a slight trend of 0.017°C for the last ten years. Surprisingly, it is lower than the trend of 0.028°C for the UAH satellite data.
NASA Goddard Institute for Space Studies (GISS) Dr. James Hansen:

Reference: GISS dataset temperature index data
And finally we have the NASA GISS land-ocean anomaly data showing a ten year trend of 0.151°C, which is about 5 times larger than the largest of the three metrics above, which is UAH at 0.028°C /ten years.
Given some of the recent issues Steve McIntyre has brought up with missing data at NASA GISS, it also makes me wonder if the GISS dataset is as globally representative as the other three.
UPDATE: The answer as to why the GISS data diverges so much may be found in the 2005 summary on the GISTEMP website, (h/t Barry H.) Here is a relevant excerpt:
Our analysis differs from others by including estimated temperatures up to 1200 km from the nearest measurement station (7). The resulting spatial extrapolations and interpolations are accurate for temperature anomalies at seasonal and longer time scales at middle and high latitudes, where the spatial scale of anomalies is set by Rossby waves (7). Thus we believe that the remarkable Arctic warmth of 2005 is real, and the inclusion of estimated arctic temperatures is the primary reason for our rank of 2005 as the warmest year.
I’m not sure the “remarkable Arctic warmth” is real, especially since the disappearance of arctic sea ice during that time has been linked not to warmer temperatures, but to wind patterns by other researchers at NASA. The sea ice “melt” as proxy for increased arctic temperatures doesn’t seem to be connected. Further, a NASA satellite AVHRR image shows the high latitudes near the south pole getting colder, except in areas where volcanic activity is known to exist.
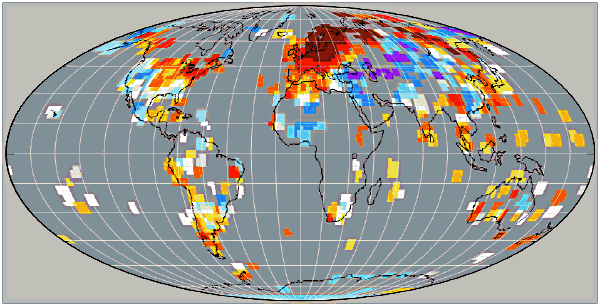
A recent comment from Carl Smith came with an animated graphic showing how that 1200 km spatial extrapolation looks when compared to a 250 km block, which is also used in GISS analysis. Carl writes “Bear in mind that the data in a 250km ‘block’ is in many cases from a single station, especially in remote areas, so is really just a minuscule dot on the map. Note how little real polar region data there is in the 250 km map, whereas in the 1200 km map the polar regions appear to be well covered.”
As a creator and purveyor of meteorological measurement technology I have never been a fan of “extrapolated” data. It is not a confidence builder to know that data for something so important has been either extrapolated or estimated, especially when there are so few stations in the high latitudes, as evidenced by the Historical Station Distribution study by John Goetz.
By treating the NASA GISS data as being an outlier due to that data confidence difference, and by taking a “3 out of 4 approach” in looking at the plotted trends, one could conclude that there has not been much of a trend in global temperature anomalies in the past ten years.
It seems to me as if a 30 year mean is as arbitrary as anything else in Climate Science, and in our particular case creates an illusion that something is “wrong” becuase the starting point was cooler than the ending point. If they went with an 80m year mean then there wouldn’t be any cause for concern, except when the past gets all “adjusted” for no apparent reason.
You will also notice that GISS and NOAA are very close. This makes sense as GISS uses a homogenized version of NOAA. (The giveaway fingerprint is 2005 spiking higher than 1998.)
Notice also how the ground measures diverge from the satellite measures in that both ground measures have the current temp as the lowest in the series while the satellites both rate Jan. 2000 as cooler.
This would tend to confirm the heat sink theory that when there is a warming trend (as 2005), Heat Sink Effect seems to accelerate the trend, and when it cools, HSE exaggerates the cooling trend (as 2008) as the effect “undoes” itself.
It is important to point out that a heat sink adds a direct warming offset offset, and when a cooling trend occurs, HSE exaggerates it, but STILL RETAINS a piece of the initial warming offset. The exaggerated cooling effect will will never extend past the initial warming offset. (They would not “equal out” until abosolute zero.)
Look at the metrics from 1978 to 1992 UAH, .025C per decade. So short of the magic GISS global warming consists of eight years of warming between 1992 and about 2000. Really not even a decade, hardly worth crippling and economic system for?
Interesting post, thanks. It looks to me as if the GISS anomaly was lower than the others in 1998, compared to the following years within each of the 4 measures. GISS is the only one, for instance, where the peak of the first 6 months is lower than the peak around month 50. The lower 1998 anomaly would push their 10-yr trend up, relative to the others.
I created a quick chart with trend lines.
http://www.flickr.com/photos/7672614@N05/2319280978/
REPLY: Thanks Jim. Everybody this is worth a look.
Jeff: “It seems to me as if a 30 year mean is as arbitrary as anything else in Climate Science”
It’s a very common baseline and has been used for a very long time. It very well may be arbitrary but not more so than the 95% rule used in a lot of statistical studies — you have to start somewhere. OTOH, there may be a genuine physical basis for using it. In any case, it’s a widely used practice. The question of ‘why’ should be asked when it’s NOT used.
What Anthony has done here is more than reasonable. Of course, that doesn’t mean his critics will be.
A large part of this seems to be the choice of trendline dates.
What does a graph of “length of trendline” versus “amplitude of trendline” look like?
We know that Jan07-Jan-08 is steeply down. I’d posit that a two-year trendline is less steep. And a three year. And four… to ten. Which is flat. (As above). But what happens as the length of the trendline is 11, or 12, on the way to 30… and past 30.
Is the thirty year trendline the absolute worst? Is it… an outlier.
There is a great deal on this website that I simply do not understand, but I’m having a heck of a time trying to learn. Thanks and if you get a chance to dumb down some of your commentary, please consider doing so. Some of us have a lot of catching up to do.
Just because it’s been used for a very long time doesn’t mean it’s a good metric to go by. And it seems to cause spurious “emergencies”. Looking at longer term metrics shows there is nothing out of the ordinary going on. Things go up and down all the time.
The lower 1998 anomaly would push their 10-yr trend up, relative to the others.
Yes, we seem to have noticed that GISS adjustment methods seem to involve taking NOAA (present-adjusted-up) data and cooling down the past.
To determine this one way or the other, I’d like toi see a side-by-side comparison I’d like to see is a 1900-2000 comparison between GISS and NOAA metadata.
Some of us have a lot of catching up to do.
Amen to that, Thomas. I never took physics in high school or college, and my last statistics class was in 1966.
Stick around, though, ’cause every once in a while someone comes along and translates things into layman’s terms, causing that little cfl (heh) above your head to light up. And another thing you’ll quickly notice about this blog is that we’ve pretty much gotten past questioning each other’s integrity and intelligence.
Now let me be clear that a 10 year trend is not typical for climate analysis. Typically a 30 year mean period is used to establish a climate baseline
Anthony, you seem to be confusing the baseline and the trend. They are independent. The baseline is just an average over a time period. The anomaly trend is the change in value over another time period from that average. The trend will be the same irrespective of the baseline.
In fact, you will get the same trend using absolute values rather than anomalies. The steepness of the trend may be different, but that’s just a function of the scaling of the y axis.
REPLY: I could have worded that better, I’ll rewrite it to make a bit more sense. What I was trying to convey was that a 10 year period is not typically used but that a 30 year period is.
By the way (and apropos trends etc) one of the earlier 4 anomaly posts had a link to the Hadley Atmospheric data (HADAT2) which has readings going back to 1958 for a wide range of altitudes (~1500m to ~24km).
The trend of all the upper atmosphere readings (150hPa / 13.5km and higher) are all clearly down while the lower ones (up to 300hPa / 9km ) are trending up. I’m trying to create a post with the right graphs but its tricky to do. RSS and UAH seem to track quite well with the middle/lower ranges of the series which should not be too great a surprise. Also interesting is that the last 10 year trend is negative for 300hPa and up but flattish for below.
Lee, are you literally suggesting that ONLY GISS contains polar data? NCDC and HadCrut don’t? That seems unlikely to me…
Lee: Your notion “noisy data” is epistemological nonsense. I suggest you dial the attitude back just a wee tad. One finds in life from, time to time, that you’ve brought a knife to a gunfight and it ain’t pretty.
BTW, UAH does seem to have polar data:
http://www.junkscience.com/MSU_Temps/UAHMSUNPol.html
http://www.junkscience.com/MSU_Temps/UAHMSUSPol.html
Lee, I’ll cast a vote for you to take Anthony up on his offer – my impression is that there are lots of stats novices on this site who are enthusiastic about learning. If you have the time and inclination, even a post showing just: (1) why sig testing for trends matters, vs. eyeballing a graph; (2) the enormous difference in size of confidence intervals for 10-yr and 30-yr trends, and perhaps a longer trend just for comparison; and (3) icing on the cake could be showing the very different impacts that extreme values have on short vs. long trends (here I’m thinking of the impact of 1998…). But as Anthony says, be nice – it’s continuing ed, not a grad seminar. I know I’m making this sound like less work than it would really take, but I hope you have the time and inclination, and I appreciate your posts.
Lee, given data such as this:
http://climate.gi.alaska.edu/ClimTrends/Change/7707Change.html
it looks more like one site in Alaska, Barrow, needs a site survey.
Extrapolating from this I would guess, and yes this is a guess, maybe 3 sites in Canada, two in Greenland and a handful in China and Siberia are what account your “arctic is warming faster” data. Have these been checked for microsite issues?
I seem to remember Raven and Steven Mosher on an earlier thread discussing GISS Arctic input and the last assertion on the issue (Mosher’s) was that the Arctic input was interpolated, his word ‘estimated’.
We know that their grids are, well, enormous, up to 1250km^2, if I recall at all accurately.
I suspect there’s less here than advertised.
The arctic above 82.5 N is rather less than 0.5% of the surface of the globe. I am not sure why including that in the measurement should make all that much difference to the global average anomaly.
REPLY: Thanks, I was getting to that next.
This is all good stuff. It will take a couple of years of the same before the public gets wind of the FACT that “the globe isn’t, actually, ‘warming'”.
In the meantime, when I meet a believer, I avoid the detailed discussion of observations, which they are mostly incapable of, and go for the jugular:
“Clearly you think the planet is too hot. How cold do you want it?”.
UAH satellite data for the poles is collected, but not used for the gridded global analyses. It’s available and used for other purposes, though – if anyone’s interested and near a library, a couple of interesting examples of the UAH polar data at work are:
Johanson, CM & Fu, Q, Antarctic atmospheric temperature trend patterns from satellite observations, Geophysical Research Letters, 34 (12): Art. No. L12703 JUN 19 2007, and
Swanson, RE, Evidence of possible sea-ice influence on Microwave Sounding Unit tropospheric temperature trends in polar regions, Geophysical Research Letters, 30 (20): Art. No. 2040 OCT 22 2003.
As a bit of a side issue, these papers also illustrate that the satellite data can be subject to adjustments and biases, and their readings are refined over time, just as the GISS/HadCRU products are.
Anthony, you’re doing great work and with a positive attitude.
The people who toss invective at you just cement their position as being more and more irrelevant to the conversation.
Hmmm, based on his posts, I think Lee had plenty of time this afternoon to do his own analysis. If it’s important enough to add post after post…….
btw, has Lee offered any apology for his ‘over the top’ stuff from earlier in the week?
REPLY: I don’t know what “over the top” stuff you are referring to. But it is of no consequence.
“Clearly you think the planet is too hot. How cold do you want it?”.
Most excellent!