The HockeySchtick writes: A paper published today in the Journal of Atmospheric and Solar-Terrestrial Physics finds another potential solar amplification mechanism mediated by galactic cosmic rays [GCRs] (and distinct from Svensmark’s cosmic ray theory of climate). The author demonstrates:
- Solar modulation of GCR [Galactic Cosmic Rays] is translated down to the Earth climate.
- The mediator of solar influence are energetic particles.
- GCR impacts the O3 [ozone] budget in the lower stratosphere.
- O3 influences the temperature and humidity near tropopause, and greenhouse effect.
- Effectiveness of this mechanism depends on geomagnetic field intensity.
The paper adds to over 100 potential solar amplification mechanisms described in the literature.
As to the false belief that solar activity does not correlate to global temperatures, the sunspot ‘integral’, the accumulated mean sunspot activity, and Fourier analysis all demonstrate this belief to be false, there is a good correlation:

The paper: https://www.sciencedirect.com/science/article/pii/S1364682615300316
Bi-decadal solar influence on climate, mediated by near tropopause ozone
N.A. Kilifarska
Abstract
The Sun’s contribution to climate variations was highly questioned recently. In this paper we show that bi-decadal variability of solar magnetic field, modulating the intensity of galactic cosmic ray (GCR) at the outer boundary of heliosphere, could be easily tracked down to the Earth’s surface. The mediator of this influence is the lower stratospheric ozone, while the mechanism of signal translation consists of: (i) GCR impact on the lower stratospheric ozone balance; (ii) modulation of temperature and humidity near the tropopause by the ozone variations; (iii) increase or decrease of the greenhouse effect, depending on the sign of the humidity changes. The efficiency of such a mechanism depends critically on the level of maximum secondary ionisation created by GCR (i.e. the Pfotzer maximum) − determined in turn by heterogeneous Earth’s magnetic field. Thus, the positioning of the Pfotzer max in the driest lowermost stratosphere favours autocatalytic ozone production in the extra-tropical Northern Hemisphere (NH), while in the SH − no suitable conditions for activation of this mechanism exist. Consequently, the geomagnetic modulation of precipitating energetic particles – heterogeneously distributed over the globe – is imprinted on the relation between ozone and humidity in the lower stratosphere (LS). The applied test for causality reveals that during the examined period 1957–2012 there are two main centers of action in the winter NH, with tight and almost stationary ozone control on the near tropopause humidity. Being indirectly influenced by the solar protons, the variability of the SH lower stratospheric ozone, however, is much weaker. As a consequence, the causality test detects that the ozone dominates in the interplay with ULTS humidity only in the summer extra-tropics.
Nice of you to define NH as northern hemisphere and GCR as galactic cosmic rays for us, so why do you leave us in the dark on ULTS?
ultra liberal transsexuals..
Upper troposphere, lower stratosphere would make more sense. Can’t access paper
Copy of paper accessible at http://sci-hub.tw/10.1016/j.jastp.2015.08.005
Thanks.
Reading it reinforces my conclusion that the author meant upper troposphere and lower stratosphere.
Bulgarian version might clear things up.
That’s a quote of the paper’s abstract. Complain to the authors.
ULTs are ultra-low temperature freezers. Maybe ULTS is an ultra-low temperature sensor. I’m just guessing.
Jim
Googling says UTLS means upper-troposphere–lower-stratosphere. I think there may be a typo.
He’s Bulgarian, so English is likely difficult.
I’m NOT Bulgarian, and when typing I frequently tranpsose lettres.
Ten out of two people do that.
So they followed this whole GCR thing right down to the earth’s surface through mediators, and influences, and suchlike but no mention of any understood physical processes.
I don’t discount the possibility of GCRs affecting climate in some way, and therefore solar magnetic fields influencing that. But this abstract reads like a lot of hand waving, and not much connected physical interactions.
Does the GCR flux raise the ozone by forming atomic Oxygen, or does it destroy ozone, or does it do both from time to time ??
Earth’s magnetic field can channel charged particles, generally towards the magnetic poles, which are in colder regions, but that would seem to affect lower energy solar charged particles than very high energy GCRs which would require a lot more steering. Well I suspect that the GCR primaries create showers of other lower energy critters that earth’s field could channel.
But as I said; this reads like a lot of hand waving, with a shortage of mechanisms.
G
George:
Agreed.
Especially when this team is using the adjusted, i.e. past cooled, present warmed, temperature anomalies.
Any claimed correlation falls apart when fudged numbers are claimed to correlate.
Besides, failing to explain how a poor global representative derived/smudged global average temperature series source is fit science for use other than to compare to anything but other manipulated numbers.
Hand waving is a great description of their process and writing.
“Logic” is a bunch of hand-waving with no physical processes too… You going to need study data and peer-reviewed papers that have been published for that as well?
You mean rather like the theory that postulates that CO2 is the driver of climate?
In general, I agree with those who think it is high time for climate science to get off it’s correlational butt, and start to test more actual, physical causal hypotheses.
That said, I can imagine some mechanisms, most of which have to do with indirect effects of albedo changes due to water vapor and attendant cloud formation, leading to relatively less or more incoming energy in the visible spectrum. But effects due to variability of incoming UV energy due to ozone variability in these high layers may be more important than “they” previously estimated. If ozone intercepts relatively more or less high-energy ultraviolet high up in the atmosphere, never letting it penetrate to the surface, that might contribute to natural cooling and warming cycles, too, mightn’t it?
So what does logic have to do with it ? Logic is a philosophical process. Nothing to do with the truth or falsity of scientific facts.
They claimed : “””””….. could be easily tracked down to the Earth’s surface. …..”””””
Yet they describe no physical processes that get anything from outer space to the condensed phase surfaces of the earth.
Perhaps a more accurate description of their description would be …. mumbo-jumbo ….
G
The HockeySchtick writes:
http://hockeyschtick.blogspot.com/2017/09/new-insights-on-physical-nature-of.html
This theory is pretty clear. It ought to be possible to construct an experiment to measure it in action.
All these variables have different integration times, so from system theory their effects on system output (GMST) vary. We really do not know what variability there is in the local interstellar space GCR flux. We only measure it after the effects of the heliosphere has perturbed/displaced it. The Voyagers probes are beyond the Heliopause, but until we have good probes in the nearby interstellar space, we do not know if the GCR flux varies as the solar system moves with/through the galaxy.
The plot shown is basically 160 years of data to get a correlation. On shorter intervals of 30 years, the shown correlation is weak to non-existent.
The wiggles match. Except when they don’t
It probably doesn’t get any easier when the global warmers are busy continually adjusting the historical temperature record to whatever number suits them today. One wonders what the point is of even trying to do research in these areas when results can suddenly be rendered wrong at the political whim of some activist in a quasi-related discipline somewhere else.
Always be suspicious of almost perfect correlations with the heavily ‘adjusted’ temperature record…
Although the paper highlights a temperature correlation with GMST(Global Mean Surface Temperature) there are many more potential effects, such as ozone concentration changes, molecular oxygen, etc.
This paper is just highlighting one major correlation, which is better than the CO2 correlation, despite the lack of strong correlation at short intervals. Wiggle room, so to speak. The use of an adjusted temperature record doesn’t help, and hopefully is mentioned in the paper.
Theoretically, we should be able to get an estimate of the flux using measurements from DSCOVR probe at L1 vs measurements taken at other places on Earth at the same time.
Granted, it is still affected by the heliosphere but simultaneous measurements should allow us to factor out much of the heliosphere’s effects.
Let’s hear your test experiment since the processes are described so succinctly from your point of view.
G
The real test of any theory. Can it predict anything?
“””””…..
Logoswrench
December 12, 2017 at 7:13 am
The real test of any theory. Can it predict anything? …..”””””
Well actually, all that a theory needs to do is explain (postdict if you will) already known observational facts. If within the rules of that theory, it describes other phenomena that have not yet been observed; then a search for such phenomena experimentally, would further fortify that theory, or provide a fatal counter observation.
So prediction of new observational results is not necessary; but proper explanation of known observations is.
G
“The Sun’s contribution to climate variations was highly questioned recently.”
Not surprising since those that question this also think that ‘feedback’ magically supplies more energy to the surface than the Sun. Measurements show that each W/m^2 of forcing from the Sun results in about 0.6 W/m^2 of ‘feedback’ making the surface a little warmer than it would be from the Sun alone. The broken consensus clings to the false hope that feedback from the next 1 W/m^2 of forcing contributes 3.3 W/m^2 which combined with the forcing becomes the 4.3 W/m^2 required to offset the emissions increase from a 0.8C nominal surface temperature increase.
… and then they’ve got their 8.5 W/sm fantasy (RCP 8.5). Throw in model tuning for more fantasy-bias.
When are the mainstream physicists of all specialties going to call “Bull-shit” on this climate joke by climateers that endangers all of science credibility?
The APS leadership has been taken over by the alarmist rent-seekers. So what group of physicists will rise up against the climate hustle? Not clear to me.
To see the folly of model tuning, all you need to do is look at their code. For example, the file called RADIATION.f in the GISS ModelE has many, many hundreds of arbitrary floating point numbers baked into the code with little to no documentation supporting their values. These baked in constants codify assumptions about GHG absorption, solar variability, aerosols, atmospheric profiles and most of what matters. It’s inconceivable that there can be any certainty in the produced results.
The code itself is so far from production worthy, anyone with real world coding experience and charged with turning the GISS GCM into a product would throw it in the trash and start over.
frickin’ f. files!! FORTRAN!!! really? That’s old school stuff. I learned and forgot FORTRAN a lifetime ago.
Beautifully put. The word ‘scientist’ is in danger of descending to the level of ‘snake oil seller’. The vast majority of good’uns need to dissociate themselves from the global warming fraudsters.
If you did any research you would know that Fortran is only about 15 years older than C and Fortran development is still ongoing (Fortran 2018). Fortran is not “old school stuff”, it’s more ‘mature’ and still a viable language to do programming with. Your choosing to forget it was not Fortran’s fault 😉
Note that fortran is still dominant in the scientific community. https://arstechnica.com/science/2014/05/scientific-computings-future-can-any-coding-language-top-a-1950s-behemoth/
Perhaps Congress could pass a law requiring all government computer modeling be done using ADA or Rust. At least then the mistakes would be easier to find.
Fortran isn’t a problem, even if it is an obsolete programming language. On the other hand, “…many hundreds of arbitrary floating point numbers baked into the code with little to no documentation supporting their values” is strong grounds to regard the code with great suspicion.
JKrob,
A modern language would be something like C++ or Java where object oriented programming makes the code base more readable, more extendible and more supportable.
The Fortran they were using for the version used in AR4 was barely F77 and still used older F66 coding styles. The newer version for AR5 seems to be partially converted into F90.
It is not teh language as such that makes the code readable or not, but [as you point out] i is the coding style that matters. You can code in Fortran IV style in any language, even C++ and Java.
And a modern language is a dog compared to decades of hand tweaked and assembler code, it’s meant to run fast.
micro6500,
Assembly code and microcode have their place, but modern computers are so fast now and modern compilers are so good, that hand tweaked assembly code isn’t as much of a benefit as it used to be. It’s also non portable, hard to maintain and hard to enhance. If you want modern fast, go highly threaded code on multi core CPU’s or GPU’s or you can use massively parallel methods like mapreduce.
They are running on the biggest computers in the world, and still can not run at the required resolution. Your modern compilers are still way to slow. It’s why is all still written in fortran, full of hand tweaked code.
micro6500,
Many years ago I did some performance comparisons between Fortran and C and the C code was generally faster and easier to read, largely because Fortran doesn’t have pointers or structures. As a result I migrated from writing in Fortran to writing in C.
More recently I did comparisons between compiled Java and C++ and while the Java was slower, the difference was less than I expected. As a result, most of my recent code has been in Java, although I still have a significant amount of F77, C and C++ in my code base.
The Fortran code of ModelE is definitely not hand tweaked for performance. I would call it hand twisted code that started life as classic F60 spaghetti code and that’s been extended and enhanced in an ad hoc manner. Another thing missing from the code base is robust regression testing. Most likely because when you tweak one of baked in constants or add some special case code, the new results become so different from the last version, regression testing won’t tell you anything. Another shortcoming is that because of all the baked in ’empirical’ constants, it’s not possible to apply it to a different system, for example, a hypothetical water world or a world like the Moon, Mars or Venus, each of which is easier to model than the Earth and which would make reasonable regression targets.
It’s still written in Fortran because NASA was slow to modernize and was still committed to F60 when the original version of this model was written and not because Fortran a better choice as a modelling language.
BTW, when I hand tweak C, C++ or Java, there are a lot more ways to improve the performance than are available with Fortran and the resulting code tends to be more comprehensible.
My understanding is on machines like crays, they go into the compilers and replace function modules with hand coded assembler when they run the Fortran compiler.
Low level code like memcpy() is still widely implemented in assembly code. Things like interrupt dispatch tables and code that needs special purpose instructions like the atomic test and set used for thread synchronization must be written in assembly code. Complex algorithms are more problematic to implement in assembly code and not much is gained, moreover; my laptop can outrun a Cray 1 or a Cray XMP and in many cases can even outrun a Cray 2.
One reason hand tweaking isn’t as powerful as it used to be is that most data intensive code like simulators are limited by main memory accesses and there are so many slots available for arithmetic between memory reads and writes a lot of code will fit before an app becomes code limited.
An iPhone4S was a lot faster than a Cray 1. BTW they don’t make Cray 1’s or iPhone4S’s anymore.
Yes, and most of today’s supercomputers are just big networks of x86 machines running some form of Unix. For example, Google’s Borg infrastructure comprises one of the biggest, if not the biggest, supercomputer in the world and is built from millions of X86 cores running a version of Ubuntu Linux.
I got to see part of the Redstorm upgrade, about a basketball court full of 7′ computer racks. I think it was about a quarter of the complete system.
Whether they commercialized it or not they had some other exotic tech in development then as well.
I was just in Nagoya for a solar workshop. An author presented a simulation of the Sun’s convection running on a million CPUs at a cost of electricity of US$ 25,000 per hour.
That’s where decreasing a function that’s run a millions times per hour, on a million cpu’s by a couple clocks makes a difference.
generally faster and easier to read, largely because Fortran doesn’t have pointers or structures
Pointers are generally a bad idea, and impairs readability as well. Java, for instance, does have them.
lsvalgaard,
Yes, Java, like Fortran doesn’t provide a way to manipulate pointers from the semantics of the language in the same way you can in C or C++. Pointers can certainly be misused, but their proper use doesn’t disrupt the readability of well designed code. Java and other object oriented languages offer semantics that can preclude the need for using explicit pointers in many cases.
The problem is that most code is not well-designed…
That makes C unsafe [memory leaks, dangling pointers, pointer arithmetic, etc.]
Yes, I agree that most code is not well designed and the GISS ModelE GCM is a good example. That it’s written in Fortran doesn’t make it any better …
There are tools available to catch things like memory leaks, but these are also easily addressed by methodology. Modern compilers are also pretty good at catching a lot of issues, as long as you have all of the warnings enabled. Of course, the sloppier the code is, the more warnings tend to be turned off …
What I like the most about C and C++ over Java is complete control over the layout of data in memory. What I like about Java over C++ is it’s object semantics, syntax and intrinsic portability.
The ability to write computer code, conveys with it the ability to get the computer to do what you asked it to do.
That has nothing whatsoever to do with the ability to solve some actual problem.
A very short time studying traffic light patterns is enough to demonstrate that problem solving is distinct from computer coding.
G
Paper is two years old.
And?
And it has been cited just once, by persons other than the author.
The post says “study published today”.
As is the HockeySchtick article.
Is that a measure of science Nick.
And your point is? You seem to lack any substantive reason other than the age of the article as to why/if there’s a problem with it. You offered nothing but a drive by disparagement.
“You seem to lack any substantive reason “
Have you read the paper? Has anyone? It seems to be fiercely paywalled.
There is nothing wrong with being two years old. But if in that time it has been cited just once, that is a clue. And it seems to be the best clue we have.
Here it is
http://www.leif.org/EOS/2015-Kalifarska-Bi-Decadal-Solar-Climate.pdf
But not really worth to spend too much time on…
So is it better or worse than using Newtons law of cooling on radiative transfer Nick, perhaps you could cite the references for your belief 🙂
I think there is a bit of science ignorance on all sides here. Nick currently as you don’t understand radiative transfer at all I don’t think you are in any position to judge anything. I think both sides need to do some studying.
There are mechanisms for O3 to work via we see that on Mars which you could read about. The mars mechanisms are thought not to operate on Earth. However it would be worthwhile to check studies to exclude such effects, I don’t play in this field so don’t know either way.
The late 30’s-early 40’s warmth, and the late 60’s – early 70’s cold is in apparent contradiction to the steadily rising Sunspot Integral from 1930 onward. I speculate that is due to the internal ocean cycle phases (AMO/PDO) modulating the HadCRU3 temperature record on their respective 60-65 yr cycles as the Sunspot integral steadily rises after the Dalton Minimum passes.
It would be interesting to have a combined-Ocean cycle index + Sunspot Integral plot over the 20th-Centruy to present.
And I’ve said this before on two other recent threads:
The recent Sept-Oct 2017 UAH and RSS TLT anomaly divergence from the surface data sets anomaly I conjecture was due to the 1-11 September 2017 solar magnetic activity spikes. F10.7 and Ap indices went to rapid high values during that time, but too short a time to influence the oceans which is why the surface data sets (dominated by SST readings) didn’t note an uptick in their anomaly. My conjecture focuses on ozone in the LS, an increased production leading to enhanced lower stratosphere heating and the effect on the Tropopause.
This paper on solar activity-related GCR driving O3 enhancement in the LS and the effects passed down to the Troposphere and troposphere via humidity effects further supports that conjecture.
not solar activity-related GCR, but solar activity EUV driving O3 enhancement. After that, the warming Lower Stratosphere in the NH during late summer (when the humidity values are highest) provides the most Lower troposphere T enhancement.
Maybe even a boost-strap kick to NH tropical cyclone development intensification (Irma to Maria) via a lower tropopause?
Cosmic ray theory breaks down, as CO2 theory does, with no instant influence seen in practice.
 ?dl=0
?dl=0
 ?dl=0
?dl=0
Cosmic ray theory can’t be a viable solar climate theory imo.
I agree.
GCRflux by itself fails.
TSI and neutron counts are probably 3rd order effects on GMST, i.e. too low to detect from noise/random variability/measurement error.
But solar proton flux and the 75nm-250 nm EUV flux variability are better candidates.
If I turn the burner on under a pot of water, the water doesn’t heat up instantly. I’m not sure why you think there should be an instant influence.
Your last graph doesn’t contradict the one shown in the article. It shows a neutron count of about 6000 +/- 10% (which is relatively constant) vs. a rising temperature. That’s like saying I turned the burner on half way and left it there. You would expect the water to slowly warm up.
Am I missing something?
CommieBob … Good point. Also the cooling of the 1970’s has been removed from HadSST3. There would be more agreement if it had not been.
I agree commieBob, and this is much more complex than a pot of boiling water. People seem to have no understanding of complex oscillators, let alone one as complex as climate. The direction of the overall system rarely reflects the direction of any variable at the moment, especially lower order variables that are considered noise, such as the GCR hypothesis.
turn the burner on under a pot of water, the water doesn’t heat up instantly
Yes it does, at the bottom of the pot where the heat is being applied.
Try it again with just high energy cosmic rays as per Svensmark
So earth’s cloud cover fraction is zero +/-1%, and maybe more like +/- 0.5% RMS. (Fig. 1)
I thought NASANOAA claims that earth’s cloud cover is around 65% ??
G
“the cooling of the 1970’s has been removed from HadSST3” – there was cooling from earlier in the 60’s not shown in that graphic since Oulu data starts in 1964. “They” may still have removed some…
The boiling pot analogy is more appropriate when considering TSI.
Solar energy accumulates in the ocean for months and years when insolation is high from fewer clouds or higher TSI, heat that upwells for some time thereafter, rising into the atmosphere adding to a future day’s solar activity T influence, driving evaporation, creating clouds. A reduction of solar energy from either cloud cover or falling or solar TSI leads to sub-surface cooling, as is happening now since TSI has dropped to near solar minimum levels:

The big thing here is the practical GCR effect on clouds is transient, as clouds last how long? Weeks?
I would expect there to be more clouds at the peak of GCRs, which happens at the solar minimum due to the weaker solar output then; but, the Fig. 7 clouds are at a minimum when GCRs are at maximum in late 2009, during the 2009/10 El Nino, when it was hot, not cool, and clouds peaked a year after CRs peaked.
To believe GCR theory, you’d have to believe the 2009/10 ENSO clouds would’ve had to came from GCRs, not from tropical evaporation.
Yep, now maybe this drives the ocean cycles which could then be a primary cause.
Ah, chicken or the egg problem.. Casualty’s arrow.
I would suggest it is ocean cycles that modulate humidity (thus convection & cloud albedo). Not humidity modulates ocean cycles.
That is mine as well, and I can show how min T follows dew point.
So do tell which way is +/- on the sign of the humidity changes or doesn’t that matter; or do you just not know ??
G
George, i compare dew points to air temps for the weather stations I have. Unfortunately not only are the stations distributed poorly, land masses are distributed unequally between hemispheres, and air temps are sensitive as to whether it is taken over land or water, because they respond differently.
So it seems dew points vary with the oceans, and have a larger impact in the NH, as opposed to the SH.
Full confession. I became an ardent skeptic (was previously totally climate ignorant) after finding NRDC crop BS in 2011. My first guest post here. Facts. But, continue to remain skeptical about the solar mimum stuff. See the unconvincing and non-sttistical curve fitting previously posted here.
Don’t see a basic physics mechanism. Anybody got one beyond curve fitting, please explain in plsin English.
The proposed mechanism seems to be that increased GCR causes increased O3, which is a greenhouse gas, so the tropopause warms, so more water vapor is present, which is a also a greenhouse gas, so the atmosphere warms. It’s not clear why they think the effect is less in the Southern Hemisphere.
Where did you read that increased GCR caused increased ozone ?? I didn’t see where they nailed that down either way.
G
Thanks Thomas. I find that the abstract and much of the commentary cause my eyes to glaze over, but your post makes sense. One thing though, the concentration of atmospheric CO2 per MLO is currently about 400ppm. The concentration of Ozone in the Ozone layer per Wikipedia is about 2-8ppm. https://en.wikipedia.org/wiki/Ozone#Ozone_in_Earth's_atmosphere If Ozone is affecting climate via greenhousing, it would appear to be one heck of a potent GHG.
Don,
Ozone is found in both the troposphere and stratosphere.
The paper is paywalled. I can’t read it.
But there is a mention of solar high energy protons, the kind you would get from high solar magnetic periods. That makes sense. Solar protons and GCR/neutron flux are anti-correlated.
I figure when the hustle is gone, climate science will put Earth’s climate at the centennial time frame and beyond as controlled by Solar/INSOLATION factors (Maunders, Daltons, and Malinkovitch). But (a HUGE Kardashian-style BUTT) Inside 100 years, it IS oceans and atmosphere, and then mostly oceans that control climate. CO2 is a bit player $25 player at a table of $1,000 bettors. CO2 just doesn’t matter to the house in the dollars won/loss column.
Here it is
http://www.leif.org/EOS/2015-Kalifarska-Bi-Decadal-Solar-Climate.pdf
But not really worth to spend too much time on…
Thank you Dr Svaalgard.
A grande Muchos Gracias from Tucson.
I will read with my Tuesday AM coffee.
Joel
@ lsvalgaard
Many thanks. 🙂
Not going to purchase this piece so just have to deal with the abstract. It begins by saying it is all about the sun’s magnetic field modulating GCR’s in the heliosphere and this effect being, “easily tracked down to the Earth’s surface”.
Mmmm, the following notion that some combination of the sun’s magnetic field and GCR’s effect stratospheric ozone is very interesting, particularly since UV ionization does not adequately explain it.
Then, a lot of independent variables are added; tropopause temperature, humidity, the earth’s heterogeneous magnetic field…
What I really don’t get is why solar protons (and presumably electrons in the electrically neutral soar wind), effect the southern hemisphere more than the northern.
Clarifying that the solar wind is not electromagnetic radiation. EM radiation has no mass. The solar wind is a sandblasting of subatomic particles with mass.
“The solar wind is a sandblasting of subatomic particles with mass.”
And I would add, with electrical charge.
Some solar charged particles are at energies where they can be steered by earth’s magnetic field, so they can actually spiral around earth’s field so they tend to get directed towards the (magnetic) poles, which are colder regions, and one of them is full of land and the other is full of water and ice.
I think the North magnetic pole is in Canada somewhere (not sure), but I think the SMP is in the water.
I think this is less of an effect for primary GCRs because they are such high energies, but can create showers of lesser energetic charged particles.
Radio waves launched by lightning strikes can hitch a ride on the earth’s magnetic field, and since the path is dispersive, an original impulse can be spread timewise into a rising or falling frequency shift creating weird ionospheric sound effects. (the squeals are audio frequencies). Whistlers, Howlers, Dawn Chorus, are just some of the recognized patterns. There once was an LP recording of such things. The NZ DSIR used to partner with another station I think in Norway to match bidirectional signals of this type. You only need a sensitive audio amplifier to pick up this stuff.
G
When last seen, the North geomagnetic pole was someplace on Ellesmere Island in Canada’s Arctic Archipelago and was drifting lethargically Westward.
Here it is
http://www.leif.org/EOS/2015-Kalifarska-Bi-Decadal-Solar-Climate.pdf
But not really worth to spend too much time on…
Thanks Leif.
Leif, would it be correct to summarize that TSI is merely a proxy for solar field strength, and the solar wind “extends” the solar field at the same time; but it is really the solar magnetic field that protects the earth from cosmic radiation?
The paper is just referring to [promoting?] earlier papers by the author. Looking at those one finds that they are simple curve-fitting with no physical content. Not impressed, and we don’t advance the skeptic cause by hyping such low-quality papers.
lsvalgaard,
If the author demonstrates a relationship based on empirical data, doesn’t that peak your interest to find an explanation?
No, because is just based on non-linear curve-fitting with many terms. In this way you can fit any data set, so no explanation is necessary.
That would be pique your interest.
Clyde, as the saying goes. ‘there is never any one as blind as the one who doesn’t want to see’.
That fourth order curve fitting lit my “incoming” siren.
Why try fitting a fourth order polynomial, unless you have some fourth order physical effect you would like to match it up with ??
G
I am curious – whenever someone suggests that CO2 is a greenhouse gas and thus increasing CO2 levels cause an increase in temperature this blog is full of people denying the existence of the greenhouse gas. But when it is suggested that cosmic rays modulate the greenhouse effect then the same bloggers are strangely silent.
Yes, we could do with a bit less echoing.
People here don’t deny that CO2 is a greenhouse gas.
What is said is there is no evidence of a runaway greenhouse effect in Earth’s history, even when CO2 levels were much higher than today, so there must be negative feedbacks/low ECS which prevent a runaway greenhouse caused by CO2.
The reason was simply that the sun was outputting a lot less energy several hundred million
years ago. Try looking at the “faint young sun paradox” page on wikipedia.
And there are loads of comments on this blog that flat out deny the existence of the greenhouse effect.
“And there are loads of comments on this blog that flat out deny the existence of the greenhouse effect.”
Its just mis-named, is all.
Should be called the gravity-thermal effect.
The so-called radiative greenhouse effect has not been measured anywhere, it is a myth.
Certainly NOTHING to do with how a greenhouse functions.
There is no paper showing empirically that CO2 causes warming in our convectively controlled atmosphere.
Germonio claims the reason the planet was cold with a higher CO2 was due to the faint sun. However, that silly excuse fails to explain why the it was warmer both before and after the Ordovician ice age with almost identical CO2 levels.
The fact Germonio uses this long refuted excuse demonstrates quite clearly his unscientific views.
Germonio
December 11, 2017 at 9:03 pm
For every 110 million years back in time you go, the sun grew one percent less powerful. Thus, during the Ordovician Ice Age 440 Ma, it was 96% as potent as today, yet the world froze under CO2 levels of 4400 ppm or higher, ie 11 times now.
The greenhouse effect should really be called the ocean effect. Without the ocean, the planet would be far too hot during the day and far too cold at night for life to exist. The planet would be about 30 c colder, but the warming from a low at night would be hundreds of degrees C during each day.
Germinio,
Cosmic rays may have a perceptible effect, but I suspect it has more to do with cloud formation and less to do with modulating the GHG effect. Ozone is a very minor contributor to the GHG effect and it’s unlikely that it would change by enough such that the effects would be visible in the surface temperature data. Moreover; the temperature of the stratosphere has little, if any, influence on the temperature of the surface.
I don’t see people here ‘den ying the existence of the greenhouse gas’ as you claim.
Those like me understand that the GHG effect is finite and dependent on concentrations and that doubling CO2 could be EQUIVALENT to 3.7 W/m^2 more post albedo power from the Sun, although I have reasons to think that it may be about half of this. None the less, 3.7 W/m^2 more post albedo solar input would increase the surface temperature by only about 1C which is well below the IPCC’s presumed lower limit of 1.5C.
Some people make claims that there are other effects that completely compensate for changing CO2 concentrations thus increasing CO2 has no perceptible effects. Some claim that this regulates average temperatures, although the most likely possibility are that non linearities in the response apparently oppose changes in the average relationship between the emissions of the surface and the emissions of the planet thus supporting the Sun as the primary determining factor driving surface temperatures. The reason for suspecting this is that the planets temperature varies over a very wide range, while the average relationship between the BB emissions of the surface at its temperature and the emissions of the planet is remarkably constant day, night, fall, winter, spring, summer and from pole to pole.
Very few fail to acknowledge science we know to be true by experiment, theory or both. One of those truths is the GHG effect and another is that CO2 is a GHG. One possible exception is that many on both sides fail to understand that while the Earth is not an ideal black body, a non ideal black body is also called a gray body and that the planet nearly exactly conforms to the behavior of a gray body whose temperature is that of the surface and whose emissivity is about 0.61. This causes many to overlook the T^4 dependence of the surface temperature on emissions and the 1/T^3 dependence of the sensitivity both of which are independent of the equivalent emissivity.
Look at the previous comment by AndyG55 who states that the radiative greenhouse effect “is a myth”.
That would appear to be a clear cut denial of the greenhouse effect. And that is just one of many examples.
Germonio,
As I said, “Very few fail to acknowledge …”
There’s a difference between very few and none. But then again, this site is generally tolerant of all views, even the most extreme from both sides. Luckily, many who get information here have critical thinking skills, moreover; many skeptics have challenged individuals expressing views like this which are not supported by the data or the physics.
You stated that you “don’t see people” denying the existence of greenhouse effects. Which is different from “very few” which you said later on. So I pointed out that the first statement is wrong.
Germonio,
OK. I don’t see MANY people …
BTW, while AndyG55’s hypothesis is clearly not relevant to Earth, it does offer a far better explanation for Venus.
The lapse rate is constant, but what can vary is where it starts from which is always the virtual surface in DIRECT equilibrium with the Sun. This is not the solid surface of the planet for either Earth or Venus.
On Earth, this virtual surface is the top of the oceans and bits of solid surface that poke through where the lapse rate reduces the temperature as you head towards space. On Venus, this surface is the cloud tops in where the lapse rate increases temperatures going towards the solid surface below. It’s important to recognize that the radiative GHG effect does matter between the Venusian cloud tops and space, thus influencing their temperature and exhibiting a lapse rate that decreases temperatures going towards space.
Hi co2,
the gravitational hypothesis is nonsense. Gravity is a conservative force and hence cannot heat
anything. There would be some warming effect from when the planets first formed but all of that heat
would have radiated away millions of years ago. Kelvin did that calculation in the early 1900s before the
discovery of radiation and claimed that the earth was only a few million years old.
Germonio,
In the case of Venus, gravity isn’t heating anything. Gravity only establishes the required temperature gradient between the clouds and the surface. The energy is coming from the clouds and just accumulates in the atmosphere until the required temperature gradient dictated by the PVT profile of the atmosphere is met. Note that relative to the surface this just means a small equivalent emissivity, but the T^4 relationship is still there.
In principle, the Earth isn’t much different where the atmosphere accumulates energy until the requirements of radiative physics acting between the surface and space are met where one of these requirements is to adhere to the SB Law.
BTW, how do you explain the atmospheric temperature profile of a gas giant?
Lol, Do you want a chance to reframe this answer? I suspect you’re really smarter than this.
Germonio, you are once again showing a lack of understanding. I didn’t see AndyG55 saying radiation is not absorbed within the atmosphere. He simply stated there’s no evidence CO2 is providing any warming. Once again you demonstrate poor reading skills.
The reason we are 33 C warmer is the existence of a lapse rate due to the gravitation field. GHGs (again mainly water vapor) allow the absorption of more energy into the atmosphere which increases kinetic energy.
What I see is gases like CO2 do absorb radiation but the overall effect is swamped by water vapor which adjusts to balance the effect of other radiation active gases. When CO2 DWIR goes up, water vapor DWIR goes down. This was originally observed by Miskolczi in balloon data from 1948 to present and again shown in Gero/Turner 2012.
And I found it again a year ago. You can see it working in this simple graph.
“The reason we are 33 C warmer …”
The planet is actually only 17C warmer then it would be without GHG’s since without GHG’s there would also be no clouds or ice and the albedo would only be 0.1, rather than 0.3.
You can’t get that 33C of warming without the corresponding 16C of cooling due to increased albedo.
The lapse rate is a function of gravity and the atmosphere simply absorbs and redistributes energy until the required lapse rate is met, but in no way shape or form does the lapse rate dictate what the surface temperature must be.
What you leave out is the water cycle does work, and on Earth, part of that work is limiting cooling at the surface, while sacrificing energy to space to do so. Sort of a heat pump.
Yes it does only have the energy of earth to work with and if you could measure all of the atm, it wouldn’t change much I don’t think internally.
But we can’t measure the entire atm all at once, and heat is not equally accumulated, nor does it stay in one place.
I think the lapse rate plays a big role in the conversion of water vapor into sensible heat at night.
Sure, the lapse rate has an effect on the dynamics of the atmosphere, but it has no significant influence on what the net effect of those dynamics must be, at least relative to the average surface temperature and the planets average emissions.
The water cycle certainly moderates the difference between day and night temperatures, but the dynamics of distributing heat between night and day plays no significant role in what the average between day and night must be. Without it, daytime highs would be higher and night time lows would be lower, but the average would be much the same.
The range has been fairly consistent.

And I think if we could quantify the energy content difference between min T and Dew Point, that would be the energy needed to prop up temps.
And you can see the difference in range between deserts and the tropics. Deserts lose half of the average 35kJ/m^3 enthalp over night, Tropics lose ~9kJ/m^3 out of their 73kJ/m^3, at the surface. The tropics just has more water vapor to work with before it affect the surface.
I have also noticed ~0.8psi drop over night on otherwise calm skies.
“There is no paper showing empirically that CO2 causes warming in our convectively controlled atmosphere”
Why are refusing to give some evidence for the MYTH?
Put up……………….. or not.
The gravity thermal effect is very evident on all planets where the pressure is > 0.1 bar.
Get over it.
Why would you think that earth would be colder with NO greenhouse gases in the atmosphere ??
The surface insolation would be closer to 1300W/m^2 than the present 1,000 W/m^2.
That would be the Mother of all forcings !
Peter Humbug ran a computer model on his X-box, removing every last water molecule from the atmosphere, and then turning the laws of Physics loose again.
He got all the atmospheric water back in about three months. I’m surprised it took so long.
G
George,
Without GHG’s (which also means no water, clouds or ice), the albedo would be the same as the Moon at 0.1 and the average input power would be 307 W/m^2 corresponding to an average temperature of about 271K. This a little colder than the current average of about 288K that arises from 240 W/m^2 of direct solar input and 140 W/m^2 of old surface energy being returned to the surface by the GHG’s and clouds in the atmosphere.
Germinio
December 11, 2017 at 7:10 pm: Because, Germi, we gh ‘derners’ take our Physics seriously compared to you, and watch to learn….
According to the measuring station in Hawaii. CO2 is currently around 0.041% in total. Made up mostly from natural sources and a fraction of this is by man made sources. According to the IPCC the man made portion is changing the climate.The majority of GHG is water vapor at around 97%. The same water vapor you see coming out of the Coal Fired power station cooling towers you see on TV news.
Sorry, not impressed by their graphic …
First, a cumulative sum is not a single thing. It is an entire spectrum of curves, because it requires a parameter which is the zero point. Depending on your choice of a zero point, it can go straight up, straight down, or anywhere inbetween. They’ve used a zero point around 62, which gives it a general upward trend … but that is curve fitting, not a true correlation.
Next, notice that the temperature bottoms out around 1910 and starts upward … but the solar cumsum doesn’t start upwards for another 25 years. That’s a curious kind of causation, one where the effect precedes the cause.
Finally, the temperature peaks around 1945 and drops to about 1975 … while the solar cumsum goes straight up. So if there is a transmission between the sun and the climate … did the sun take the transmission out of gear for that thirty years?
Haven’t read the paper yet, but when I saw the graphic I busted out laughing …
OK, went to look at the paper … paywalled. HOWEVER, it does show thumbnails of their graphics. They have one of the cumsum of the sunspots … but they are using a different zero value than in the graphic above. They are using the mean of the sunspot data as their zero point.
Cumsums are wonderful, you can twist them to fit lots of things. But sadly … that means nothing.
Anyone wants to send me the paper, I’ll take a look … however, I can predict right now that they haven’t included the Bonferroni Correction for the fact that they’ve looked in different places around the planet and only found the purported effect in one of them. They claim that that:
However, this N/S asymmetry only exists during half of the suns heliomagnetic cycle, viz:
Not only that, but the maximum N/S asymmetry is … wait for it … 3%. I’m not seeing how this means their purported mechanism works in the northern hemisphere, but is zero in the southern hemisphere. Everything I read says yes, there is an asymmetry … but nobody but them is saying that the SH is zero at any point in the asymmetry.
I’m not saying that the study is wrong, I haven’t read it. But their use of a cumulative sum of sunspots is worrisome, as is their incantation of the Pfotzer maximum to justify only looking at the NH …
w.
Got the paper, thanks, Leif.
w.
I don’t think the graph is theirs. Looks more like a Hockey-Schtick addition…
Leif,
Read your 2015 paper on climate change. Was seeking in your conclusion anything that might point a finger at which, if any, of the many potential causal variables you discuss that you might feel are the strongest contenders for the top climate change causes over longer periods of time. Not Milankovitch Cycle type long periods nor the shorter volcanic or asteroid collision type periods but the ongoing background variables causing climate variations. Any comments?
From my conclusion:
“Global Warming, or Climate Change, or Climate Disruption, just to mention some of the (increasingly scary) monikers that are being deployed these days have become a divisive political issue, seemingly divorced from scientific discourse. If it were not for the hijacking of the subject by politicians, environmental pressure groups, and plain wishful eco-thinking, one would conclude from the present overview that Climate Science is a vigorous field with healthy debate and exciting interdisciplinary facets rather than a moribund body of ‘Settled Science’ without prospects for further progress, perhaps like Physics at the end of the 19th century. However, science is ultimately a self-correcting process where the scientific community plays a crucial and collective role, so we will eventually get it right, with or without political and societal interference, if the last two millennia are any guide. In the meantime we “may hope to enjoy future ages with more equable and better climates”, Svante Arrhenius [the originator of the GHG theory, 1896].”
As the IPCC concludes:
“No best estimate for equilibrium climate sensitivity can now be given because of a lack of agreement on values across assessed lines of evidence and studies”.
Leif,
Thanks. Was gone all day, just got back. Tried to copy from the pdf file and post your conclusion but my system would not cooperate. Glad you posted it. My interpretation of the IPCC comment that you indicate is “we don’t know”. And that’s ok.
You are up the wrong path, Willis. The paper says nothing about sunspots. Doesn’t even mention the word in its 15 pages. It is about ozone, energetic particles, and specific humidity at the Tropopause.
Sadly, totally characteristic of Willis’ level of “analysis”. Knee-jerk reaction without bothering to read papers with truths inconvenient to his faith-based belief system.
Javier December 12, 2017 at 3:59 am
Gabro December 12, 2017 at 6:54 am Edit
As I said, I was looking at the thumbnails because the paper was paywalled. Get a life. And Gabro, when you start doing actual analyses yourself, I’ll start paying attention to your whining.
w.
Vukevic has shown the correlation with earth’s mag field I believe. Interesting, but the ‘engines’ of ocean currents and Hadley cell links are logically the biggest effect.
The expansion of the Hadley Cell has supposedly intensified the subtropical ridge over southern Australia, with the lack of typical winter rains, but the STR collapsed in late July as the Southern Annular Mode (SAM) flipped to negative.
Its a sign that regional cooling has begun, as evidenced by ‘blocking highs’.
You may find Dan Pangburn’s temperature model of interest.
http://globalclimatedrivers2.blogspot.ca/
See Figure 11.
Dan has built a simple Earth-temperature (climate?) model that has two significant input variables:
– solar intensity (actually the integral thereof, which makes sense) and
– a ~60-year sawtooth (~PDO?)
Normally I would redo Dan’s model from scratch but I have no time.
I suggest others should examine it – it is simple and sensible and does not require any fudging of data.
I note that Dan’s model predicts imminent global cooling. This agrees with my (our) own opinion, which we first published in 2002. We now expect natural global cooling to be evident after the current El Nino runs its course, by 2020 or probably sooner.
Regards, Allan
Yes, the sawtooth is just delayed Solar via warmed waters, but I suggest it’s the sum of the AMO and PDO (of whichever flavor of ocean currents are dominate).
This old article of mine may be relevant here:
http://joannenova.com.au/2015/01/is-the-sun-driving-ozone-and-changing-the-climate/
in which I describe a proposed mechanism in some detail but hedge my bets about actual causation by linking the observed ozone variations to changes in the mix of particles and wavelengths reaching the atmosphere from the sun.
I don’t think it is down to cosmic rays or magnetic fields directly but some of the particles that can affect the ozone balance do follow the magnetic field lines and enter the atmosphere most often above the poles.
To me the most interesting aspect of the article is the lagged correlation between ozone levels at 70 hPa and six years later specific humidity at 150 hPa (lower and near the Tropopause).

Ozone levels respond to solar activity. The article confusedly attributes energetic particles to GCR, but then talks about solar protons. Most energetic particles arrive with the solar wind and accumulate at the polar thermosphere and mesosphere, where very reactive NOₓ and HOₓ chemical species are created. During the winter, when no ozone is created over the poles, these chemical species can travel down to the stratosphere, specially when a strong stratospheric polar vortex is present, and destroy ozone efficiently. Changes in ozone then affect water vapor content and surface pressure.
There are at least four pathways by which solar variability can affect climate. All of them are based on observations, and two of them can be reproduced from climate reanalysis and modeling. They are the Top-down mechanism, where UV changes affect ozone levels and through interaction with the Quasi Biennial Oscillation determine the strength of the northern winter polar vortex affecting northern winter weather over Eurasia and North America. The bottom-up mechanism acts primarily on the tropical Pacific ocean over sea surface temperatures, humidity changes and cloud cover. It affects the latitudinal extension of the Hadley cells and thus the tropicalization of middle latitudes. Less studied mechanisms act at the poles although some authors find they could also affect high latitudes. One is the energetic particle rain associated to solar wind through chemical alterations at the upper atmosphere. It is the mechanism this article deals with. The other is due to changes in the magnetic field at the poles associated to the solar wind, that effect changes in surface pressure.
All of them have been measured repeatedly. What is not known is how much they affect weather and thus over a long period climate. Paleoclimatology says the effect is very big for long periods of above average or below average solar activity (for example the LIA). The effect over a typical solar minimum of a few years appears small.
As an example the coming winter has been said it has a higher than average chance of being colder than average in the northern hemisphere from a meandering jet stream and with a high probability of blocking days over the North Atlantic and Siberia, leading to more snow than usual. The prediction comes from a combination of very low solar activity and eastward Quasi Biennial Oscillation in a non-El Niño year. Stratospheric conditions then favor a break up of the polar vortex allowing masses of dense cold polar air to invade lower latitudes. The period affected is December to March. We will see if it comes to pass, but so far it looks spot on.
There are several reasons why the South Pole is less affected by changes in solar activity. One of them is that the ozone hole leaves no ozone to be destroyed there.
Lets remember also that water vapor is the mother of all greenhouse gases. If ozone levels determine water vapor content at the mid-atmosphere where IR radiation to space takes place, then ozone levels very much affect the GHG effect.
It’s mother and father, but because it changes state, and it stores energy in this state change.
Javier, by what mechanism does stratospheric ozone level determine water vapor content of the troposphere?
It doesn’t say. What it says is:
“The time delay of the H2O response to the ozone forcing (in order of ~6 years,) reflects the observationally obtained fact that always the high extra-tropical near tropopause O3 densities are accompanied by the reduced specific humidity (Pan et a., 1997, Hegglin et al., 2009; Tilmes et al., 2010).”
…
“Satellite data for relative humidity, derived by the Atmospheric Infrared Sounder (AIRS), show that super-saturation is very frequent in the extra-tropical upper troposphere, occurring in 20– 40% of the time, and over 50% of the time in the storm track regions below the tropopause (Gettelman et al., 2006). This means that becoming saturated the extra-tropical upper troposphere is already conditionally unstable. Consequently, a local cooling of the tropopause (e.g., due to reduced O3 density) uplifts the neutral buoyancy level, increasing the possibility for upward propagation of the moister upper tropospheric air (triggered for example by local turbulence, baroclinic instability, etc.).”
Javier,
That is a reasonable summary of the current state of play.
The advantage of my mechanistic description is that we should be able to trace the chain of causation that I suggested over time.
Ultimately, a quiet sun causes more global clouds by making the jet streams more wavy. Less energy gets into the oceans and the balance between El Nino and La Nina events changes.
Stronger El Ninos relative to La Ninas result in a warming globe and vice versa.
From that perspective the current (and unexpected) La Nina is worth watching carefully.
‘Stronger El Ninos relative to La Ninas result in a warming globe and vice versa.’
Simple and straight forward, would it be fair to say El Nino is more common and intense during times of high solar activity?
During the LIA (with low solar activity) it seems La Nina reigned supreme.
Stephen,
You appear to be ruling out cosmic ray bombardment for increasing low cloud cover, your hypothesis of a wayward jet stream has merit but the jury is still out.
Importantly ENSO has a solar connection.
‘We find that the Medieval Warm Period (∼AD 800–1300) was characterized by a negative index, which indicates more El Niño-dominated conditions, whereas during the Little Ice Age (∼AD 1400–1850) more La Niña-dominated conditions prevailed. The Southern Oscillation Index we derive is significantly correlated with reconstructions of solar irradiance and mean Northern Hemisphere temperature fluctuations.’
Hong Yan et al. 2011
Javier December 12, 2017 at 4:47 am
To me the most interesting aspect of the article is that they seem clueless about the effects of autocorrelation on statistical significance. If you adjust for autocorrelation the apparent statistical significance disappears. This is because the two datasets (O3 and RH) have extremely high Hurst exponents.
Every climate science paper should have a statistician on the team who knows about the statistics of autocorrelated datasets …
w.
But, but Willis, why should they include a statistician if he was only going to find something wrong about their paper? xDDD
In the Southern Hemisphere the subtropical ridge (STR) appeared to lose its intensity around late July, with ‘blocking highs’ the new norm.
Its a global cooling signal, do I have a seconder ……
The world has been cooling for the past 22 months. That much is true. And I wouldn’t expect any warming for 2018.
A prolonged significant cooling has been predicted by many for the past two decades and they have been wrong. I wouldn’t hold my breath for that.
Thanks Javier, I’ll take that onboard.
From this discussion I get that GCR, the sun, earth’s magnetic field, etc. may have something to do with climate, somehow.
Lots of info. No conclusions.
“>>> A paper published today <<<"
Er…. this paper by Kilifarska is not published today. It was published in December 2015.
The warming in the last 150 years was caused by a reduction in cloud cover and a reduction in wind speeds.
Solar changes caused the reduction in cloud cover and reduction in wind speeds.
I have researched this subject in detail and will provide a Coles notes summary of what is going on, if and when there is cooling.
http://www.atmos-chem-phys.org/5/1721/2005/acp-5-1721-2005.html
http://bbso.njit.edu/Research/EarthShine/literature/Palle_etal_2004_ASR.pdf
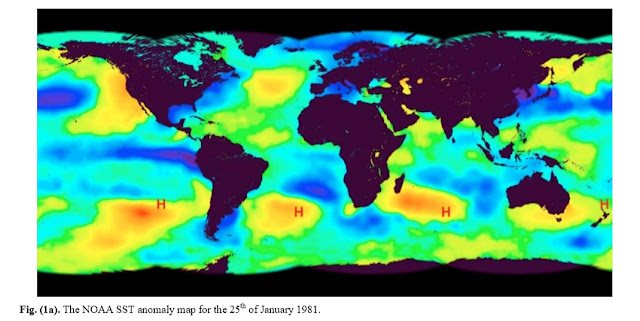
http://www.ospo.noaa.gov/data/sst/anomaly/2017/anomnight.12.11.2017.gif
i think the reduction in particulates pumped into the atmosphere from industry and vehicles could have had a significant effect on the reduction of low level clouds. flying low level in light aircraft in the 70’s with the door open to accommodate aerial photographers resulted in stinging/streaming eyes nose and throat anywhere near major industrial centres according to my father.
the current industrial situation in china might provide an opportunity to measure this.
Let’s see ozone and the pattern of the polar vortex in the lower stratosphere.
http://www.cpc.ncep.noaa.gov/products/stratosphere/strat_a_f/gif_files/gfs_toz_nh_f00.png
http://www.cpc.ncep.noaa.gov/products/stratosphere/strat_a_f/gif_files/gfs_z70_nh_f00.png
Finally, Anthony is getting warmer. Quieter Sun means more cosmic rays hitting the Earth’s atmosphere
resulting in more cloud formation resulting in global cooling. Grand Solar Minimum is upon us.
Meanwhile – The Dec-January-February Zonal N=4 Standing Wave in the SST and MSLP Anomalies of the Southern Hemisphere are Back!
https://astroclimateconnection.blogspot.com.au/2017/12/the-dec-january-february-zonal-n4.html
BoM have been saying for more than a decade that the intensification of the STR is a global warming signal.
This is clearly not the case.
This paper fits well with my paper showing that climate is controlled by natural orbital and solar activity cycles. The millennial temperature cycle peaked at about 2003/4 and the earth is now in a cooling trend which will last until about 2650.For an accessible blog version See
https://climatesense-norpag.blogspot.com/2017/02/the-coming-cooling-usefully-accurate_17.html
The coming cooling: usefully accurate climate forecasting for policy makers.
Dr. Norman J. Page
Email: norpag@att.net
DOI: 10.1177/0958305X16686488
Energy & Environment
0(0) 1–18
(C )The Author(s) 2017
journals.sagepub.com/home/eae
ABSTRACT
This paper argues that the methods used by the establishment climate science community are not fit for purpose and that a new forecasting paradigm should be adopted. Earth’s climate is the result of resonances and beats between various quasi-cyclic processes of varying wavelengths. It is not possible to forecast the future unless we have a good understanding of where the earth is in time in relation to the current phases of those different interacting natural quasi periodicities. Evidence is presented specifying the timing and amplitude of the natural 60+/- year and, more importantly, 1,000 year periodicities (observed emergent behaviors) that are so obvious in the temperature record. Data related to the solar climate driver is discussed and the solar cycle 22 low in the neutron count (high solar activity) in 1991 is identified as a solar activity millennial peak and correlated with the millennial peak -inversion point – in the UAH temperature trend in about 2003. The cyclic trends are projected forward and predict a probable general temperature decline in the coming decades and centuries. Estimates of the timing and amplitude of the coming cooling are made. If the real climate outcomes follow a trend which approaches the near term forecasts of this working hypothesis, the divergence between the IPCC forecasts and those projected by this paper will be so large by 2021 as to make the current, supposedly actionable, level of confidence in the IPCC forecasts untenable.”
The 1991 millennial solar activity peak is seen in the Fig10 neutron data
Fig. 10 Oulu Neutron Monitor data (27)
“The connection between solar “activity” and climate is poorly understood and highly controversial. Solar “activity” encompasses changes in solar magnetic field strength, IMF, GCRs, TSI, EUV, solar wind density and velocity, CMEs, proton events, etc. The idea of using the neutron count and the 10Be record as the most useful proxy for changing solar activity and temperature forecasting is agnostic as to the physical mechanisms involved. Having said that, however, it seems likely that the three main solar activity related climate drivers are the changing GCR flux – via the changes in cloud cover and natural aerosols (optical depth), the changing EUV radiation producing top down effects via the Ozone layer, and the changing TSI – especially on millennial and centennial scales. The effect on observed emergent behaviors i.e. global temperature trends of the combination of these solar drivers will vary non-linearly depending on the particular phases of the eccentricity, obliquity and precession orbital cycles at any particular time convolved with the phases of the millennial, centennial and decadal solar activity cycles and changes in the earth’s magnetic field. Because of the thermal inertia of the oceans there is a varying lag between the solar activity peak and the corresponding peak in the different climate metrics. There is a 13+/- year delay between the solar activity “Golden Spike” 1991 peak and the millennial cyclic “Golden Spike” temperature peak seen in the UAH6 data at 2003 in Fig. 4. It has been independently estimated that there is about a 12-year lag between the cosmic ray flux and the temperature data – Fig. 3 in Usoskin (28). ”


This correlates with the millennial temperature peak seen at 2003/4 in the RSS data in Fig4
Fig 4. RSS trends showing the millennial cycle temperature peak at about 2003 (14)
Figure 4 illustrates the working hypothesis that for this RSS time series the peak of the Millennial cycle, a very important “golden spike”, can be designated at 2003.
The RSS cooling trend in Fig. 4 and the Hadcrut4gl cooling in Fig. 5 were truncated at 2015.3 and 2014.2, respectively, because it makes no sense to start or end the analysis of a time series in the middle of major ENSO events which create ephemeral deviations from the longer term trends. By the end of August 2016, the strong El Nino temperature anomaly had declined rapidly. The cooling trend is likely to be fully restored by the end of 2019.
Here is the forecast to 2100 from Fig 12
Fig. 12. Comparative Temperature Forecasts to 2100.
Fig. 12 compares the IPCC forecast with the Akasofu (31) forecast (red harmonic) and with the simple and most reasonable working hypothesis of this paper (green line) that the “Golden Spike” temperature peak at about 2003 is the most recent peak in the millennial cycle. Akasofu forecasts a further temperature increase to 2100 to be 0.5°C ± 0.2C, rather than 4.0 C +/- 2.0C predicted by the IPCC. but this interpretation ignores the Millennial inflexion point at 2004. Fig. 12 shows that the well documented 60-year temperature cycle coincidentally also peaks at about 2003.Looking at the shorter 60+/- year wavelength modulation of the millennial trend, the most straightforward hypothesis is that the cooling trends from 2003 forward will simply be a mirror image of the recent rising trends. This is illustrated by the green curve in Fig. 12, which shows cooling until 2038, slight warming to 2073 and then cooling to the end of the century, by which time almost all of the 20th century warming will have been reversed.
Fig 11 shows another neat example of the early 21st century inflexion point in Temperature and Cloud cover
In the paragraph following Fig 10 it should refer to the RSS data not the UAH data in Fig 4
There is no evidence for a 1000-yr cycle peak in 1991:
http://www.leif.org/research/Cosmic-Ray-Modulation-No-1000-yr.png
Leif see 1)blue triangle in your top plot.2) The general trend from 1650 to about 1990 in bottom left. 3)Purple 11 year averaqe from about 1650 to about 1990 in bottom left.
See Be 10 Flux Dye 3 data trends from 1700 – about 1980
Fig. 9 Berggren et al 2009 A 600-year annual 10Be record from the NGRIP ice core Greenland (25)
See Millennial Temperature cycle below
Fig.3 Reconstruction of the extra-tropical NH mean temperature Christiansen and Ljungqvist 2012. (9) (The red line is the 50 year moving average) for recent peak and inversion point see Figs 4 and 7 above. These peaks are delayed by +/- 12 years from the 1991 solar activity peak.
An estimate of the average amplitude of the NH temperature Millennial cycle can be made from the 50-year moving average curve (red) of Fig. 3 above. It is about 1.7 degrees C from the 990 peak to the LIA minimum at about 1640. This is entirely consistent with the Northern Hemisphere estimates of Shindell (21), and with the Arctic amplitude reported by Mckay et al 2014 (22).
,See 1000 year temperature cycle data in Fig 7 from the paper
I use the neutron data and temperature data together to build a total interpretation and working hypothesis.
Whatever. That does not change the fact that there is no cosmic ray 1000-yr cycle peak in 1991.
1)blue triangle in your top plot
See the other symbols at that time. You are interpreting noise in a single year. Not very scientific… but typical of people enamored by their own pet opinion.
I’m happy to let readers read this exchange and the paper and form their own opinions. Here are a few other time delays from the 1991 solar activity peak for readers to consider.
Minimum sea ice volume – 2012 – delay from 1991 – 21 years
Global sea level peak – 2015/16.- delay from 1991 – 25 years +/-
Tropical cloud cover trend change in Fig 11 above – 2002- delay – 11 years , close to that seen in Fig 4 above.
Y’all heard it here first I think.
I should make it clear that the sea ice volume above refers to the
Arctic. The Antarctic trends are sometimes inverse to these.
A sure sign of a spurious correlation. Everything fits except when it doesn’t…
The polar seesaw is a well known phenomenon. The correlation I’m referring to is that between the NH sea ice volume minimum at 2012 and the solar activity millennial maximum in 1991.
For a discussion of the polar seesaw see
Twentieth century bipolar seesaw of the Arctic and Antarctic surface air temperatures
Authors
Petr Chylek, al
“Understanding the phase relationship between climate changes in the Arctic and Antarctic regions is essential for our understanding of the dynamics of the Earth’s climate system. In this paper we show that the 20th century de-trended Arctic and Antarctic temperatures vary in anti-phase seesaw pattern – when the Arctic warms the Antarctica cools and visa versa. This is the first time that a bi-polar seesaw pattern has been identified in the 20th century Arctic and Antarctic temperature records. The Arctic (Antarctic) de-trended temperatures are highly correlated (anti-correlated) with the Atlantic Multi-decadal Oscillation (AMO) index suggesting the Atlantic Ocean as a possible link between the climate variability of the Arctic and Antarctic regions. Recent accelerated warming of the Arctic results from a positive reinforcement of the linear warming trend (due to an increasing concentration of greenhouse gases and other possible forcings) by the warming phase of the multidecadal climate variability (due to fluctuations of the Atlantic Ocean circulation). ”
Obviously I disagree with “due to an increasing concentration of greenhouse gases ” and blame other possible sources for the source of warming..
The polar seesaw is a well known phenomenon
But cannot be taken as evidence of a [non-existent] 1000-yr solar cycle.
This is the polar vortex in the middle stratosphere and ozone distribution at the same height. ?oh=bd04c3dc8401ca9ed5b7579604dc8c9c&oe=5AC1B19E
 ?oh=f7b5a6bc5ee738146dd14a0e40c6fb0b&oe=5ABFB3E5
Such a stratospheric circulation means strong temperature drops in the east of North America.
https://earth.nullschool.net/#current/wind/isobaric/70hPa/orthographic=-29.71,50.96,342
As I have been saying low solar equates to overall lower sea surface temperatures and a slightly higher albedo.
Lower sea surface temperatures due to less UV light.
Higher albedo due to an increase in major volcanic activity and an increase in global cloud coverage/snow coverage.
It is happening now and global temperatures by the summer of year 2018 I think will be at or below 30 year means according to satellite data.
We will know soon.
[I’m allowing this comment for now, as a trial, behave yourself. – Anthony]
I will
thanks
Severe disturbances of the polar vortex are visible.
http://www.cpc.ncep.noaa.gov/products/stratosphere/strat-trop/gif_files/time_pres_UGRD_MEAN_OND_NH_2017.png
http://www.cpc.ncep.noaa.gov/products/stratosphere/strat-trop/gif_files/time_pres_WAVE1_MEAN_OND_NH_2017.png