Study helps narrow down one reason why clouds are hard to model

From the DOE/PACIFIC NORTHWEST NATIONAL LABORATORY
A key problem is that we generally do not have data on clouds from the preindustrial era, before there was pollution, for comparison with the clouds of today. Because clouds are a key part of Earth’s climate system, working out how they behaved before the Industrial Age might ultimately help us better determine how much the world will eventually warm up.
The study points to at least two ways to potentially improve how the clouds are simulated in climate models. One is to better differentiate cloud types in models to account for their variability. Another would be to study clouds that are not influenced by the pollution that humans have been putting out since the Industrial Age started.
“We might have to find clouds far away from civilization,” said study author Steve Ghan of the Department of Energy’s Pacific Northwest National Laboratory. “But, there are parts of the world that are pretty darn clean.”
Cloudy affect
One of the toughest questions dogging climate scientists is how much the earth will warm from all the greenhouse gases humans are putting into the atmosphere. Computer models put out a range of possibilities, and the smaller the range, the more sure scientists can be of the result.
For example, scientists use models to calculate a property called climate sensitivity — or how easy it is to warm the earth with additional greenhouse gases. Ultimately, climate sensitivity will tell us the temperature we will end up at so we don’t have to wait until the earth adjusts to the added gases, allowing us to prepare for or impede climate change.
Conceptually, climate sensitivity would be straightforward to estimate if one focused on just a few limited components of the Earth system — namely, greenhouse gases in the atmosphere, sunlight hitting the earth, and Earth bouncing some of the sunlight back to space. Under this greatly simplified model, scientists could be pretty confident in their climate sensitivity value: the earth will most likely warm about three-fourths of a degree Celsius for every unit of the sun’s energy trapped in the atmosphere, with a possible range of a quarter of a degree more or less.
But the sunlight bouncing off the Earth’s atmosphere is complicated by the presence of clouds that change in ways that are poorly understood. Climate scientists want to incorporate all the pieces that make up the earth system to nail down a value for overall climate sensitivity. For their part, Ghan and colleagues have been exploring the contribution of clouds and the tiny aerosol particles that influence cloud properties.
“It’s not enough to have particle emissions and solar energy balance alone because a lot is going on in between,” said Ghan.
Cloudy complexity
Currently, when scientists use models to calculate the extent to which aerosols — through clouds — affect the earth’s climate, they get a much, much wider range and greater uncertainty than for greenhouse gases.
Why? Clouds are complex — their properties are influenced by tiny aerosol particles called cloud condensation nuclei that cloud droplets form around; a greater number of particles leads to more cloud droplets which in turn affects the cloud brightness and lifetime, since small cloud droplets hang around for hours, and larger water droplets are more prone to come down as rain, if they’re heavy enough. The physics and chemistry underlying these and other components mean scientists have to represent daunting complexity in models.
Also, clouds are ephemeral creatures. The measurements of clouds that scientists now take have no counterpart in the geologic record, unlike greenhouse gases that are preserved in bubbles in ice cores. Between ice cores, rocks, trees, and fossils, researchers have a good idea how much carbon dioxide existed in the pre-industrial atmosphere. But they can’t tell how often dinosaurs cavorted under cloudy skies.
To see how well cloud and aerosol measurements are represented in models, Ghan and colleagues compared different models to each other and to measurements and examined how they re-created the past and present. They did this by essentially taking apart the simulations and testing the pieces.
Comparing models
A climate model is like a train barreling through a tunnel — scientists put data on the train at one end and the train delivers a view of the climate out the other. In a perfect world, the simulated climate would take a smooth ride through that tunnel. But it’s possible that a rollercoaster resides within, taking the simulation through twists and turns that don’t resemble reality.
To compare the different models, the team looked at the rides taken by the individual components of the equations that make up the simulations. The relationship between the pre-industrial and present day values of any given component, say, the changes in the concentrations of cloud droplets resulting from a change in aerosols, should be the same across the nine different computer models they tested and should be reflected in data from observations.
The team found, however, that pre- and post-industrial values didn’t agree, and in some cases the there was even a difference in sign (that is, one model yielded a positive value while another yielded a negative one).
That indicated they could not model pre-industrial clouds using measurements that have been collected in a post-industrial world.
“It’s very curious. With greenhouse gases, climate sensitivity doesn’t change over eight hundred thousand years. It works. Why don’t clouds?” Ghan said.
Additional research is needed to figure out why pre-industrial clouds differ from today’s clouds. But Ghan said there are several potential directions to go.
One, clouds may be more complex than currently represented in models. For example, clouds could have layers that scientists haven’t accounted for in models that complicate the transfer of sunlight in and out of the system. In this case, old and present-day clouds would actually be the same, but it would mean the models are missing essential complexity needed to simulate how aerosols and clouds interact.
Two, today’s clouds in regions of the world where observations are made are never as clean as they were in pre-industrial times.
“Present day variability doesn’t apply to pre-industrial times because everything’s different now that we’ve been putting greenhouse gases and pollutants in the air for so long,” said Ghan.
Scientists can explore this option by studying clouds in pristine regions of the world, such as in the southern hemisphere between the latitudes of 40 and 50 degrees.
A third explanation could be that the equations used to represent the cloud-aerosol interaction aren’t quite right and need to be revisited. In the future, distinguishing between these options may help scientists shine light on cloud modeling’s cloudy history.
###
This work was supported by the US Department of Energy Office of Science, the National Natural Science Foundation of China, the Austrian Science Fund, the Swiss National Supercomputing Centre, the UK Natural Environment Research Council, the UK European Research Council, Japan’s Ministry of the Environment, the Japan Society for the Promotion of Science, and the US National Science Foundation.
Reference: Steven Ghan, Minghuai Wang, Shipeng Zhang, Sylvaine Ferrachat, Andrew Gettelman, Jan Griesfeller, Zak Kipling, Ulrike Lohmann, Hugh Morrison, David Neubauer, Daniel Partridge, Philip Stier, Toshihiko Takemura, Hailong Wang, and Kai Zhang. Challenges in Constraining Anthropogenic Aerosol Effects on Cloud Radiative Forcing Using Present-day Spatiotemporal Variability, Proc Natl Acad Sci U S A, Early Edition, February 22, 2016, DOI: 10.1073/pnas.1514036113.
Let me guess, they left ionizing radiation out of the cloud formation model.
I was left to ponder the same thing. They completely ignored the recent CR level increases?
Likely.
Well today’s clouds are not even the same as yesterday’s clouds. Clouds are the epitome of the “Everything happens only once.” problem.
And we have NO global cloud monitoring network, as in being UNDER the clouds, and measuring the surface arriving solar energy for a change.
I have a hemispherical all sky fisheye lens for my cameras, and it is amazing how far out in the boondocks you really have to get, to actually be able to photograph the whole sky.
G
“Studying clouds in the pristine regions of the world, such as in the southern hemisphere, between the latitudes of 40 and 50°”. Sounds like a whole new area for research, but too late for the almost defunct Australian Centre.
There are some pretty scenic sites for junketeering to study this vexing issue, such as San Martin de los Andes, Argentina, just below 40 S:
http://www.viajesyturismoaldia.com/2012/01/06/san-martin-de-los-andes-la-ciudad-de-la-cordillera/
The first image shows marked texture changes on the lake’s surface. My bet would be that this is caused by pollution of the surface by either light oil or surfactants, or perhaps both. This will reduce the production of breaking waves, fewer breaking waves will produce fewer bubbles so fewer aerosols, etc etc — you can complete the chain yourself. This is happening even in this supposedly clean place.
Now scale that up, look at how much surfactant and oil we are dumping on the oceans, and consider what that might do to aerosol production.
JF
I fear only Tasmania, would make the grade. More a job for Lauder station in NZ http://www.ndsc.ncep.noaa.gov/sites/stat_reps/lauder/
“I fear only Tasmania, would make the grade.”
Nah, too many extraneous commas down there, apparently.
Everyone pauses after saying Tasmania, so others can ask “Where?”
You owe me a keyboard, HAS.
Welcome to the comma community since everybody just texts today no need to learn words or take a breath saying them nobody talks to each other these days the ” Social Networks ” have all but eliminated social networking from the planet
G
Of course the frequent volcanic eruptions in Patagonia might queer the aerosol pitch there. Not to mention forest fires.
Doesn’t the idea that a “pristine region” even exists contradict the idea of the atmosphere being well mixed?
By the way, pre-industrial clouds *have* left some traces. Paintings. They won’t give you global estimates, but surely it’s worth asking an art historian about clouds in paintings?
I was going to comment that Occam* might be reaching for his razor again, in frustration at the absurd notion that “clouds might change rather than models”.
However, the clouds are amazing here in Ross Tasmania and since I moved here, I often mention that fact to whoever will listen! Coincidentally friends holidaying from the US specifically commented on the ‘quality’ and beauty of the clouds, oddly they also live at the same latitude (42 degrees) north.
The clouds impressed me so much that they became a subject for a series of paintings that reference John Constable:
http://www.wilmotbennett.com/_dbase_upl/skying_ross.jpg
Above: Two studies (Acrylic on paper) from my series titled Ross ‘Skying’
Constable (1776 -1837) lived and worked in pre-industrial society before the industrial revolution (1750 to 1850). He is noted beyond his major paintings, for is observational studies of clouds, works he collectively termed, “sky-ings”. Often painted in oil on paper the studies were such accurate illustrations that it has been suggested that he may have used a camera obscura to quickly trace the outlines of clouds.
http://www.wilmotbennett.com/_dbase_upl/clouds_constable.jpg
Above: A selection of John Constable’s cloud studies
Constables studies had reminded me of what I was seeing in Ross, so perhaps the notion of “old clouds” has some merit 😉
*Ockham’s razor (Law of parsimony)
Those cloud pictures look fake.
G
They do sort of entertain the posibility that the models just do not fit reality, which seems to be the simplest explanation. Changes in clouds doe seem a stretch.
Yes, I thought this was pretty dubious:
So they can model climate back 800,000y and explain it so accurately that they can be sure that CO2 componet is working correctly ?
Show me ! They can’t even get the last 60 right.
Climate sensitivity to CO2 change probably hasn’t changed in 800 million years, right around zero.
That’s easy to model, but evidence on CO2 levels is difficult to determine. You can just ignore my comments though, I wasted my postgraduate years on research methods and statistics rather than Climate Science, which I don’t remember hearing about 32+ years ago.
Both Sides, Now
Rows and flows of angel hair
And ice cream castles in the air
And feather canyons everywhere,
I’ve looked at clouds that way.
But now they only block the sun,
They rain and they snow on everyone
So many things I would have done,
But clouds got in my way.
I’ve looked at clouds from both sides now
From up and down and still somehow
It’s cloud illusions I recall
I really don’t know clouds at all
Read the paper. Pretty dense and technical. Two bottom lines. 1. Todays clouds not yesterdays clouds, so no way to know anthropogenic cloud radiative forcing. So by implication no way to know anthropogenic ECS. 2. None of the models examined agree on clouds; they don’t do clouds well.
Despite this, AR5 WG1 chapter 7 is certain the cloud feedback is significantly positive. “This conclusion is reached by considering a plausible range for unknown contributions by processes yet to be accounted for, in addition to those occurring in current climate models.” SOD, direct quote cited in essay Cloudy Clouds.
Despite unknown contributions from unaccounted processes, we climate scientists know its positive: Because the CMIP5 models all had positive cloud feedback (7.2.4.4).
Equivalent to Shaman reading entrails. Voodoo science. This new paper helps expose it. More subtle warmunist climb down.
They drilled down. As is proper.
I don’t know if they are whimpering up the right tree, yapping up the wrong one, or pointing dead on target for either the right or wrong reasons.
But they are looking at the gray area all game designers want to be net-neutral, but never is. That is where to look. By ignoring it, those who have worn the paint off the panic button have left the likes of our team a whole lot of low hanging fruit.
If both sides in this are looking in the (probable) right place, science, writ large will profit. There is nothing like a good opponent to tighten up one’s game. And, I might add, game design.
Evan, that’s an amusing anology, but are they hunting dogs or attack dogs?
I don’t know. But this is not a bad place to look.
So they admit there are processes not yet accounted for, admit they do not know what they are, but take a wild-assed guess at what they don’t know, call it “plausible” and there you go, settled science.
Plausible scenarios or speculation is what you use to develop a hypothesis, not derive a conclusion. Holy climate, how detached are these people from common sense never mind scientific process.
There are always processes that are unaccountable. That’s just the way it is. The idea is to take what you have, do what you must. If you can. (USHCN dense, GHCN wretchedly sparse.)
But what you do must be open and subject to scrutiny, transparent, statistically replicable. And you gotta show your work.
Statistically replicable… maybe they should get paid by money that is good only statistically.
I have only read four or five papers on clouds and aerosols. This includes the one by Bjorn Stevens reducing the estimate for aerosol radiative forcing – perhaps the first I read in full. Although it generated a lot of enthusiasm on the skeptic blogosphere, to me it exposed how little we know. Pretty much every paragraph includes a sentence like: it seems reasonable to assume…
Seems? Reasonable? Assume?!
In business these are known as SWAGs. Stupid Wild Assed Guess. And in business, reality usually bites SWAGs fast and hard.
ristvan.
There’s lots of easy SWAG ($) for the taking in the climate industry, and lots of Stupid Wild Assed Guess’s (SWAG $) in the climate industry.
Climate insiders moto = Anything for a dollar!
We could have used a computer model to convert our SWAGs into formal SWOT* analyses. Would have made it a lot easier.
*strengths/weaknesses/opportunities/threats
One has to ask if it is reasonable to assume that 40-50S represent pre-industrial cloud patterns. It would be a leap of unprovable faith then to assume that similar latitudes of 40-50N would have been the same before industrialization. The two hemispheres haven’t been the same in anything during recent times. Simply having much greater land area in the northern hemisphere changes the availability of both nuclei for condensation and the amount of water vapour available to condense. They are chasing shadows that never can be caught. The fact that hemispheric temperatures deviate also plays into the condensation equation. Studying clouds as they exist today would be more productive, if for no other reason than trying to determine the sign of clouds within the climate system. Another paper to keep the 15 authors employed, but no real answers given.
IPCC AR5 WG1 Full Report Jan 2014 : Chapter 7 Clouds and Aerosols:
7.3.4.2
The responses of other cloud types, such as those associated with deep convection, are not well determined.
7.4.4.2
Satellite remote sensing suggests that aerosol-related invigoration of deep convective clouds may generate more extensive anvils that radiate at cooler temperatures, are optically thinner, and generate a positive contribution to ERFaci (Koren et al., 2010b). The global influence on ERFaci is unclear.
It is unclear how they can pretend to be 95% certain of anything when they openly admit they know so little about the essential processes of climate.
They are still all about semi-arbitrary juggling of dozens of fudge factors to get something looks a bit like a steady rise with a couple of dips.
At least this paper seems to acknowledging the level of ignorance.
ristvan: “Despite unknown contributions from unaccounted processes, we climate scientists know its positive: Because the CMIP5 models all had positive cloud feedback (7.2.4.4). Equivalent to Shaman reading entrails. Voodoo science.”
It’s even worse than that. Consider Stephens et al., 2012.
http://planck.aos.wisc.edu/publications/2012_EBupdate_stephens_ngeo1580.pdf
There, they suggest that the uncertainty in estimates of the radiative energy balance is about ~17 W m-2, and that “this uncertainty is an order of magnitude [10 times] larger than the changes to the net surface fluxes associated with increasing greenhouse gases in the atmosphere”. The uncertainty in the estimates of the Earth’s energy balance are also “an order of magnitude larger than the current estimates of the net surface energy imbalance of 0.6 ±0.4 Wm–2 inferred from the rise in OHC”. They even acknowledge that “this small imbalance [0.6 W m-2] is over two orders of magnitude [100 times] smaller than the individual components that define it and smaller than the error of each individual flux.” Finally, they acknowledge that “the sum of current satellite-derived fluxes cannot determine the net TOA radiation imbalance with the accuracy needed to track such small imbalances associated with forced climate change.”
And yet despite this ocean of uncertainty relative to the pond of alleged anthropogenic forcing, they still claim that we know that humans caused the 0.6 W m-2 energy imbalance anyway. Anyone who questions this is a science denier.
So, some people were paid high wages and lots of free time to write ‘We don’t know noth’n’? HAHAHA.
For many centuries humans have burned down forests in all parts of the world. I would suggest that North-American and Western European air quality is better than has been in more than 500 years.
And natural forest burns, too, over massive areas, and (wait for it)… Volcanic eruptions!
Yeah, slash-and-burn agriculture didn’t start last century. But it’s not just humans. Nature does too, like with lightning-sparked wildfires. There are entire ecosystems dependent on fire.
And that doesn’t count natural coal seam fires that sometimes burn for centuries. The Burning Mountain in Australia is estimated to have been burning for 6 millennia.
@ur momisugly Katherine, 5:34 pm, I believe there is a huge one in Russia as well. Been burning for decades, there are so many events on the planet that can influence particulate and many are unpredictable. So far no one has even mentioned dust storms , American , Chinese. African and Australian desert dust can travel thousands of miles at very high altitudes and in many different patterns depending on the season and the severity..
Sigh. And if you have a nice, modularized top-down model like any competent mathematician or good game theorist will give you, well that would be good. Instead of the bottom-to-top spaghetti we usually see.
They got such good tools, these guys. And anyone can use them. But they all got warning labels. Heed them. (They often don’t.)
Our team is forced to adjust for equipment jumps. No way around that one, folks. Just is. Red Flag. This can turn a station trend from low to high, high to low, high to very high, low to very low. It can be plus or minus to Tmax or Tmin, and it applies to all classes of stations across the board.
Or it can be dead-on, with nary a waver. It’s an adventure every time you roll the dice. (As Quayle91 and Hubbard/Lin06 also found.) Don’t think a trend can switch signs from a valid, utterly necessary adjustment? Think again. (And pairwise poker is, lamentably, the best game in town. And you can’t get out of the game, anyway.)
The problem is that so far as I can tell, if the recalibration was within 1C of Tmean of the other equipment well, that was just fine. And sometimes, not even then. Therefore, of course, since we aret trying to ferret out a way subdegree longterm delta, it is all over the map. Not that I blame them. That CRS equipment wasn’t originally designed for longterm trends. It was designed short-term, and back when, the emphasis was on rain gauges, not temps, anyway. Airports need to know how hot it is on the runway (inter multa alia), but when an ASOS goes up, who knows what will happen? I’m sure I don’t.
It must be filtered out, and crudely-but-correctly is just what the doctor ordered. Questionable for some individual stations, but quite good for regional (yes, things can and often do work that way).
You or someone else can always do the refining. But you need to be able to slot it in seamlessly with whatever you have. Top-down design isn’t a limitation. It allows you to make the very best of what you have and (just as important) the ability to drill down where and as far as needed. It’s a continuing process.
(That’s why CRN is such an asset; it’s consistent and controlled. And wonderfully sited.)
But considering what we have to play with you can’t get away from adjustments. It’s the cards we were dealt. It’s a matter of playing what you have to best advantage.
Other than perhaps a simplistic allowance for albedo and thereafter any feedback effects, it seems strange that anyone would consider it possible to model clouds within a climate model. Not only are clouds transient, they are dependent on numerous other things for their formation, longevity, height, etc. For example, the ‘local’ terrain will affect how long clouds hang around (think relief rainfall).
I would have thought the best they could do is estimate the albedo and the average percentage of cloud cover (for say, given regions), and that’s about it. Expecting to be able to anything more is pure fantasy in my opinion, as clouds are a part of the chaotic non-linear system! Logically, given all the potential variables they have available to tweak in their models, how the feck do they know which ones need tweaking? I guess they just decided to pick on clouds for a bit!
Clouds leave no imprint. Well, maybe a little indistinguishable yet-unfound proxies in some future mud core. Stranger things have happened. They are chaotic. Some trap, others reflect. It’s hard to assess the trends, and a little more (or different) clouds can make a significant difference in the surface data.
” But they can’t tell how often dinosaurs cavorted under cloudy skies.”
A lot! The period had lush tropical forests that require a lot of rain. Also, surely the ice cores are also a “proxy” for how much precipitation fell down. I have never seen such a diffuse, chatty type of speculative discussion of what is supposed to be a scientific research project. The skies in pre-industrial times over Europe were likely dirtier than they are now – burning wood and coal. Even burning large amounts of wood in the open to make potash and fire to clear land, and these guys think it was pristine!!
The models are definitely far from modelling reality and you tell us you don’t know the details that would go into the models? Also, surely inexorable heating from rising CO2 has been debunked time and again. IT IS the unknown part!! Because of the dogma on CO2, you assume this part of the work to already be known. The ~ 2 decade pause was your best chance to get the first real data on the fundamental underpinnings of your science and what do you do? You deny it’s existence because it upsets the CO2 sacred statutes of your science. Your project has zero chance of coming up with anything useful if you insist on starting off with “givens” that we now know to be faulty.
Someone who hasn’t been steeped in the “study” and body of “knowledge” in climate science is going to make the real discoveries, and they are going to start at the pause, the pause, the pause!! Hello, anyone out there? The pause would make the first exciting fruitful topic of study in climate science. Killing it was the response! What kind of science is this! Oh and gents, another great “pause” occurred between about 1350 and 1850. Look, pauses are there to resolve the mysteries if that is what you are trying to do, not to twist data to make them go away. We had 100,000 year pauses that don’t seem to twig any of the CO2 diviners’ curiosities. Indeed cool pauses made up 90 percent of the record over the last several million years!! The pause is your friend if it’s science you want to engage in.
‘Also, clouds are ephemeral creatures. The measurements of clouds that scientists now take have no counterpart in the geologic record, unlike greenhouse gases that are preserved in bubbles in ice cores.’
Tree rings? Now that we’ve discovered that tree rings are pretty useless for determining temperatures 1,000 years in the past we can employ them to determine cloudiness (ring widths showing plant growth due to photosynthesis determined by cloudiness), and keep the ball rolling for another ten years until we determine they’re pretty useless for determining cloudiness too.
But, when that happens we can determine cloudiness 1,000 years ago through the incidents of melanoma and suntans on mummified remains of ancient Egyptians.
Then, after another ten years have elapsed and we’ve determined that mummified Egyptian remains are useless for determining cloudiness we can keep the ball rolling by determining that fossilized algal remains in buried coral reefs are a proxy for determining cloudiness 1,000 years ago by comparison with symbiotic algae in current coral reefs.
Then, after our children, and our grandchildren have been employed we can move on from the algal cloudiness proxy data (which will be shown to be useless) to the cloud induced asthma incidence proxy data.
..STOP giving them ideas, they think up enough crap on their own !! LOL
The pyramids were built as giant tanning reflectors due to the fickle attitude of Ra at the time. This attitude on the part of Ra led to a movement to replace him as top dog. (Sorry, dyslexia)
Funny how they always want to do ” studies ” in nice tropical paradise’s !
Grow up, Marcus! 40° to 50° South is not a tropical paradise.
When you live in Canada it is !!
Marcus, nope you don’t want to be there The far southern part of NZ and the south tip of South America are on 40 S below that it gets really nasty and not much land either, Hey I live on 50 N . ( in Canada and we grow grapes and cherries I take that any time and you must be way up north even the prairies are better than those places!
45 deg. Nth latitude gose through just north of Salem Oregon, and is signposted on highway 5.
On the other hand the bulk of the US-Canada border is at 54-40, as in 54 deg. 40 minutes North Latitude. Seems like somebodies wanted to fight over that number.
So Canada is ” way up there “. Lots of pretty stuff ‘ way up there ‘ in Canada.
But at 54-40 down there, not much of anything but the southern ocean, beloved of ocean racers in their sail boats (Volvo boats).
G
Notsofast.
40 deg. South goes through about Wanganui, which is somewhat north of Wellington on the North island, so NZ, at least the south island and Stewart island, are very much in the middle of the roaring 40s.
Auckland is somewhere near 36 deg 52 minutes south which is easy to remember since that is the small angle of a 3-4-5 right triangle.
I believe that is also about where the Southern Cross is, so I think that means at some point that the Southern Cross can be seen at the zenith from Auckland. (I think) And you could use a simply constructed 3-4-5 triangular piece of cardboard to navigate to Auckland, at that time. Maybe I have that backwards. Go south till the southern cross is 37 deg. from the zenith then go west till you run into the clouds, and you are right over Auckland.
G
George,
The bulk of the US-Canada border lies at 49 N. The 54/40 line is where SE Alaska starts. In the 1840s, that latitude formed the northern border of the Oregon Country, before it was split between the US and Britain.
PS: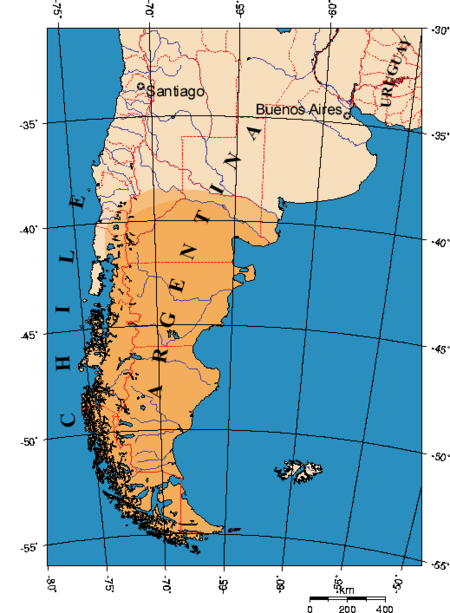
And SE Alaska lies in the latitude of Tierra del Fuego. Cape Horn is at almost 58 degrees, 59 minutes South. In South America, 40 to 50 degrees S would be northern and central Patagonia, which extends farther north in Argentina than in Chile. The corresponding region across the Andes in Chile is Araucania, home to the Mapuche Indians:
BTW, the OR-CA and OR-NV border is the 42nd parallel, comparable to the French-Spanish frontier. Biarritz is at 43/29.
“””””….. You must be using a real map. So only 240 nm from Salem to BC.
I’ll just go and get one of my hat collection and eat it.
g
[True. The mods note that it is actually much closer from Salem to Boston College than 240 nm. .mod]
The truth is likely that clouds affect different regions differently and those effects change over time due to external factors. In other words, the difficulty is multiplied many times over. In addition, added CO2 probably has some impact which increases or decreases these clouds at different times of the day and year and decade and century and millennium.
Otherwise, it is a simple as it gets. 😉
Hi, I’ve got a model. It works like crap. It doesn’t represent the past. And it sure as hell hasn’t represented the future either. Obviously, I don’t understand enough about how things work to actually produce a model that can actually mimic them.
Heh, but that’s ok. I’ll just produce another model about a function in the original model that I understand even less. Then I’ll tack the new model onto the original model.
What’s really cool about this is that, since I understand that one function even less, and cannot possibly conjure up any conceivable proxy for it, I simply can’t verify it by comparing it to the past. Therefore, I can tweak this new impossible to understand model anyway I jolly well please to come up with any result I need to get the original model to at least appear to mimic the real thing.
As long as your model shows a lot of warming, it is a sale to IPCC.
Give thanks for “the pause” and clouds. A Limerick.
The cause for the Climate change pause:
The CO2 increase; because
there’s more clouds in the sky
make more snow, that is why
the climate is stable. Applause! http://lenbilen.com/2016/02/24/4697/
Cloud formation being influenced by aerosols is crying out for a physical experiment.
Get the largest disused aircraft hanger or similar, seal it up tight, insulate it with foam, silver the outside.
Now control the temperature and humidity such that you are close to the dew point, inject aerosols of different types, controlling IR and UV point source levels, and measure what happens.
Has this not been done yet?
What, you want an actual experiment? Heaven forbid, when we can get paid for playing climate computer games err, models instead
But the atmosphere isn’t sealed up tight.
To perform an experiment you would want to control/fix as many variables as possible.
A large space – with controlled inputs and a micro measurement system should do the job.
Why can’t satellites measure energy input to the earth across all solar wavelengths and do likewise for energy output from the earth to provide a basic input-output equation? Several years work for a number of satellites, I’m sure, but we’re getting ready to throw a trillion dollars at a problem we don’t even know we have. Has NASA shown any interest in this sort of investigation? Partner with the ESA, Chinese, Russians,Japanese, and/or Indians?
I am sitting this very moment in a coffee shop with the walls plastered with old airship photographs. Can you believe that at one time you could take a photo of eight airships in the sky at the same time. That photo is on the wall, as well as a photo of one of those airships inside Hangar One at Moffett Field, and if it wasn’t for Highway 101 overpass, just beyond the window of this coffee shop, I would be looking right at the entrance end of that Hangar One skeleton, because it has no skin on it now. It is the most spectacular structure I have ever had to photograph. Quite beautiful in a structural sense.
In any case, when Hangar One did have a skin, then it did have its own weather inside, and it did rain in there.
I could run over there and take some pictures, that Anthony might want to post here.
G
Upon reading the Title, I laughed. Is there no end to the lengths these charlatans will go for grant money.
Why is it a problem? There is no reference to worry about and thus they can model what they want! /sarc
“…To compare the different models, the team looked at the rides taken by the individual components of the equations that make up the simulations. The relationship between the pre-industrial and present day values of any given component, say, the changes in the concentrations of cloud droplets resulting from a change in aerosols, should be the same across the nine different computer models they tested and should be reflected in data from observations.
The team found, however, that pre- and post-industrial values didn’t agree, and in some cases the there was even a difference in sign (that is, one model yielded a positive value while another yielded a negative one)…”
Sounds like the models were programmed to treat pre- and post-industrial simulations differently. I wonder why? Hmmm…
“… and in some cases the there was even a difference in sign (that is, one model yielded a positive value while another yielded a negative one)…”
… also sounds like someone likely plugged in pre-industrial temps (adjusted or not?) and didn’t get what they expected. Another interpretation (although just as goofy) of their work is that their cloud guesses are correct, and the other input parameters are invalid; if we force the cloud guesses as being assumed valid, we can then “prove” that the assumed pre-industrial input temps are too low, and are invalid 🙂
Precipitation as a natural outcome of the cloud formation process should have given them a clue. IIRC weren’t there 15 climate models (regional?) that resulted in 8 drier and 7 wetter projections. So what is the “sign”, and what does it say about the settled science?
There is so very much that science does not understand about the weather machine on this planet. We don’t know what makes ice ages come and go. Inside of an ice age; we don’t know what makes interglacials come and go. During an interglacial, we don’t know what makes relative warm periods come and go … and ditto for relative cold periods (think LIA).
All of the complex mechanisms (known and unknown as Donald Rumsfeld would tell us) that move the heat at the equator to the poles are barely investigated at this time. Think of all the progress humanity would have made if the Trillions wasted on “CO2 will fry us” research had instead gone to trying to map out how the energy/heat moves around on this planet.
The climate models are junk science because the ignorant modelers don’t understand the physics of the system they are trying to model. They are just dong curve fitting. (and doing it badly!)
Someday in the far future, historians of science will look back at this era and shake their heads in wonder at the stupidity of the times.
~ Mark
—————————-
“The message is that there are known knowns. There are things we know that we know. There are known unknowns. That is to say there are things that we now know we don’t know. But there are also unknown unknowns. There are things we don’t know we don’t know.” ~ Donald Rumsfeld
Just think how totally cold it would be at the poles, if it wasn’t for all of that tropical heat energy that gets pumped up or down there by oceanic rivers or atmospheric circulations.
It sort of suggests that there isn’t much solar energy gets directly to the polar regions from the sun, so it has the get convected by the surface and atmospheric rivers.
Which means of course that their is not much incident solar radiation to be reflected by either clouds, or snow ice at the polar regions. So much for the poles being the great earth refrigerator.
Give me a nice high hot dry tropical desert for cooling the earth in the afternoons at a rate that can be 12 times as fast as the great polar refrigerator is cooling us. (at places like Vostock Station).
G
Typos can autocorrect themselves
They could produce better models by leaving out CO2 “forcing” in their energy balance and concentrate on the flow of energy in thunder clouds. I think these clouds are controlling the atmospheric concentration of CO2 as well as temperature. There is a lot more energy transfer in the processes of evaporation/condensation and freeze/thaw than is possible from CO2 radiation/absorption.
“Before there was pollution.”
The cave dwellers who used coal for cooking and heating must have had very efficient
scrubbers. sarc/
http://www.fossil.energy.gov/education/energylessons/coal/coal_history.html
No volcanoes, wildfires, dust storms etc, when oh when do we finally invent a time machine so we can all go back to the “good old days”? ( oh I forgot that’s what the greens want)
“we can all go back”
We? No, send them.
“aerosols are now so pervasive in the atmosphere thanks to modern-day pollution”. It is so fortunate that forest and prairie fires never occurred before the industrial revolution. That would really complicate the reconstruction of ancient atmospheres.
If it hadn’t been for lightning strike grass fires, we never would have discovered how good cooked zebra is (just like chicken).
Then we would still be up in the trees competing with the little monkeys for the ripest figs out there on the small branches.
What a cruel hand we were dealt by all that air pollution that came along with the grass fires.
g
PS grilled wildebeeste tastes just like chickin too.
Let’s see if I’ve got this right. They admit they don’t know what they are doing, but insist that we impoverish ourselves just in case some future event might happen.
Well of that there is a certainty. Future events WILL happen, and all of them in the future.
We dunno what; but they will happen.
g
They could start by trying to get volcanic aerosols right. This analysis finds a time constant of between 8 and 16mo . Climate models are typically 36 – 48 mo . Shorter time constant indicates lower climate sensitivity.
http://climategrog.files.wordpress.com/2014/04/erbe_vs_aerosol_forcing1.png
https://climategrog.wordpress.com/2015/01/17/on-determination-of-tropical-feedbacks/
OMG, not the DREADED SIGN CHANGE.
Only a numerical naif would actually care about a sign change.
The only thing that matters is a significant difference between two numbers. Crossing zero is arbitrary mapping of a continuous distribution to boolean logic.
I weep in sadness for the innumeracy
Peter
Peter, funny thing about that. My bank cares deeply about the sign of my balance when cashing my checks. Read the PNAS paper. The difference in cloud process sign between models is more like my bank than your number continuum.
I have overdraft protection. So on a sign change I get charged a very small small interest rate, down in the noise somewhere if it’s e.g. -$0.01. . If you are paying fees for that sign change, then I question your financial numeracy 🙂
Name some real physical processes that care about a sign change aside from a chaotic process.
Temperature (K) gets all jittery about a sign change.
G
Sometimes the binary mapping is actually rather important. If you are following someone going at 100mph in a car there is a lot of difference between whether you are going at 105 or 95 mph behind them. One leads to a collision.
The sign change in your speed relative to the car in front matters.
But the sign of delta between the speedometers is NOT important. The speedometers have about a 3mph error band and thus a negative sign in the delta between the two is insignificant.
The philosophical difference is the difference between what’s actually happening and what you are measuring as happening. A model is a pretty darn different from what’s actually happening.
Let me rephrase this: “name any physical process that you can measure where the sign of the measurement is significant”.
Note I get to skate out of this by noting that the distance between the cars can’t go negative. Well, maybe if you count compression of the fender?
I’m probably going to lose this battle, but I’m having fun. It might be more interesting to talk about which kind of measurements where the sign is important, and some where it’s not. When does it matter? It certainly doesn’t matter for the temperature trendline. Why does it matter for the cloud process?
Peter
PS, I’ll play, but more in the spirit of fun than rebuke. Dessler found an empirical positive cloud feedback– with an R^2 of 0.02! NASA website wrongly made a big deal out of it.
Working backwards from ECS 3, implying Bode net feedback f=0.65, AR 4 and 5 say the positive water vapor Bode f is about 0.5 (high observationally by 1/3 to 1/2 IMO). Now the other major feedback is clouds. By subtraction, the Bode cloud feedback is (0.65-0.5) ~0.15. Significant positive feedback. The cloud response to rising CO2 is a major warming amplification.
What Dessler actually found is essentially zero. And there are good arguments (like Lindzen’s adaptive infrared iris based on cirrus cloud formation (Judy and I did back to back posts on that previously)) to think that cloud feedback is actually slightly negative. That is, damping rather than increasing the CO2 impact. This makes a big difference to sensitivity, which is the key estimate for CAGW or not CAGW.
Okay, so slightly rebuked, I’ll admit that a sign change in the actual physical quantity can result in a huge change in the integral of the physical quantity over time in some equation. For example the sign of the cloud feedback.
But that’s just my point really: You can’t measure that sign change accurately enough to make any estimate about the integral of that equation. So again the measurement of a sign change is meaningless.
But in the actual math, I’ll concede, sign changes can be critical – the more differences in the differential equation, the more effect the sign change will have.
Peter
diverging system models, poorly created, with a negative sign as feedback creates a “bigger” negative, which creates a bigger negative, and pretty soon you don’t get the runaway you are hoping for (or for which you are hoping).
By the way, the speedo in my car(s) is a whole lot more accurate than +/- 3 mph.
The car I routinely drive, the speedo needle as close as I can read it, tracks my GPS perfectly.
And the digital readout system, reads the same, and it isn’t GPS based (in my car).
G
Sign change is nothing for climate scientists like Mann. He can use proxies upside-down!
Discard all the models that yield a positive sign for cloud feedback ( to the solar input terminal).
That will eliminate a lot of money wasted by persons modeling positive feedback of clouds to who knows what input terminal.
G