By Kenneth Richard on 4. May 2026
Natural atmospheric circulation patterns (like the Western Tibetan Vortex, or WTV) drive total cloud cover (TCC) change, which, in turn modulate the the amount of downward solar radiation reaching the surface.
Over southwest Asia, or the Tibetan Plateau, scientists (Wang et al., 2026) indicate the satellite-observed increase in downward shortwave (DSW) “is the primary driver” of modern warming.
For example, the WTV-induced 11% decline in total cloud cover produced a 7 W/m² increase in DSW, explaining the 1.87 K regional temperature increase.
CO2 is not indicated as a contributing factor in recent Tibetan Plateau warming.

“CO2 is not indicated as a contributing factor in recent Tibetan Plateau warming.”
Oops.
That’ll be the end of any financial support for Messrs Wang et al., then, and they’ll be looking for new jobs now.
Perhaps, but something’s gotta give sooner or later.
Well, Al Gore is now spruiking a coming ice age caused by the collapse of the AMOC.
With the transition into a cooling phase of the ~70 year climate cycle, I would expect the main stream “experts” to gyrate into an alarmist cooling position within the next 5 years or so. They won’t come to the conclusion that Earth’s climate is cyclic and complex, instead they will draw yet another exponential projection and scream about impending doom. Whatever happens, the one thing that can be guaranteed is that the proposed solution to the crisis will be increasing government control over people’s lives.
Something leads me to believe they value scientific truth above pay.
There should be more with such moral principles.
Today’s weather links warming to cloud forcing… It was sunny and warm earlier this morning and now it has clouded over and it has gone rather cool.
Another awkward study to bury, which isn’t hard with a very compliant media.
“Another awkward study to bury”
There are many of these regional studies. Several have measured 8 W/m^2 increases due to the cloud reduction. Ignoring data is fundamental to climate alarm.
This is just Big Oil funded Denier Science.
Mikey Mann
Always fun to read someone’s WAG about cause and effect of physical processes occurring within this world.
I guess you didn’t read the part of the article that mentions “the satellite-observed increase in downward shortwave (DSW)”?
Pity.
No fartknocker, you didn’t read the part where he contributed it to natural causes. Anyone that has any legitimacy in climate research knows that Global Brightening / Dimming is causing major changes in all climate metrics, exactly what the little researcher is observing. But cause and effect, beyond him, and damn sure beyond you but you did parrot the effect, but the cause will always allude a sociopath such as yourself.
Now, go to bed..
Congratulations! By that one statement you have effectively falsified the major claims of the IPCC and all AGW/CAGW alarmists that focus on mankind’s release of CO2 into Earth’s atmosphere as being the primary driver of “climate change”.
As for your comment
“but the cause will always allude a sociopath such as yourself.”
Again congratulations, but in this case for demonstrating for all WUWT readers to see the wisdom of Socrates to whom is attributed this saying:
“When the debate is lost, slander becomes the tool of the loser”
The IPCC? what relevancy does that have to do with the truth. The name calling is from the hostility from our last engagement months ago, it has nothing to do with the truth. And debate, you have not entered into a context, and from my experience with you over the months, are incapable of entering into a context, that involves debate about radiative transfer, it’s not within you. In fact, in my experience with YOU, you have never provided an opinion about anything except others. That is you MO. Thats not name calling, its a fact not everyone is very smart and when they get off of their subject of expertise, they are wrong and usually disrespectful to the ones that do have a clue. So please, rub the Melon balanced on your neck and try to bring up something that even sounds like a point in a debate?
So many words. What’s your point?
“and try to bring up something that even sounds like a point in a debate?”
Something you have not yet managed to do.
Attributed
As usual, a complete travesty by Kenneth Richard
” (DSW) “is the primary driver” of modern warming”
No, they don’t say that. They say:
“We find that anomalous downward shortwave radiation is the primary driver though which the WTV influences the T2m over the western TP and adjacent Southwest Asia according to the GEWEX satellite data.”
They talk of variations both ways. They don’t say it causes warming. They don’t even say there was any warming on the Tibetan Plateau. When KR says:
“For example, the WTV-induced 11% decline in total cloud cover produced a 7 W/m² increase in DSW, explaining the 1.87 K regional temperature increase.”
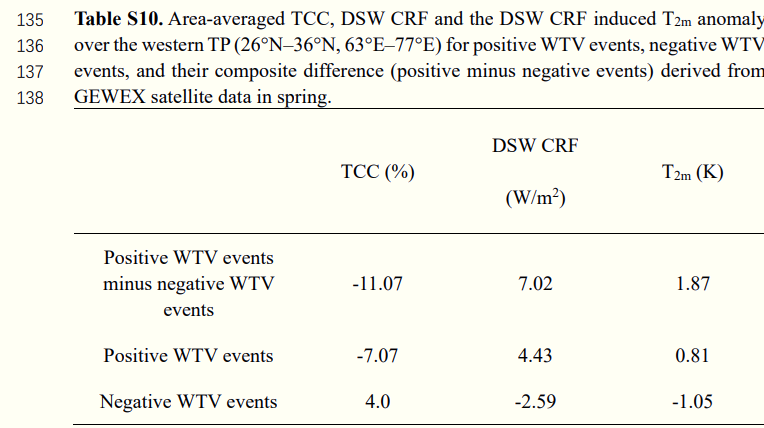
he is completely misreporting this table:
The 1.87K is the result of subtracting the effect of cooling events from warming events. It seems that cooling predominated. Anyway, it isn’t a warming figure.
It isn’t Carbon dioxide related at all.
That has to be something of a problem. It’s a no brainer, Nick. The Sun and the clouds.
“It isn’t Carbon dioxide related at all.”
It isn’t warming.
In fact, high plateaux reverse the local effect of CO2. Because the air above is not much cooler than the high surface, CO2 does not increase DWIR.
“high plateaux reverse the local effect of CO2. “
I’m sorry, but that’s utter bolleaux. You know it, and I know it. Still, a valiant attempt nonetheless.
OK, so I asked Google AI:
“does the greenhouse effect work on high plateaux?”
It said:
“Yes, the greenhouse effect works on high plateaux, but its impact is often diminished compared to lower altitudes due to lower air density and less water vapor.
On most high-altitude surfaces, such as the Tibetan Plateau, greenhouses gases still function by trapping heat that would otherwise escape into space. However, this is heavily influenced by regional conditions. “
OK, so I asked Google AI:
If you ask any AI it will tell you quite erroneously that renewables are cheaper than fossil fuels.
Thanks for the laugh.
When something is trapped, it doesn’t get out- like an animal in a zoo cage. The heat always gets out- possibly at a slightly slow rate but anyone using the word “trap” isn’t thinking like a scientist with careful use of wording.
Thank you. Add to your comment, heat is not energy, it is a flow of thermal energy. If it is “trapped” it no long flows and is not heat.
Heat is one of those context, fluid definitions, too often used in lieu of the concise scientific definition.
So its to do with less water vapour (even though mountains are often shrouded with clouds and get more rain)…. nothing to do with CO2. OK !!
“OK, so I asked Google AI:”
Of course you did. But you failed to notice that it was trained on the same garbage input that you were.
“trapping heat”
Physics doesn’t work like that, as Joseph pointed out. Another way to explain that is like this: either energy is being expended in the process of performing work, in which case it isn’t trapped; or it isn’t, in which case it isn’t heat.
Kirchhoff’s Law.
Less water vapor makes CO2 more effective, not less.
This is because water vapor overlaps most of the bands that CO2 absorbs at.
This is the source of the so called Arctic amplification that you and other warmistas usually cite.
Thank you Nick!
I’ve maintained forever that that there is no such thing as a “global climate”, but rather, there are hundreds, thousands of regional / locality climates all around the world, each doing their own thing, each influenced by their individual geological, meteorological, altitudinal, etc settings.
So the corollary to this observation is that sampling temperature stations recordings from all these different localities and “homogenizing / averaging” them all to construct a “global average temperature” is arrant nonsense.
““high plateaux reverse the local effect of CO2. “”
lol.. at what altitude does the effect of CO2 change from warming to cooling…
Odd that “the influence of the WTV is consistent across regions both above and below 1500m” (hardly a high altitude)
Methinks Nick is just making up nonsense to try, totally in vain, to present CO2 as having a warming effect. Even though it has never been observed or measured anywhere on the planet.
Nick once scored a major kudo for pointing out a serious error in an article. He has been seeking to reclaim that fame ever since.
I find it very odd that an Australian doesn’t understand that less cloud lets more of the Sun’s heat energy in.
Its as though Nick has lived all his life inside a sterile, air-conditioned office. !
“ the WTV-induced 11% decline in total cloud cover produced a 7 W/m² increase in DSW, explaining the 1.87 K regional temperature increase.””
Is NOT misrepresenting the report at all.
It is taken directly from the last yellow highlight in the abstract.
That highlight says nothing of the kind:
“Downward shortwave radiation (DSW) emerges as the primarily radiative factor modulated by the WTV via cloud radiative forcing (CRF) processes. Specifically, anticyclonic WTV events reduce cloudiness, generating positive CRF anomalies that enhancing surface DSW and cause warming. Conversely, cyclonic events increase cloudiness, producing negative CRF anomalies that diminish DSW and induce cooling. “
It says just what the table says. When WTV is anticyclonic, there is warming. When it is cyclonic, there is cooling. It doesn’t say that there has been warming overall, and certainly not by 1.87k.
As you quoted:
This specifically says that shortwave radiation drives the temperature.
It doesn’t say that CO2 drives the the temperature.
You also imply that water vapor is reduced, so that can not be a driver either.
Now tell what modulates the amount of downward short wave radiation. Is it the sun? Clouds maybe?
What this study shows is that when there is less cloud, it gets WARMER because there is more absorbed solar radiation.
And when there is more cloud, it gets COOLER because less solar radiation is absorbed
CO2 has zero measurable effect on clouds and hence, zero measurable effect on “the climate”
Most people with an IQ above room-temperature (pardon the pun) would consider a net increase of 7W/m^2 in downward shortwave (DSW) radiation to result in surface/lower troposphere additional warming, NOT cooling.
However, YMMV in your reality.
There wasn’t an increase of 7 W/m2. As the table says, there was an increase of 4.43 W/m2 during anticyclonic events, and a decrease of 2.59 during cyclonic events. The 7.02(=4.43+2.59) represents the total range.
Over the western TP ..
“ the WTV-induced 11% decline in total cloud cover produced a 7 W/m² increase in DSW, explaining the 1.87 K regional temperature increase.”””
That is exactly what it says.
Trying to mis-interpret a table to make it say what you want it to say, despite what is actually written….. seriously !!
The table says that positive events lead to a rise of 0.81C. negative lead to a fall of 1.05C. The range is -.81-(-1.05)=1.87C. The mean is -0.12C, ie negative. Nothing says overall warming.
The abstract says..
““ the WTV-induced 11% decline in total cloud cover produced a 7 W/m² increase in DSW, explaining the 1.87 K regional temperature increase.””
Perhaps you should contact the authors and tell them they have misinterpreted their own table. 😉
I have written the abstract below. It does not say that, or anything like it. It is an invention of Kenneth Richard.
“Abstract As the dominant atmospheric circulation pattern over the western Tibetan Plateau (TP), the Western Tibetan Vortex (WTV) exerts substantial control on springtime 2 m surface air temperature (T2m). However, its underlying radiative processes remain unclear. This study integrates GEWEX satellite observations with ERA5 and MERRA‐2 reanalysis, applying surface energy balance diagnostics to quantify the WTV’s radiative forcing on T2m variability. We find the WTV explains ∼66% of T2m variance (R = 0.81) across the western TP and the adjacent Southwest Asia. Downward shortwave radiation (DSW) emerges as the primarily radiative factor modulated by the WTV via cloud radiative forcing (CRF) processes. Specifically, anticyclonic WTV events reduce cloudiness, generating positive CRF anomalies that enhancing surface DSW and cause warming. Conversely, cyclonic events increase cloudiness, producing negative CRF anomalies that diminish DSW and induce cooling. These findings advance understanding of the radiative processes by which the upper circulations modulate the surface climate over the TP.”
The scanned page with the abstract says EXACTLY what Kenneth said it says. ! It is NOT an invention. !
The radiative forcing are PURELY from changes in cloud cover.. and nothing to do with CO2.
Kenneth Richard didn’t “invent” anything, but the image he posted makes it look like everything written there (including all the highlights) are part of the abstract. However, only the first paragraph is the actual abstract, while the figure following it, along with all the subsequent text, come from various parts of the rest of the paper.
The actual quote from the paper was “Specifically, a TCC reduction of
11.07% results in a DSW CRF increase of 7.02 W/m2, leading to the T2m rise of 1.87 K”
which is more or less what bnice2000 wrote. It just wasn’t in the abstract.
Nick wrote:
“I have written the abstract below. It does not say that,”
You are right, Nick, it doesn’t, but the body of the paper does. That is an extremely tiny nit to pick, even for you. Do you have an actual point? Because bnice2000’s point doesn’t depend on where in the paper the statement comes from.
“Nothing says overall warming.”
Sure it does. What do you think “rise of 1.87 K” means?
“The actual quote from the paper was “
That is not a quote from the paper. We’ve had bnice claiming it was in a highlighted section, and when that failed, in the abstract, but it just isn’t. It isn’t anywhere in the paper. It is a quote from Kenneth Richard, derived with total misunderstanding (or worse) from the Table S10 that I showed.
“That is not a quote from the paper.”
Well, now you are just flat-out lying. Or functionally illiterate. Or, possibly, both. Because it absolutely is. Here is the paper:
https://agupubs.onlinelibrary.wiley.com/doi/pdfdirect/10.1029/2025GL119603
And the sentence I quoted (via literal copy-and-paste) is on page 6, in the second paragraph of section 5, which is the last paragraph on that page. It’s the second-last sentence on the page, or the last complete sentence, in case you are still having trouble finding it. Note that for brevity I omitted the parenthesized part, which says “(Table S10 in Supporting Information S1)”.
“We’ve had bnice claiming it was in a highlighted section,”
Which it was, although he paraphrased it slightly
“and when that failed”
It didn’t
“in the abstract, but it just isn’t”
That is the only part of what you wrote that is true, but, of course, entirely irrelevant. If it makes you feel better, you can blame Kenneth for making his pasted collage look like it came entirely from the abstract, which it doesn’t
“It isn’t anywhere in the paper.”
False, and very obviously so, requiring about 5 seconds of research and a Grade 2 level of reading ability to confirm
“It is a quote from Kenneth Richard”
Also false
“total misunderstanding (or worse) from the Table S10”
That’s as may be, but it would be Wang‘s misunderstanding, then, wouldn’t it? Maybe you should take it up with him and his co-authors.
So less clouds during anti-cyclonic periods and more during cyclonic periods.
Temperature changes are all to do with the clouds.
And absolutely nothing to do with CO2.
The interpretation of the data here isn’t entirely clear. This seems to be a local phenomenon over Tibet. Similarly, we had something develop like this over the Colorado Plateau earlier this year, with an incredible high pressure dome covering the Four Corners. Now that the effects of La Niña are gone, there’s a chance for a strong May winter storm here this week!
“a strong May winter storm”
due to alarming climate change, of course /s
At this very moment I am watching white precipitation falling outside my windows in Colorado. As I’m headed to California in a few hours, I hope to miss the worst of it.
The problem lies within seeing the big picture. Most humans are not good at it, they will hammer a specific cause to death and will be completely unable to link that cause to the overriding effect of the forcing that is responsible. In this case, it’s been all over the news that SO2 emissions have been falling because of clean air initiatives to the 3Rd world (Apparently all the coal plants China has been building this millennia are not emitting as much SO2 as in the past.
Ocean shipping, since 2010 80% of the Sulfur Emissions have been removed from the global shipping fleets exhaust plume. Sulfur Dioxide causes cloud tops to reflect more sunlight and SW radiation into space, before it reaches the surface. Currently more sunlight and SW radiation is reaching the surface and ocean depths than has since the industrial revolution began. And we are still under a significant amount of anthropogenic cooling, by my modeling as least -0.25C.
And then, there is the 1000 lb. Gorilla in the room. One hundred billion gallons of water vapor (at current rates) are being exhausted in the Tropopause/Lower Stratospheric boundary by commercial aviation / we the people, each year.
But, but, but, we need a simple social definition for the “climate control knob.” 😉
On average, Earth’s atmosphere contains approximately 37.5 million-billion gallons (3.75E16) gallons) of water vapor, according to Live Science and the Weather Guys.
So 100/(3.75E7) = 1/(3.75E5) = 0.0000027 = 0.00027% . . . I should worry about that?
Not even a baby Pygmy Marmoset “in the room”.
No, the stratosphere is dryer than a bone in the Sahara Desert, you do not get to cheat nature by flying above the weather to avoid turbulence. Now go to bed clueless.
The only thing more grossly exaggerated than CO2’s putative influence on global warming is SO2’s influence on global cooling.
Let’s look at SO2 measure over the USA , compared to temperature trends.
(ppb numbers are estimates from the chart below, amounts added from data from someone else, I can’t remember who).
From 174ppb in 1980 to 89ppb in 1998, (a decrease of about 14.7 million tons)
UAH USA48 shows no warming or cooling
.
SO2 dropped from 79ppb in 2005 to 24ppb in 2015.. (a decrease of about 8.1 million tons)
According to USCRN and UAH USA48 there was no warming or cooling.
—-
The SO2 cooling conjecture is not supported by measured evidence over the USA.
“sunlight reaches the ocean depths”?
Since when was ~ 30 metres “the ocean depths”?
Can you swim, holding your breath, to 30 meters?
I agree, “depths” requires a qualified definition.
I got down to about 25 ft on a snorkeling dive once on the Great Barrier Reef.
The dive boat crew reckon underwater visibility that day was ~ 60ft – the best they’re ever seen out there they reckon.
The white sandy bottom was just discernible at the base of the coral wall I was fascinated by. For me it was a sacrament.
But definitely not bathed in “sunlight”
I’ve made 20 ft. Pressure on the ears resulted in a fungal infection.
There are places where I have seen the ocean floor with the water deeper than 60 ft.
It still plays back to needing a qualified definition of depth in the article.
There are studies that demonstrate the optical depth of water can be 200 ft.
For “sunlight” I interpret “bright, reflective”, not just “offering visibility”.
You’re right – “depths” is open to all manner of interpretations.
That plateau averages 4,500 meters high. I’m sure they’ll appreciate a slight warming.
‘Over southwest Asia, or the Tibetan Plateau, scientists (Wang et al., 2026) indicate the satellite-observed increase in downward shortwave (DSW) “is the primary driver” of modern warming.’
How does a satellite observe DSW, or downward anything else for that matter?
By measuring both incoming SW and reflected SW. The difference is the DSW.
That assumes all reflected is on the same narrow vector upward, rather than scattered by say rocks and trees and terrain slope.
And likewise that the solar energy in the downward vector (satellite nadir) basically reaches Earth’s surface without being scatter by atmospheric gases (ref: Rayleigh scattering), ice/rain droplets, aerosols and particulate matter suspended in Earth atmosphere.
The way I would do it is to have the smallest aperture I could in order to measure the reflection that occurs at at 90°. That would require the sateiilte to be over a point where the sun was at 90° also.
Just do not perform the measurement over the Andes.
Or the rain forest.
‘By measuring both incoming SW and reflected SW. The difference is the DSW.’
I’d love to see the error bars around that calculation. But my main objective, other than to have a bit of fun, was to point out that unless someone has invented a ‘Poynting meter’ and put it into orbit, the claim that they’re measuring energy flow is specious.
One can measure the incoming solar EM energy and one can measure the EM energy reflected by the clouds. It is not that simple, but that may be what they did.
No. I did not read the report.
Personally, I don’t think they’re measuring what they think they are.
You understand.
All they can measure is “power developed by the Sun onto the sensor in the satellite”, at whatever temperature that sensor is (and they won’t even tell us, at least not that I’ve been able to find). That of course is not the same as “power developed by the Sun onto the highly variable surface or atmosphere of the Earth”. It’s more accurately described as a proxy measurement of the temperature of the Sun, which is itself variable. (The satellite sensor temperature might be too.)
We already knew this was happening from Willis’ analysis of CERES data over a year ago. It’s not just in Tibet, it’s global. As Willis showed, all of the warming we’ve seen in the 21st century was due to an increase in solar energy reaching Earth’s surface.
https://wattsupwiththat.com/2025/01/22/greenhouse-efficiency-2/
Since the CERES data used was from 2/2024, it seems like an update would be nice. We’ve now gone over 2 years and it would be interesting to see if the cloud cover increased in 2025. It appears an update to cloud data was supposed to be released March 30, 2026. Don’t know if it was.
One of the main drivers of clouds appears to be related to the 64±4 year cycle. The warm phase started ~1995-97 so we are due for a change into the next cool cycle soon.
My hypothesis is this cycle is driven by natural Arctic sea ice variations which controls the amount of cold air in the Arctic. The amount of cold air changes the position of the polar jet stream. Since clouds tend to form near this jet stream, when it moves further south its coverage increases and you get more clouds.
It is interesting that the NASA information on CERES indicates that the estimated energy imbalance is enveloped by the CERES acquisition tolerance and error budget.
EEI is a different animal. It eliminates the intensive/extensive argument associated with global temperature, but has little other real value.
When Willis came up with greenhouse efficiency (Gef), he gave us a measure for the full effect of changes to Tropospheric composition over time. What he showed is the energy level is maintained at a constant percentage above the amount of solar energy absorbed. This increase is often referred to as the greenhouse effect, but it’s even more.
Gef includes effect of things like SO2 and other non-GHGs. In many ways it is showing the exact same result as seen in Miskolczi 2010. Miskolczi stated the Troposphere had a preferred opacity which was controlled by water vapor. That is, as other components changed, water vapor adjusted to return the Troposphere to this preferred opacity.
This is also why it takes stratospheric injections of SO2 to cool the planet. It also explains why other aerosol pollution has no effect either.
Many skeptics panned Miskolczi’s work which helped alarmists ignore it. That was a mistake. Gef is essentially validation of Miskolczi’s work which itself refutes all climate alarmism.
Third paragraph in the above article:
“For example, the WTV-induced 11% decline in total cloud cover produced a 7 W/m² increase in DSW, explaining the 1.87 K regional temperature increase.”
And this was just for the noted, limited area of study, not a value representative of the whole of Earth’s surface as cloud coverage varies.
OK, class, let’s keep that recent scientific observation, particularly its magnitude, in mind as we revisit the Trenberth-style, assumed-steady state calculations of Earth’s energy imbalance (EEI)—which is actually a calculated input-versus-output radiation power flux imbalance—to be a value of 0.6 to 0.7 W/m^2 net incoming. Claimed precision to a value of +/- 0.1 W/m^2 for any given calculation. . . yikes!
References:
https: the EEI diagram at https://wattsupwiththat.com/2026/03/31/toa-eei-versus-surface-net-flux/ gives a net absorbed value of 0.6 W/m^2;
the EEI diagram at https://wattsupwiththat.com/2026/04/13/at-the-heartland-climate-conference-what-is-the-proof-earths-energy-imbalance-edition/ gives a net absorbed value of 0.7 W/m^2.
“that recent scientific observation”
It was not a scientific observation. It was just Kenneth Richard making it up.
In his above article, Kenneth Richard specifically includes a screen-shot of the Jingzhi Wang et. al. GRL-published science article that specifically cites in its very first paragraph:
“This study integrates GEWEX satellite observations with ERA5 and MERRA-2 reanalysis, applying surface energy balance diagnostics to quantify the WTV’s radiative forcing on T-sub 2m variability.”
I fully appreciate that you may have a disability in reading comprehension at this level.
That is quite different to what you quoted:
“For example, the WTV-induced 11% decline in total cloud cover produced a 7 W/m² increase in DSW, explaining the 1.87 K regional temperature increase.”
Your latest quote just says that the WTV influences T. It can blow hot or cold.
Hmmm.
Sun heats surface, warmed surface produces clouds sans GHE hocus pocus.
The global coupled energy systems are basically thermal engines. Clouds are the governor of those engines.
Don’t forget the sun, as it can drive clouds via the Svensmark effect by blocking cosmic rays when the sun is more active, thus reducing the atmospheric ionizing effect, and thus reducing clouds.
Governor in the metaphor is allowing or not allowing energy to power the thermal engine.
Cosmic rays are definitely part of it.
so now it’s not just my F150 and backyard grill, it’s my ham radio station too. *facepalm*
Amusing that Richards paints this study as a repudiation of global warming due to anthro emissions of GHGs.
It is a natural and recurring weather process ( eg as is ENSO ), a dynamical effect within the Earth’s atmospheric circulation caused by extreme differential topography and temperature feedback as a result.
Nor does the study go anywhere near analysing whether the incidence of anticyclonic events is increasing at the expense of “cyclonic” ones.
What it boils down to, is the remarkable deduction that temps are warmer under a high than under a low. Because sinking air in a high warms and evaporates clouds leading to more sunshine.
“Key Mechanisms for Spring Anticyclone Formation over the Tibetan plateau:
All cyclones and anticyclones, the major atmospheric features, are vortices (pl vortex)
All tornadoes and hurricanes and cyclones are vortices too.
They are all manifestations of mass movement of matter from the equator of a rotating sphere towards the poles of that sphere.
Whatever is happening in this whirling about of matter is a CONSEQUENCE, NOT A DRIVER, of dynamic changes in the distribution of different properties of the matter, in this case, as a shorthand, changes of density due to changes of heat content.
Also, ALL energy transfer within the solid planet, its oceans and its atmosphere is by means of CONDUCTION, CONVECTION and RADIATION.
This “study” is a pastiche of shocking anti-science, pig-ignorance of undergraduate Physics of circular motion and thermodynamics.
“ALL energy transfer within the solid planet, its oceans and its atmosphere is by means of CONDUCTION, CONVECTION and RADIATION.”
Ummm.. you forgot the biggy ….. Bulk WATER and AIR transport of energy!!
Or do you pretend that ocean currents and winds do not exist and/or do not move energy.
Good points.