
From the Global Warming Policy Forum, 22 January 2016
The data for the global temperature of 2015 is in, and its a shattering record. It is claimed that global warming has resurged, terminating the warming ‘pause’ for good. But an important factor has been downplayed and one ignored altogether.
Essay by David Whitehouse
Nasa says that 2015 was 0.13°C+/-0.10°C above 2014. The UK Met Office said that 2015 was 0.18°C +/- 0.10°C above 2014. Noaa says 2015 was 0.16°C+/-0.09°C warmer than the previous record which was 2014.
Noaa had only one month in 2015 cooler than the same month in 2014 – April. According to the Nasa data four of them were cooler than 2014 (April, May, Aug, Sept) whilst Hadcrut4 had eleven months warmer than 2014 with April tied. For September 2015 Nasa has it 0.08°C cooler than 2014 whereas Noaa has it 0.14°C warmer!
Despite what some scientists have said the large increase over 2014 is far too great and swift to be due to a resurgence of forced global warming. It must be due to short-term natural variability, and you don’t have to look far to find it. 2015 was the year of the El Nino which boosted the year’s temperature. (In the Nasa press conference about the 2015 global temperature see how long it takes the presenters to mention the El Nino).
“We are seeing an extreme climate state,” Randall Dole, a meteorologist working for Noaa, told the Journal Nature this week. He was commenting on the recent El Nino which is one of the strongest on record, with ocean temperatures reaching as much as 3°C above normal in parts of the central and eastern Pacific. It was unsurprising then that Nasa on releasing its global temperature measurements made reference to it. “Only once before, in 1998, has the new record been much greater than the old record by that much.” This clearly because 2015 was like 1998 a strong El Nino year.
One point to notice however is that even without the El Nino that made the fourth quarter much warmer than the preceding three 2015 would have been a record for the Nasa data. If the first six months of the year had been repeated then it would still have set a record. Curiously though no single month during that period (indeed up to September) set a record for that particular month demonstrating how close the global temperature has been over the past decade or so.
A Little Bit On Top
If the El Nino dominated the last part of the year another example of natural variability was dominating the earlier months. The reason for the first nine months of 2015 being collectively warm can also be found in the Pacific. As I reported in September 2015 conditions in the north Pacific were unprecedented in 2015. The Summer warmth of 2014 had not dissipated. Indeed since 2013 the so-called Pacific “Blob” has kept a million square km of ocean 3°C above normal, (indications are that as of January 2016 the blob is beginning to dissipate.) “The temperatures are above anything we have seen before,” said one scientist in my article.
So 2015 was an exceptional year for weather, which is not the way some scientists presented it. None of them mentioned the “blob” and as for the El Nino it was the “little bit on the top” merely a minor contribution. Most of the temperature rise was down to forced global warming, they said.
This is all slight of hand, and a little inaccurate. The IPCC says that just over half of the warming since the fifties is forced so most of the contribution to 2015′s temperature is natural variability. In addition the factor that makes 2015 warmer than its previous years is not a resurgence of forced global warming but the “blob” and the El Nino.
One can speculate what the temperature of 2014 and 2015 would have been without the blob and the El Nino. Some scientists have said it made only a few hundredths of a degree difference, others have said it makes a few tenths of a degree difference.
I think the few hundredths of a degree suggestion is wrong. So can the combined “blob” and El Nino account for the 2015 temperature excess of 0.13, 0.18 or 0.16°C depending on your choice of data set? It could. Indeed without the “blob” and the El Nino 2015 could have been cooler than 2014. Without the “blob” 2014 could have been cooler than 2010.
This makes suggestions that the “pause” in annual average global surface temperatures has been “terminated” premature. The “pause” will not be ended by weather but by forced global warming. Consequently it is unsafe to use 2015 in any trend analysis to eliminate the “pause.” It is essential to view the 2015 along with subsequent years to catch the cooling La Nina effect. Only this way can the El Nino contribution be properly assessed.
The main conclusion that can be drawn about 2015 is that it was a truly exceptional year for weather, and for misleading press releases.
Sleight of hand, not slight.
[That depends on how big the sleight is, and how large the handwriting on the slate is that slights the records. .mod]
At no stage did the hand leave the wrist.
Time to wipe the sleight clean!
Just wait until 2017 when they readjust all the temps. These temps are incorrect as they always have to readjust them, yet at the same time they are very precise to the tune of .00001 degrees.
That’s a lot of sig figs. Interesting their claim of records are beyond what can be measured with precision.
Angels on the head of a pin.
RD January 23, 2016 at 12:18 pm
“That’s a lot of sig figs. Interesting their claim of records are beyond what can be measured with precision.”
It’s called False Precision Syndrome.
A serious and very widespread affliction amongst climate “scientists”.
I did not know that term, thanks. I do know if I did that in my chem or physics lab notebook, it would have resulted in something like -5 points per occurrence 🙂
“A tour guide at a museum says a dinosaur skeleton is 100,000,005 years old, because an expert told him that it was 100 million years old when he started working there 5 years ago.”
https://en.wikipedia.org/wiki/False_precision
11 temps (C ) from measuring an overnight min temp in a small area…….
11+10.9+9.8+8.7+7.6+6.5+5.4+4.3+3.2+2.1+1.0 = 70.5 / 11 = 6.4090909090909…(recurring) (C )
That’s what happens when you average a population
That “precision” does not imply a precision of the average minima there.
It’s just maths.
(in this case) you could always round it to 6.41 ?
That better?
I suspect 6.4 would be the answer you’d go with though.
The exercised avoids rounding errors.
Tone
For me – 6 +/- 1. But our watermelon friends will have 6.4091.
On a par with much of the rest of their ‘science’.
Auto
It’s not maths it’s arithmetic.
I’m sorry. The plural of math is math. Anyone or any country
that says otherwise is simply insane. That is all.
I do not recall ever hearing anyone say “maths” either Bill.
But lots of people say it nowadays.
Menicholas: “I do not recall ever hearing anyone say “maths” either Bill.
But lots of people say it nowadays.”
At this side of the Pond we always use the term “maths”.
When I worked as an analytical chemist, some of our customers wanted us to send them all the digits to the right of zero, that our software spit out (no matter what the actual precision was).
Should have been “to the right of the decimal point.” My bad.
Is that the temperature 1cm from the surface, 1m from the surface, 1000m from the surface? Are you measuring minimum temps during the day or maximum? Or the average of the min and max or the average of all the temps during the day? How many points across the globe are being used?
You would think an average would make all these things essentially become the same but no it doesn’t.
The ocean surface is quite different than land surface. We don’t measure land surface and we don’t measure the ocean at 1m above. Thermometers don’t compute daily average from thousands of readings during the day so there is no weighting for when the peak happened that day or the coldest point. It could have peaked at 100 but been 80 most of the day. These could all mean significant diffeences in terms of how it affects creatures.
From what I’ve read the minimum is rising faster than the peak temps which means temps are kind of moderating in a sense. What sense does it make to average sea surface with 1m land surface? GISS removes sea surface because it varies little. Also they eliminate ice cover because temps vary little. That seems odd.
Measurements by satellites of atmosphere only get the average thermodynamic heat in a range of the atmosphere but they do it equally across the globe. This seems like a better measure from a scientific point of view however it has not shown as much heat growing.
Since the ocean temps dont vary as much GISS estimates temp 1m over the ocean although virtually nothing lives in that 1m area and we have no data so they use land data and smooth it using the “homogenization” algorithm that produces an extra 0.35C heat on the land. Guess what you can find more “extrapolated” heat by doing this.
Result: 1998 no longer hottest year, 2010 no longer hottest year and neither the 1930s or 40s were warm time. No dustbowls happened, no record setting temperatures. Our thermostats were all wrong and misread.
No, there’s nothing wrong with this science. It’s all perfectly straightforward and above board.
2015 was the hottest year ever by a long shot. Shut up and believe.
Minimum temperatures are rising faster than peak temperatures.
Has it occurred to you that minimum temperatures are affected by the heat retention properties of bitumen, tiles, steel roofing, concrete and the increased density of housing in modern cities.
@ur momisugly MJW…I was thinking about what logiclogic was pointing out with the fact that the minimum temps have increased over the years. What makes sense to me is that this is due mainly to the warmth coming off of the oceans at night and being distributed by wind patterns. For example, in Northern California night time temps rose around 10 F around 12 days ago. On earth:nullschool it could be seen that surface winds had shifted to winds coming from further south that then traveled north towards Canada while hugging the coastline the entire way. That warmed the evening temps dramatically. My electric heaters started shutting off for longer periods of time before kicking back on. That was due to the wind pattern which started circulating warmth from the ENSO regions WNW towards Hawaii, and then swinging due north before reaching Hawaii. Another wind flow then carried that extra warmth NNE and so the Pacific Northwest warmed up, especially in the evenings. My young peach tree now has 3 inches of new growth on it.
I think Mr. 3xlogic is making an excellent point in a very Menicholas sort of way. Stop messin’ wit’ ‘im.
Please.
How do we know when and were these forcing’s are taking place .
In 2025, US aerospace forces can “own the weather” by capitalizing on emerging technologies and
focusing development of those technologies to war-fighting applications. Such a capability offers the war
fighter tools to shape the battlespace in ways never before possible. It provides opportunities to impact
operations across the full spectrum of conflict and is pertinent to all possible futures. The purpose of this
paper is to outline a strategy for the use of a future weather-modification system to achieve military
objectives rather than to provide a detailed technical road map.
http://csat.au.af.mil/2025/volume3/vol3ch15.pdf
Absolutely nothing unusual is happening and has happened, yet thousand of politicians and scientists paid by those very politicians, as well as shockingly ignorant media types, are running around screaming panic.
Hey Noo Yawk, how’s that “global warming” workin’ out for ya? 😉
Are you kidding, some are still shovelling last years global warming off their roofs.
If you take the satellite data from the beginning of this century – Jan 2001 – to date …?
http://www.woodfortrees.org/plot/rss/from:2001/plot/rss/from:2001/trend
No ‘global’ warming thus far into the 21stC.
Henry, using Gistemp extrapolated shows a very different trend line for the same period. How can the satellite data be so wrong? (/sarc)
I’d like to point out .13, .16 or .18 with an error range of +-.10 , and given the tendency to adjust high, in reality we are dealing with an actual change that is only in hundredths of a degree.
IOW – its a PR BS campaign (yet again!)
Kev
Spot on.
It’s all utter carp from those taxpayers pay to help us.
Not rip us off.
Auto
Can’t wait to see how they’re going to keep the game going a year or two from now when we get the next La Nina.
Same here. Look at what WZ is showing…http://www.weatherzone.com.au/climate/indicator_sst.jsp?lt=global&lc=global&c=ssta
and Tropical Tidbits sst…http://www.tropicaltidbits.com/analysis/cdas-sflux_sst_global_1.png
According to IPCC AR5 glossary and WMO climate is weather averaged over thirty years. I would take that to mean at least thirty years. So the “record” has to start no later than 1986. Better yet let’s go back three “climates,” 90 years or 1926.
I think a more useful period for defining climate is 60 years, because global instrumental temperature datasets show an apparently natural cycle that has been periodic within these datasets, with a period around 60-65 years.
That makes sense as the 60+ year pattern is half cool phase and half warm phase. That way one can see the average of the full cycle, instead of a peak point of warming or a low point after a cooling trend.
For global temperature, there have been 16 record high years since the beginning of the instrument record; the last record low was in 1908. That doesn’t sound like just “weather” to me.
Trafa but first you need to correct the temperatures for the LIA rebound and then see how many of those 16 record highs survive and how many new record lows enter.
CAGW is about the impact of Humans not the impact of natural changes such as LIA rebounds etc.
In the mantra of the IPCC any misfortune suffered by man due to nature is to be celebrated.
What does an LIA rebound mean? The earth’s climate changes as a result of forcings and changes in forcings. Which particular ones are you referring to when you say the LIA rebound?
L.I.A.=Little Ice Age. Recovery/rebound from the LIA
Define “forcings”. Please.
I have no idea what that means.
Does this sound like weather – or dramatic climate change. From National Park Service report on the Exit Glacier (Obama’s fairy land): http://www.nps.gov/kefj/learn/nature/upload/The Retreat of Exit Glacier.pdf
“The Little Ice Age (LIA) was a time of global cooling from approximately 1350 to 1870 AD. During this time glaciers expanded in the northern regions, moving down the mountains and scouring the vegetation that had been in the valleys below. Park Service personnel recently discovered evidence of a buried forest dating back to at least 1170 AD high in the Forelands near the current glacier’s edge. Exit Glacier advanced from the Harding Icefield during the Little Ice Age, burying this existing forest and advancing to a maximum marked by the terminal moraine dated to 1815.
With the warming trend of the 1800s, Exit Glacier began to retreat from its 1815 maximum. Very slowly, the glacier retreated 230 feet (70 m) from 1815 to 1889, averaging about 3.1 ft/year (1 m/yr) (see Table 1). The glacier then retreated much more rapidly between 1889-1899 . .”
How much longer do we need to stay this warm, or warmer, for those trees to take root and grow into a mature forest?
Are we there yet?
I see what you mean. That sounds to me like the peak of a warm phase. Let’s see where the next cool phase and La Nina take us.
“The IPCC says that just over half of the warming since the fifties is forced so most of the contribution to 2015′s temperature is natural variability.”
The IPCC can say anything they want – doesn’t make it true. If one allows themselves to abide by their statements, you have fallen into their trap and you have lost any sense of due diligence.
How many degrees of accuracy do they rate that statement?
What is certainly inaccurate is the quoting of the IPCC.
GISS and NOAA have already demonstrated that they will adjust their temperature record beyond the parameters of their own error bars and so why should anyone believe their measurements of surface temperature now are any more accurate?
Once again why are we debating these temperatures, the hiatus/pause/lull/stasis? The CAGW cabal are using surface temperatures to demonstrate that CO2 is warming the atmosphere. That’s like really bas-ackwards!
Anthro CO2 is trivial, CO2’s RF is trivial, the GCMs are worthless.
According to IPCC AR5 the atmospheric CO2 concentration increased by 40%, from 278 ppm around 1750 to 390.5 ppm in 2011, a difference of about 240 GtC, aka the hockey stick/blade. How they know this is based on WAGs, SWAGs, assumptions, and “expert” opinions. The foregone assumption is that this increase cannot possibly be caused by natural variations therefore it must be due to mankind, i.e anthropogenic sources.
In the same time frame IPCC estimates/WAGs/SWAGs/assumes/opines that anthropogenic sources added about 555 +/- 85 GtC (+/- 15%!!). That’s twice the increase and a problem IPCC et al have been trying kick under the rug.
IPCC AR5 Table 6.1 partitions this 555 GtC anthropogenic source (375 +/- 30 FF & Cement, 180 +/- 80 land use) among the various allegedly invariable natural sinks (rugs) and sources.
IPCC AR5 Table 6.1………GtC……..+/- GtC……..+/- %
Anthro Generation………555………….85……….15.3%
FF & Cement……………….375………….30…………8.0%……..67.6% (more than just coal)
Net land use………………..180…………80……….44.4%……..32.4% (never mentioned)
Anthro Retained………….240…………10…………4.2%………43.2%
Anthro Sequestered……-315………………………………………-56.8% (spontaneous sinkage)
Ocean to atmos…………..-155………..30……..-19.4%
Residual land sink……….-160…………90……..-56.3%
So the CO2 increase between 1750 & 2011 that cannot possibly be ‘splained by natural processes (Considering the huge uncertainties how would they even know.), but natural processes can easily ‘splain sinking and sweeping half (43%) of the anthro contribution under the rug.
The amount of CO2 that the atmosphere gained is well known, and the amount of carbon in fossil fuels that humans burned is fairly well known. Atmospheric CO2 gain is less than human contribution – nature has been as a whole removing some of the CO2 that humans added.
The big natural sources and sinks that are much greater than human contributions are seasonal ones that largely cancel each other out within any 12 month period.
CO2’s RF ???
Nasa says that 2015 was 0.13°C+/-0.10°C above 2014 —
That margin of error is like saying 13C +/- 10C or between 23C and 3C. That’s the difference between summer and winter.
There’s NASA/GISS, and then there’s the real world: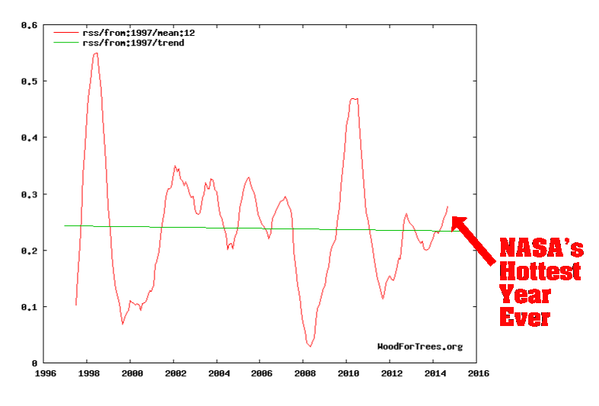
dbstealey
Nice one!
Ahhh Db like temperatures (RSS) adjusted by a GCM.!!!
endorsing GCMs now?
Great evidence, D.B. Stealey.
That the RSS is calibrated (“adjusted”??) by a GCM (given that that GCM, like those the IPCC uses, runs hot) makes the RSS data even MORE powerful testimony against AGW. That is, even so, RSS still shows, per Werner Brozek (and Just the Facts):
(Source: http://wattsupwiththat.com/2015/04/09/rss-shows-no-warming-for-15-years-now-includes-february-data/ )
“There’s NASA/GISS, and then there’s the real world:”
There is the troposphere, and then there’s the real world that I live in.
Well, Mr. St0kes, in the real world, RSS is reporting a STOP in warming — at what-EVER altitude you are. The example was given merely to show that RSS’ being tuned using a GCM hasn’t made RSS run hot and, moreover, that it is STILL flat, makes it good evidence (with a plausible likelihood that RSS would be NEGATIVE now, but for the GCM calibration).
Nick,
The ‘real world’ that each of us lives in is clearly idiosyncratic. Your head may not be in the clouds but your feet are not firmly on the ground.
It appears that your reality is 70% based on sea-water from depths that would drown you and only 30% on the air over diverse terrestrial surfaces (not to mention imaginary ones).
“There is the troposphere, and then there’s the real world that I live in” -(Nick Stokes)”.
OMG, Nick, the troposphere extends down to the surface of the planet. Very few people if any live outside of the troposphere. The troposphere is where the majority of the earth’s weather and climate takes place.
So Nick does not live in the troposphere. Where, pray tell, DO you live? Maybe you live in the stratosphere where lack of oxygen has dulled your brain. Or perhaps you live below the earth’s surface? Inquiring minds want to know.
“There is the troposphere, and then there’s the real world that I live in.”
Apart from the stupidity of that comment that mebbe pointed out, do you realise that the models are designed so that the extra energy that is absorbed by the troposphere has to warm the 2m above the land before the energy leaving the Earth is once again the energy coming in?
The lower troposphere TLT measurement of RSS is centered on 650Mb, or about 14000 ft.
Janice Moore.
“The example was given merely to show that RSS’ being tuned using a GCM hasn’t made RSS run hot…”
I don’t think anyone is saying the RSS data uses a GCM.
My understanding the the microwave radiance measured by the satellites is used to compute a global mean temperature estimate by using a physical model.
An issue with the discussion of models is not many say which models they are talking about. There are lots of models
Janice Moore.
Just some advice. Do not trust anything from Steve Goddard unless you can confirm it yourself, he has a bad track record. His chart is misleading straight away because he does not show the full RSS record. I will have a look myself because WFT does have an excellent user interface.
The El Nino spike in the RSS data set is still months away, going by history.
http://images.remss.com/msu/msu_time_series.html
Janice Moore.
The Steve Goddard chart only goes to June or July as far as I can tell.
The WFT average function is good, it is using a rolling average. So a 12 month average data point is computed from the trailing and leading 6 months of data. That is reasonable. Others use a calendar year average, not a rolling average. The El Nino spike results will be more accurate once 2016 is completed.
http://www.woodfortrees.org/plot/rss/trend:1/plot/rss/mean:12
I might have to make it a little more easier to follow. Heat absorbed by troposphere leads to a tropical hot spot->hot troposphere->hot surface->hot ocean. The penultimate one can’t show AGW without it showing up in the first two. The deep ocean can’t just eat the heat above the immediate surface.
Figure 7 of http://www.drroyspencer.com/2015/04/version-6-0-of-the-uah-temperature-dataset-released-new-lt-trend-0-11-cdecade
shows radiosonde readings of the very lowest troposphere warming about .02, maybe .03 degree C per decade more than the satellite-measured lower troposphere over the period of the satellite record.
Nick, then why use the ocean temps?
Who lives there?
What am I missing?
NOAA reported the average global temperature in 1997 as 62.45F (16.9C)
https://www.ncdc.noaa.gov/sotc/global/199713
and 2015 as 58.62F (14.79C)
https://www.ncdc.noaa.gov/sotc/global/201513
“What am I missing?”
A thread from just two days ago.
Do you seriously think NOAA is saying that the global temperature has dropped by more than 2°C since 1997? When did it happen?
Where would we be without these NOAA /climatology/peer reviewed experts? /
Golden, “Nasa says that 2015 was 0.13°C+/-0.10°C above 2014 —”….
If those same NASA folks will invest their retirement money in my current project I will give them an absolute guaranteed return of 13% (+/- 10% of course).
You must understand Warmist tactics. You can fool some of the people all of the time, but you can’t fool all of the people all of the time.
According to warmists Weather IS and IS NOT the climate. As you scroll down this list you will indeed see this statement being used against sceptics. But half-way down you will see they ALSO say that the weather is the same as climate (under their ‘special’ circumstances.). I got their number a loooooong time ago. PS check out the hilarious Geoge Monbiot. LOL!
————————
Now what do I see here?
——————————————
Thanks for a well reasoned article, but I’m uneasy about “conditions in the north Pacific were unprecedented in 2015“. Do we really know that the blob has appeared for the very first time? It seems more likely that the blob is a recurring phenomenon and that only now have we noticed it. Like the ozone hole a few decades ago, for example.
Mike,
May I suggest – instrumentally unprecedented?
As you suggest – we probably haven’t noticed previous Blobs . . .
Certainly, if it is a century-plus phenomenon, it is unlikely that it would have been noted I latest 19th/Early 20th Century.
Auto
from the Columbia River where the return of Chinook Salmon embarrassed all the tear down the dams crowd with very high numbers it was finally conceded by the biologists that run strength currently had more to do with what is going on in the Ocean than the River and that end of the salmon life cycle is much less well studied. Those parameters that have never been assessed or looked at can knock the heck out of a theory or plausible story. Those pesky unknown unknowns.
Ask the salmon and other fish. Surely their patterns of distribution will reflect water temperature because they have no choice but to respond. Has anyone monitored these migrations recently and then checked the historic fish catches for similar patterns?
The demise of the salmon runs had everything to do with the invention of fish radar around the late 1960s. Other issues were with some of the dams which were built in the 1950s were supposed to have fish ladders installed. Then after the dam was well under way, the fish ladder was never installed. As an example I would point to the salmon runs on the Trinity and Klamath rivers. The first and only time that I ever saw a full salmon run was in August of 1957. My dad took us on a fishing trip to fish for steelhead on the Trinity river. I can still picture the first sighting of a run as my dad pointed them out to us. Looking downriver, the entire river was boiling from bank to bank for a stretch of around several hundred feet. This swarm of fish moved on past us and up river. Around 10 to 15 minutes later here came the next surge. This process went on for around 5 hours that day. The next year they finished the dam on the Trinity in 1958. I have never seen fish runs of that magnitude since then. Although, the runs were still decent up until the late 1960s. Then fish radar became available for everyone including the commercial fishing fleets. I remember at the time reading in the newspaper of the wonderful scientific breakthrough of finally being able to solve the mystery of where the salmon went after leaving the rivers and streams.Up until then that was unknown. Unfortunately, the wonderful scientific discovery also meant that factory fishing fleets could now track and follow the salmon everywhere they went. That is what happened to the several million salmon, steelhead, striped bass, and sturgeon who used to enter the San Francisco Bay on their way to the Sacramento river and other tributaries to spawn every year. I stopped fishing for steelhead in 1978 as it was sad to see the demise of those beautiful and superb fighting fish. Steelhead were known as one of the best fighting fish of anywhere in the world.
The “Gore effect” has now hit NOAA and GISS as the short lived, manipulated and scientifically flawed claims of the 2015 “highest temperature ever” is greeted by days of cold and massive snow over the east coast including Obama’s climate alarmist fantasy dominated White House. Mother Nature is showing who is really in charge of global climate and it’s not the clueless government climate “scientists”.
Ya think? Once in awhile this cabal of self-terrified nerds ought to try actually going OUTSIDE.
David Whitehouse,
I don’t find any direct quotes in the body of the article, nor in the links provided, of “some scientists” saying that 2015 marks the termination of “The Pause”. Perhaps you’d be so kind as to provide them?
In the meantime, we can look for ourselves. Here’s the NASA release about 2015’s record-setting high global surface temperatures: http://www.nasa.gov/press-release/nasa-noaa-analyses-reveal-record-shattering-global-warm-temperatures-in-2015
Most of the warming occurred in the past 35 years, with 15 of the 16 warmest years on record occurring since 2001. Last year was the first time the global average temperatures were 1 degree Celsius or more above the 1880-1899 average.
Phenomena such as El Niño or La Niña, which warm or cool the tropical Pacific Ocean, can contribute to short-term variations in global average temperature. A warming El Niño was in effect for most of 2015.
“2015 was remarkable even in the context of the ongoing El Niño,” said GISS Director Gavin Schmidt. “Last year’s temperatures had an assist from El Niño, but it is the cumulative effect of the long-term trend that has resulted in the record warming that we are seeing.”
That doesn’t look like myopic focus on a single year to me. Nor does it look as if NASA are “downplaying” the role of El Nino in 2015’s record-busting warmth.
No mention of “pause” or “hiatus” in that link.
Here’s the MET: http://www.metoffice.gov.uk/news/releases/archive/2016/2015-global-temperature
No mention of “pause” or “hiatus” in that link. Looks to me like the strong El Nino’s role in 2015 temperatures is appropriately noted AND put into context with observed long-term trends due to human influence.
Why did the forecast in 2014 predict that 2015 was “very likely to be one of the warmest years in the record”? http://www.metoffice.gov.uk/news/releases/archive/2014/2015-global-temp-forecast
The potential increase in global mean temperature in 2015 is expected to be based on the ongoing warmth of the tropical Pacific Ocean, weak El Nino conditions, the warmth of the Arctic and the ongoing increase in greenhouse gas concentrations.
Looks to me like the MET didn’t “downplay” El Nino when they looked back at 2015’s record-breaking warmth, neither did they neglect to mention it as a potential factor when they (correctly) predicted in 2014 that 2015 was likely going to break records.
Global warming “pausing” and “resurging” is a concept I see mainly being promoted by folks who reject AGW for whatever reason. Speaking of factors which are often downplayed or ingored altogether, I certainly don’t think of AGW moving in fits and spurts over the past two decades because about 93% of the energy being retained goes into the oceans …
http://climexp.knmi.nl/data/itemp2000_global.png
… and they have seen accelerating rates of warming throughout the entire “Pause”.
Great comment!
cg, Brandon
Databases vary.
Some disagree with yours.
The oceans, strangely, per satellites, appear not to follow your prescriptions.
I don’t know why.
As the science is settled, please could you help me?
Thanks
Auto
@auto
Perhaps you could point to the ocean satellite data you are referring to?
Auto: Hope this is helpful to you in answering cgs:
Dr. Judith Curry (quoted by Bob Tisdale, here: http://wattsupwiththat.com/2015/06/04/noaancdcs-new-pause-buster-paper-a-laughable-attempt-to-create-warming-by-adjusting-past-data/ )
Reynolds OI.v2
UKMO HADISST
ICOADS
are used and discussed by Bob Tisdale here (and many other places): https://bobtisdale.wordpress.com/2015/11/21/the-differences-between-sea-surface-temperature-datasets-prevent-us-from-knowing-which-el-nino-was-strongest-according-nino3-4-region-temperature-data/
If cgs is genuinely interested in learning about ENSO data, he or she will read Bob Tisdale’s e book:
Who Turned on the Heat
Discussed by Tisdale and available here: https://bobtisdale.wordpress.com/2012/09/03/everything-you-every-wanted-to-know-about-el-nino-and-la-nina-2/
cgs,
Did you notice the conclusion?
Global warming “pausing” and “resurging” is a concept I see mainly being promoted by folks who reject AGW for whatever reason.
There isn’t a single measurement of AGW. Me, I think it exists, but since there are no measurements it must be very small. Other forcings swamp AGW.
Without dangerous AGW there’s no climate scare. So the alarmist crowd must play that card. If they admitted the truth no one would care, and more deserving areas of science would be funded instead.
It’s amusing to watch the true believers argue against observations, against satellite data but for surface station data that’s 2º – 5ºC out of tolerance, and to absolutely cherry-pick every factoid, and accept or reject it based on whether it feeds their confirmation bias.
One thing the alarmist side is not doing, and that’s honest science. They are as far from being skeptics as anyone could imagine. See, skeptics of the DAGW conjecture have nothing to prove; the proponents have the onus.
They have totally failed. After decades of searching, they can’t quantify AGW. If someone or some group was able to do that, there would be a Nobel prize in it, with fame, fortune, and status following close behind. So the carrot is there, and it’s a big carrot.
But the stick has been avoided through green politics, lobbying, and their lemmings insisting against the complete lack of evidence that runaway warming must be right around the corner. Worse, now they’re just lying outright about it, saying satellite data is bad, and global warming never stopped, and windmills are a good thing indeed.
We’re past the point of discussion. When people will lie about observations, it’s best to disregard what they say. Just look at the observations. What do you see?
If you’re honest you will say that there’s nothing unusual happening with global temperatures (unless they’re unusually benign). Absolutely none of the alarming predictions have ever happened. In any other setting the people making those predictions would be considered fools, and a laughingstock. In any other science field they would have admitted their conjecture had failed long before this.
But they’re bought and paid for rent seekers. They sold out for the loot, for politics, for status, and whatever other reasons that trump honesty and ethics.
You can always find someone who will lie for money. It’s called fraud. But now they’re treated like heroes, by ignorant fools who don’t know CO2 from carbon. What a world.
https://www.washingtonpost.com/news/capital-weather-gang/wp/2016/01/22/updates-snow-arrives-in-the-washington-region/
There is a live feed from the Washington post building in the above link
yeah,, like
cgs January 23, 2016 at 1:44 pm says great comment. ….
now you have a pair over fondled temperature data/anomalies, and I have 22 states with snow that children just aren’t suppose to see anymore. Whats trump?
michael
Mike the Morlock,
Going back to the NASA press release I cited previously:
The data set of 2014 surface temperature measurements is available at:
http://data.giss.nasa.gov/gistemp/
The methodology used to make the temperature calculation is available at:
http://data.giss.nasa.gov/gistemp/sources_v3/
So yes, NASA do “admit” that surface temperature measurements are adjusted. They tell us why they think those adjustments are necessary. And provide the code for anyone to inspect the method, or even run it themselves if they are so inclined.
I await you telling us exactly how much temperatures have been “over fondled” by their documented methods, and why.
Weren’t supposed to see any more? Whence this prediction that those 22 states weren’t going to be cold enough to experience snow during winter in this decade?
Since you apparently ignored the OHC plot I provided in my post and instead remain staunchly fixated on surface temps (which account for <5% of energy flux in the entire climate system), perhaps you should heed the advice Whitehouse intended for the unnamed climate scientists he claims are saying that 2015 signifies the termination of "The Pause" …
… or we could talk about how increased precipitable water in the atmosphere is NOT inconsistent with the observed warming in the oceans. We don't even need to agree on why the oceans are warming to talk through that one.
Brandon says: “I await you telling us exactly how much temperatures have been “over fondled” by their documented methods, and why.”
——————–
Does that request include possible explanations for previous gov’t. pronouncements that 2014 was the hottest ever, later revealed to have a confidence interval of ~32%?
Alan Robertson,
Brandon says: “Global warming “pausing” and “resurging” is a concept I see mainly being promoted by folks who reject AGW for whatever reason.”
————————
Oh. A promoted concept. Please clarify- are you implying that there was/is no pause?
How about we restore the full context of my initial comment?
Pretty clear to me that what I’m saying is that the test of AGW is whether net energy retained in the system is increasing or not, that the place we’d most likely see a “pause” in that process is the most massive heat reservoir in the system, and that I’m not seeing a “pause” anywhere in sight between 1997-2015 in that heat sink.
Other places? Sure. The perennial WUWT favorite (or was, until UAH v6.0beta) shows some slowdown in the lower troposphere:
http://data.remss.com/msu/graphics/TLT/plots/RSS_TS_channel_TLT_Global_Land_And_Sea_v03_3.png
However, RATPAC-A raidosondes for the lower troposphere …
http://3.bp.blogspot.com/-XMo1TbEZICo/VqQznc98oNI/AAAAAAAAAks/F0q0k_UCDGI/s1600/RATPAC-A%2Bvs%2BCO2%2Bmonthly%2B2015-12.png
… not so much. Which one is less wrong? How do you know?
On balance, no, I don’t think there was or is a “pause” in the rate at which the climate system considered as a whole is retaining absorbed solar energy. In fact, rate of retention looks to be accelerating.
Michael Jankowski,
Who said those things? What did they say exactly? When and where?
Same questions as above, with the caveat that I can recall that one British scientist who made a comment quoted in popular press to the effect that snow’s days in the UK were numbered. Not a global prediction, and thus far not realized.
Let’s look again at exactly what I wrote:
… or we could talk about how increased precipitable water in the atmosphere is NOT inconsistent with the observed warming in the oceans. We don’t even need to agree on why the oceans are warming to talk through that one.
Yeah, pretty different from your restatement. See, this kind of thing is why, you know, I’m rather particular about asking questions like above:
Who said those things? What did they say exactly? When and where?
You can’t even be bothered to quote me directly OR accurately when my original words are on the same webpage, perhaps you can now better appreciate why I don’t exactly trust you to correctly paraphrase things that “some (unspecified) people” have said “some (unspecified) time” in “some (unspecified) place” or other.
It’s amazing how so many folks here apparently think that popular media and activist websites are the best places to go for learning about climate science.
Dear Brandon,
Solar insolation heats the oceans. The oceans heat the atmosphere, not vice versa.
Brandon Gates mentions that the GISS adjustment procedures are there for everyone to see, the same as with the hidden pea trick.
Step 1
Then you see the ridiculous results of how large some of the changes are and wonder why it was not eliminated “after manual inspection” (seems like “manual satisfaction” might be a better description).
Then you see how most of the stations in an area have been changed and wonder which one is the magical neighbour.
Here is a plot of three close by stations for Adelaide , Australia for one year. Its actually smoothed with a 5 day mean of the difference in maximum temperatures from the mean of the three.
http://s5.postimg.org/tbbiq6wdj/3_sites_Adelaide.jpg
The 5 day mean shows the differences vary by a degree (without the mean, its spaghetti). the only trend is that there is they differ a lot less in the winter but you can still see that one is 0.4 greater than the other one week, then 0.2 less the next. How can you actually believe that the algorithm can pick out adjustments of a couple of tenths of a degree due to a once in a decade change at the site?
Then the result of more modern attempst to correct the data shows what alarmists want to see. Not making the data show warming or even extra warming, but making the end of the 20th century warming more significant that the early 20th C warming.
Brandon Gates January 23, 2016 at 6:22 pm
“How about we restore the full context of my initial comment?”
————————-
In that case, when you made yet another of your serial aspersions against skeptics, that attack only applies if “the pause” is redefined in your terms? There’s only so much cover which your semantic tricks will afford you.
Alan Robertson,
My attack against claims of a “Pause” is that such claims are generally attempt to define global warming as the nearly two decades of flattish trends in the lower troposphere as estimated by orbiting microwave sounding units. I do disagree with that definition of global warming because the atmosphere accounts for on the order of only 1% of energy retention in the entire climate system … or in the case of what the sats are measuring, zeroish percent of the net energy gain observed in surface records, vertically averaged ocean heat content and inferred from net ice loss in the cryosphere.
If you define global warming and/or “The Pause” differently, I apologize for having assumed wrongly.
I hardly think that my appeals to empirical evidence and physical theory to support my definition of global warming and/or “The Pause” constitutes a semantic trick any more than challenging your arguments along the same lines constitutes an “aspersion against skeptics”.
If you really want to paint me out to be a serial insulter, there are far clearer examples of me decidedly casting aspersions elsewhere for you to choose from. It might save you from having to clutch at so many straws in this thread to make that point.
Or, if you’re quite done chasing squirrels, we could go back to the topic of the OP. Maybe you can help Mr. Whitehouse come up with a direct quote supporting his statement, “It is claimed that global warming has resurged, terminating the warming ‘pause’ for good.”
B. Gates,
Less than a year ago you were arguing with Eugene WR Gallun about why global warming had stopped for so many years. Gallun said it was because there’s no AGW at all (I don’t agree). Your position was that global warming had been “suppressed”.
Back then you acknowledged the so-called “pause”. You accepted it. At least, you didn’t try to argue that it didn’t happen, or that it wasn’t real. But now you’re arguing that global warming never stopped?
Here’s what’s happening: the new narrative is that satellite data is wrong, and global warming never stopped. You’re on board with the new talking points. You’re not alone, either.
The alarmist contingent has simultaneously turned on a dime, and now you’re all pushing the latest talking points. That’s not even confirmation bias, that’s just crowd-sourced propaganda.
See, the internet never forgets…
Brandon says:
——————-
“My attack against claims of a “Pause”…
__________________
Oh, I see. The old “my words don’t mean what I said” gambit.
Too late. You’ve moved into another Fool’s Mate.
You do exhibit a proclivity for stepping in it, but do go on.
The more you talk, the more you expose yourself.
dbstealey,
Let’s take a moment to review my first post in this thread: http://wattsupwiththat.com/2016/01/23/2015-global-temp-or-how-some-scientists-deliberately-mistook-weather-for-climate/comment-page-1/#comment-2127478
I don’t find any direct quotes in the body of the article, nor in the links provided, of “some scientists” saying that 2015 marks the termination of “The Pause”. Perhaps you’d be so kind as to provide them?
Now here are you “quoting” me saying exactly one word, “suppressed”, with no further context. Anyone but me seeing a pattern here?
One wonders why you didn’t provide a link to this conversation or bother to more fully quote me in context: http://wattsupwiththat.com/2015/03/07/three-questions-for-denuding-complexity-a-standpoint-on-science-and-climate-change/#comment-1878573
Gosh, it’s because I didn’t say global warming had been “suppressed” at all, Eugene WR Gallun did: Suppressing global warming world wide is a big big task.
Conversation winds around some, and he asks me this question: http://wattsupwiththat.com/2015/03/07/three-questions-for-denuding-complexity-a-standpoint-on-science-and-climate-change/#comment-1878751
It is not more reasonable to say that the total heat content of the earth since 2000 has not been going up?
To which I replied in my very next post:
No, I don’t think that’s at all reasonable.
Followed by the very same plot I used in this post to support the very same argument:
http://climexp.knmi.nl/data/itemp2000_global.png
I know. Isn’t it grand?
Well Gates, you can’t be wrong all the time. My apologies, I was going by memory. Thanks for finding the conversation. Now my memory’s improved.
But I’m still curious. Do you think this is wrong? Is the so-called “pause” not happening? And is satellite data the best, or not?
Alan Robertson,
No, the same, “you didn’t quote me directly because my words don’t mean what you want them to mean” complaint.
I’m telling you, if you want to make a case that I “attack” AGW “skeptics” there are much better examples elsewhere, most of them NOT on this blog.
Now, if you’re quite done chasing squirrels, we could go back to the topic of the OP. Maybe you can help Mr. Whitehouse come up with a direct quote supporting his statement, “It is claimed that global warming has resurged, terminating the warming ‘pause’ for good.”
This is the second time I’ve asked you if you can help Mr. Whitehouse substantiate that claim. For some reason, you just want to talk about me. Why is that?
dbstealey,
Accepted with thanks.
I think this …
http://www.woodfortrees.org/plot/rss/from/plot/rss/from:1998/trend/plot/rss/trend
… gives a more complete picture. And in the same sense that this …
http://climexp.knmi.nl/data/itemp2000_global.png
… is also wrong, yes I think that RSS TLT is wrong. The question then becomes, by how much are each of these things wrong? And as you and I both know, that’s a contentious topic.
The ocean heat content plot above suggests that between 1997 and now that there is no slowdown or pause in the net accumulation of solar energy in the climate system.
Short answer: I believe the “pause” is not happening.
For purposes of gauging the rate at which the climate system is gaining or losing energy, I don’t think that RSS or UAH TLT temperature products are the the best choice because they’re only telling us about a very small fraction of the total energy. Surface-based temperature products aren’t really any better in that respect.
Brandon, it’s not really a question if RSS TLT is “right” or “wrong. What is significant is why 1998 was chosen as a starting point. If you start at 1997, or 1999, you get a totally different picture of the trend.
..
http://www.woodfortrees.org/plot/rss/from:1998/trend/plot/rss/from:1997/trend/plot/rss/from:1999/trend
.
(note how the red line is same color as a cherry)
Chaam Jamal,
So, what’s your take on this? Up to last year just about everyone was in agreement with what they called “the pause”. Now some opinions have flipped. But the facts can’t flip. Were they wrong ever since Dr. Phil Jones admitted that global warming had stopped? Or are they wrong now? And what part of any global warming is AGW? Please quantify any answers with a verifiable, testable fraction.
Next, here are 3 different years, 2001, 2002, 2003:
http://www.woodfortrees.org/plot/rss/from:2001/trend/plot/rss/from:2002/trend/plot/rss/from:2003/trend
(note how 2 of 3 are cooling, and pretty steeply. What’s being observed is natural variability in action.)
[Reply: This particular ‘Chaam Jamal’ is a sockpuppet. Also posts under the name ‘Richard Molineux’ and others (K. Pittman, etc.) As usual, his sad life writing comments has been completely wasted, as they are now deleted. –mod]
Amazing that sea surface temperatures can’t be measured with such precision now and that 0.1°C change since the 1950s to a depth of 2000m is meant to be meaningful.
The precision in the last 10 years from the Argo project is not even good enough to make one tenth of a degree significant. A study in 2007 found they made errors of 0.5-2 degrees in areas but this change that is less than uncertainty in the global mean anomaly for SST shows that there wasn’t a pause?
Yes indeed. The author says
“The “pause” will not be ended by weather but by forced global warming.”
But the “pause” is weather. And will end when the weather changes.
“The hottest year ever” is also just weather
Brandon
I agree they did not claim the Great Pause has been busted. They have moved into a new PR mode where they make no reference to The Pause at all and now pretend it was never there, based on a piece of jiggery-pokery hidden behind your ocean heat content chart. Your chart will become the new Hockey Stick: show the public an upwards line claimed to be the result of people burning coal, until of course it turns down whereafter a new icon of misleadership will be selected, or manufactured as is the case with your chart.
Mark Serreze (who I did not know from Adam, to look at) was just on Aljazeera TV talking up AGW as the direct cause of the snowstorm now hitting NYC, and attributing, without data, the ‘increased frequency’ of such storms to human emissions. He was making no sense at all, droning on about how it is going to get worse, before I heard his name at the very end when he was identified as the head of the National Snow and Ice Data Center. Isn’t this ‘Death Spiral Serreze’, he of Arctic Ice fame? The Northern Greenland coast was ice-free in summer 6000 years ago and is jammed with >5m of ice now year-round. Bad weather I guess.
What he said is baseless: that with global warming (which in the CONUS is absent) allows the air to hold more water vapour therefore (illogically) it would precipitate more. He is wrong on both counts. It is not warmer for ages, decades, and his physical model is incorrect. Then, hold more moisture than what other parcel of air? It is winter for crying out loud. Why doesn’t it snow ‘more’ in the rest of the country? Why doesn’t it snow more in the Arctic where the warming has been concentrated, so we were told repeatedly?
Precipitation is the result of warm moist air cooling to a lower temperature. Global warming implies that the ‘lower temperature’ is higher as well, therefore the drop in temperature is the same as before so for all intents and purposes, the precipitation is exactly the same as before. In short, his claim is based on bad physics and spread with partial information.
The claim that there was something terribly bad about the storm indicates a bad memory. It is a heavy winter storm. North America has always had them.
Blaming non-existent (for any functional purpose) ‘global warming’ for a snow storm that is in no way remarkably different or worse than those in the 1990’s, 1970’s, 1940’s and all the way back to the worst storm ever well-recorded in NYC which was in 1888, indicates bad intentions. Mark was using a transient weather pattern to try to convince the public that this storm was only one of many ‘worse’ storms to come and that they are directly caused by ‘global warming’ which of course the press agents repeat is caused by AG emissions of CO2.
If it is warming oceans that increase precipitation, why isn’t it snowing more in Waterloo, Ontario? The temperature here hasn’t changed in 100 years. I checked the local records. I hope this winter we don’t set (another) record low like last year.
Crispin in Waterloo,
Good to know I’m not the only one who sees the same thing, thank you.
One unsubstantiated claim in the OP refuted, you simply move on to making another unsubstantiated claim about a piece of jiggery-pokery.
I agree with you that attributions without evidence are bad form. They’re also quite commonly found on TV, which is why I don’t watch television to learn about what scientists think is going on with climate — I mainly read their papers in primary literature or discussions of them in secondary literature I consider reliable. I think one tends to get a more complete picture that way.
You complaining about attributions without data tickles my irony meter just a tad as you post don’t shy from imputing motive without evidence. And your rejection of OHC data on the unsubstantiated basis of it being “jiggery-pokery” intended as an ad hoc argument to explain away “The Pause” leads me to wonder if data actually matter to you at all. Just sayin’.
No, the physical model is not incorrect. You can verify the first part of it yourself by filling two identical pans with equal amounts of water and letting them equilibrate to ambient “room” temperature. Then put one pan on the stove and set the burner to its lowest setting such that the water in the pan is heated but does not boil. So long as the relative humidity in your kitchen laboratory stays below 100%, the pan with the heated water will evaporate more quickly than the one which remained at ambient temperature.
Warmer parcels of air moving in from the south, which picked up moisture over the Gulf of Mexico? You’re challenging basic, long-standing, well-observed phenomena of meterology now, let alone AGW climate theory.
It’s warmer other places in the US. It rained dogs and cats last night where I live. However, like the blizzards to my east, I’d be more inclined to chalk it more of it up to El Nino than AGW, since that is what is apparently dominating this particular year’s temperature AND precipitation patterns relative to recent years.
Because the absolute temperature in the Arctic is typically much colder, and therefore much drier, than the humid, much warmer Tropics. Rate of change of temperature anomaly over decades is not the same thing as relative differences in absolute temperature on any given day.
Well yes, that’s the reverse of the process demonstrated by my water pans thought experiment above. Odd that you apparently only agree with the converse of it.
Not only that the minima increase, but that they increase at an ever-so slightly higher rate than the maxiuma. But again, precipitation is not a function of the change in temperature, but is a function of absolute temperature, pressure and specific moisture content. It follows that an air parcel which contains more moisture than the long-term average has greater than average potential to produce precipitation if it mixes with a sufficiently cold air mass. Even though the Arctic is warming faster than the northern mid latitudes or tropics, its absolute temperatures are obviously still low enough to do this, hence a massive winter storm system causing blizzards today throughout much of the Eastern US.
Entirely consistent with long term warming of the oceans, but not necessarily indicative of it.
Whence the claim that AGW must increase total precipitation AND do it everywhere? My recollection from reading AR5 is that precip is generally expected to increase in areas that are already wet and decrease in regions that are already arid.
Josh has a cartoon for you:
Brandon says: ” It follows that an air parcel which contains more moisture than the long-term average has greater than average potential to produce precipitation if it mixes with a sufficiently cold air mass.”
———————
It also follows that an air parcel which contains less moisture than the long- term average has potential of producing an above average amount of precipitation, if it encounters a sufficiently cold air mass.
Without supporting data, any attribution of global warming to any precipitation event, is baseless and misleading
Alan Robertson,
I agree, and I would intuitively expect that to be the case if the cooler airmass were much cooler than the long-term average. I wouldn’t know with any certainty unless I could actually perform the experiment, or started doing a lot of math … which is a model, and we don’t do models here.
I’ve already agreed with that on principle in the post you are responding to: I agree with you that attributions without evidence are bad form.
Thing is, when dealing with physical systems, data without a physical model to explain them are, well, almost useless. And obviously, no future state of any physical system can be projected or predicted without using models. Since we don’t do models in this forum, pretty much any evidence I could provide (or have provided) is pretty much categorically rejected, leaving you free to believe whatever it is you want.
Which I think is pretty much useless. But that’s just me.
Interested readers can get the IPCC’s take on precipitation here …
http://www.ipcc.ch/pdf/assessment-report/ar5/wg1/WG1AR5_Chapter02_FINAL.pdf
… starting around hereish on page 43 of the .pdf:
2.5
Changes in Hydrological Cycle
This section covers the main aspects of the hydrological cycle, including large-scale average precipitation, stream flow and runoff, soil moisture, atmospheric water vapour, and clouds. Meteorological drought is assessed in Section 2.6. Ocean precipitation changes are assessed in Section 3.4.3 and changes in the area covered by snow in Section 4.5.
2.5.1
Large-Scale Changes in Precipitation
2.5.1.1
Global Land Areas
[…]
For the longest common period of record (1901–2008) all datasets exhibit increases in globally averaged precipitation, with three of the four showing statistically significant changes (Table 2.9). However, there is a factor of almost three spread in the magnitude of the change which serves to create low confidence. Global trends for the shorter period (1951–2008) show a mix of statistically non-significant positive and negative trends amongst the four data sets with the infilled Smith et al. (2012) analysis showing increases and the remainder decreases. These differences among data sets indicate that long-term increases in global precipitation discussed in AR4 are uncertain, owing in part to issues in data coverage in the early part of the 20th century (Wan et al., 2013).
In summary, confidence in precipitation change averaged over global land areas is low for the years prior to 1950 and medium afterwards because of insufficient data, particularly in the earlier part of the record. Available globally incomplete records show mixed and non-significant long-term trends in reported global mean changes. Further, when virtually all the land area is filled in using a reconstruction method, the resulting time series shows less change in land-based precipitation since 1900.
Personally, it makes sense to me that warming would be expected to increase specific humidity, and that as a result, some places are going to get more precipitation on average than they would have otherwise. It’s not as obvious to me that this would be the case for global mean precipitation.
In either case, climate is what we expect, weather is what we get. I tend to look askance at anyone making strong claims what a single particular weather event like the blizzards in the Eastern US have to say for OR against AGW.
Specific humidity has been declining for decades:
The same with relative humidity:
http://www.climate4you.com/images/NOAA%20ESRL%20AtmospericRelativeHumidity%20GlobalMonthlyTempSince1948%20With37monthRunningAverage.gif
If there was global warming humidity would be rising.
dbstealey,
Browse to: http://wattsupwiththat.com/reference-pages/atmosphere-page/
… wherein we find this plot of specific humidity …
http://www.climate4you.com/images/NOAA%20ESRL%20AtmospericSpecificHumidity%20GlobalMonthlyTempSince1948%20With37monthRunningAverage.gif
… which shows a steady increase in specific humidity at the surface as would be expected in a warming climate.
Better have Anthony remove that plot before you embarrass yourself even further.
B. Gates,
No, it doesn’t show what you believe. But nice try, and thanx for playing.
Brandon, I haven’t time to grasp all your befuddlements. One refutation will have to do:
“Well yes, that’s the reverse of the process demonstrated by my water pans thought experiment above. Odd that you apparently only agree with the converse of it.”
Your experiment with a heated pan was surprisingly inapt. I expected better. Place two equlibriated pans of water on two equal heat sources in two identical rooms. Have one room at a temperature that is 0.5 degrees warmer than the other. Measure the condensation rate on the walls of the two rooms. Demonstrate a significant difference between them.
Given a constant insulation the heating rate in both ‘pans’ is constant. Your original claim was not that one ocean is heated more than the other but that warmer air holds more moisture. But warmer water already held more moisture when it arrived at the water surface because…it is warmer.
When that warmer (because of global warming) air holding more moisture picked up additional moisture from the slightly heated pan, it picks up exactly the same amount of moisture as the slightly cooler air that has less initial moisture (because it was cooler).
When the air masses cool against their respective walls the will drop exactly the same water mass as they cool to their respective initial temperatures.
In brief. In a warmer world there is no increase in precipitation unless there is a fundamental alteration in the global circulation patterns that provide additional cooling. Additional cooling would lead inexorably to global cooling. This in turn leads to self-regulation of the type proposed by Willis.
Cooling is primarily available at the poles and at night. The “global warming” experienced in the 20th century was primarily, or exclusively some say, at that time and places. The potential to cool moist air is thus reduced, not increased, by geographically inhomogeneous warming. The effect required to increase precipitation which you claim will occur is reduced by the observed temperature changes in recent decades.
Climate models predict increased precipitation in a warmer world. That can only happen if the total energy entering the system is increased, i.e. solar energy. The quantum of energy within the system cannot change the total precipitation except by variations in the ocean currents which are held to be natural, not caused by CO2. The models are incorrect for two reasons: the enthalpy of the atmosphere does not dominate evaporation and condensation, and the temperature differentials that could drive addition condensation are weakened by global warming, which turns out to be polar and nocturnal.
The jiggery-pokery in the ocean heat content chart has been well-exposed on this list. I work daily with the same Pt-100 RTDs as those used to measure ocean temperature and they are incapable of rendering measurements from multiple instruments averaged to a precision of 0.001 degrees C. Your ocean heat content chart is para-scientific. The data underlying it claims impossible accuracy and precision.
“Specific humidity has been declining for decades:”
As usual, no source or details. But it looks very much like the NCEP/NCAR plot for your preferred home, the high troposphere, at 300mb, which you can plot here. It looks like this:
http://www.moyhu.org.s3.amazonaws.com/2016/1/sh_300.png
But again, we live at about 1000mb, where we can breathe. And then it looks like this:
http://www.moyhu.org.s3.amazonaws.com/2016/1/sh_1000.png
Rising steadily.
Stokes, I POSTED SOURCES.
Wake up.
dbs,
“B. Gates,
No, it doesn’t show what you believe. But nice try, and thanx for playing.”
Brandon’s plot, taken from the WUWT page, does indeed show specific humidity, just as he says. You showed us SH at 300 mb.
“Stokes, I POSTED SOURCES.”
Where? Where can we find those plots?
“Stokes, I POSTED SOURCES.”
Ah yes, I see from detective work with the URL now that it comes from this 2008 WUWT post, where it is followed by this rueful update:
“[UPDATE2: After reading comments from our always sharp readers, and collaborating with three other meteorologists on the graph, I’m of the opinion now that this graph from ESRL, while labeled as “up to 300mb only” is misleading due to that label. The first impression I had would be from the surface to 300mb i.e. the “up” portion of the label, but on the second thought I believed the label was intended to be numerical meaning “zero to 300mb” or from the top of the atmosphere down as opposed from the surface up as we normally think of it. The values looked like anomaly values, but are inthe range of absolutes for that elevation also.
Thanks to some work by commenter Ken Gregory, looking at other ways this and similar graphs can be generated from the site, it has be come clear that this is a level, not a range from a level. The label ESRL placed “up to 300mB was intended to list the availability of all data levels. Thus there is no 200mb data.
This demonstrates the importance of labeling a graph, as without any supplementary description, it can be viewed differently than the authors intend. A better label would be “at 300mb” which would be unambiguous. ESRL should correct this to prevent others from falling into this trap.]”
IOW debunked on arrival. But still being trotted out.
So finally you admit there are sources. If you couldn’t figure out where a link comes from you’re on the wrong site. It takes very little skill or knowledge. Even I can do it.
And how many more graphs of humidity would you like? Just ask.
Relative humidity is directly related to temperature. It’s the most common humidity metric used, so I have more RH graphs. The point is clear, I think. If global warming had really gone up by ≈.7ºC, humidity would have risen very measurably. That was the prediction, no? And there were plenty of predictions that humidity would go up due to global warming.
As Feynman said, you need to take all the evidence, not just what supports your bias. Evidence for AGW is pretty sparse. There’s no solid evidence that human activity has any effect outside of local heat sources. CO2 continues to rise while global T doesn’t, and the eco-contingent screams at America and the West while totally ignoring China, India, Russia, and a hundred smaller countries.
Now please explain why it all looks like a manufactured scare with the goal of hobbling our economies? I give very little credence to what people say. I like to look at the claims, and see if they match the real world. Actions, not words. Observations, not assertions. Dangerous AGW is the assertion. The evidence is lacking, but not the motive.
Crispin in Waterloo,
But you do have time to categorically describe them as befuddled. Interesting.
I could point you to some full-blown models which attempt to simulate the hydrological cycle on a global scale, be we don’t do models in this forum.
Um, no, my first mention of anything to do with precipitation was here:
January 23, 2016 at 2:51 pm
[…]
… or we could talk about how increased precipitable water in the atmosphere is NOT inconsistent with the observed warming in the oceans. We don’t even need to agree on why the oceans are warming to talk through that one.
In response to Mike the Morlock, who in an article entitled “2015 Global Temp, Or How Some Scientists Deliberately Mistook Weather For Climate” ironically rebuts my arguments by appealing to …
… and I have 22 states with snow that children just aren’t suppose to see anymore.
… a weather event. And yet I’m the befuddled one. You’re killing me here.
You’ve introduced a bunch of variables here, most of which are not defined, which exceeds my ability build a model in my head. But if I’m not muddled and am reading you correctly, you’ve basically just validated my argument that we can expect more precipitable water vapor in the atmosphere when temperature rises.
And as we on the AGW side of tings are all unnecessarily reminded, water vapor is the “most important” greenhouse gas. Congrats, you’ve just agreed with the IPCC that water vapor feedback is likely (or is it very likely?) positive.
In your experiment, the water is being heated at a constant rate in either room, and only the initial ambient air temperatures are different by 0.5 degrees, which you imply just above remains a constant even though there’s a hotplate with a pan of water on top in each of them. What’s the real-world weather/climate analog of that process? [When I wrote that, I hadn’t noticed your comments about self-regulation vis a vis Willis Eschenbach below. I’m going to let the question stand.]
I don’t know what constitutes a fundamental level change to global circulation patterns, but the IPCC document I cited earlier notes that there have been some detectable changes.
In a sense any “stable” physical system attempting to reach equilibrium is “self-regulating”. But most “self-regulation” arguments I read come across forgetting the glaciation/interglacial cycles of the past million years or so. Willis isn’t terribly keen on paleo data though, so I perhaps shouldn’t marvel that it doesn’t figure much in his arguments.
Can we get something clear here? Firstly, I didn’t introduce precipitation into this discussion, Mike the Morlock did. Secondly, I only claimed that a big freaking blizzard isn’t inconsistent with increased water vapor in the atmosphere, NOT that increased global precip is required by AGW, or indeed any warming due to any cause. Thirdly, I’ve already pointed to the IPCC which states globally increased precip is low confidence prior to 1950 and only medium since then due to insufficient data.
In sum, this entire subthread is squirrel-chasing from my perspective because AGW theory does not rely on increased precip as a causal mechanism, which is the thing I both understand best and am most interested in discussing because it is that very theory which the OP seeks to attack.
And it is my understanding that they don’t agree very well with each other. But otherwise, we at least agree on that much.
That conclusion doesn’t follow from your premises above, and on the face of it is silly to the point of ridiculous. The Sun is not in the atmosphere. Most solar energy passes through the atmosphere before being absorbed by the surface, some is reflected out, some is absorbed by the atmosphere (mainly in the IR spectrum). As such, an increase in Solar output would mainly be realized by absorption at the surface, or in the case of the oceans, below the surface, with essentially the same results I have been writing about in this subthread: the oceans would warm, more moisture evaporates, and specific atmospheric humidity rises.
After that, I cannot say with any great deal of confidence what would happen. I can say as I said before: one big freaking blizzard in the Eastern US is certainly not inconsistent with there being more precipitable water in the atmosphere.
But somehow increasing Solar output can change ocean currents. Why? Because it’s natural?
But somehow, the Sun can cause it to rain more. What model(s) is that conclusion based on?
Your claims of personal expertise can’t really be verified so long as you are anonymous, and in any case don’t really interest or impress me. I think what you’re arguing here is that the single-measurement precision of the instrument is far less than +/- 0.001 C and that therefore …
Good grief. Do they not teach statistics in engineering schools these days? Start with …
… and go from there.
The 300 Mb level humidity is supposed to be the fastest increasing atmospheric level in the climate models and in the theory, not declining.
It is only the surface that is increasing and all other levels are declining. The weighted average of the whole atmosphere is a small increase far lower than is predicted in the theory.
This is a very important prediction of global warming. Half of the total warming comes from this expected increase in water vapour.
Well it is NOT happening and climate science appears unwilling to even address this important MISTAKE.
“The 300 Mb level humidity is supposed to be the fastest increasing atmospheric level in the climate models and in the theory, not declining.”
As so often, just an assertion. No basis cited.
Crispin says: “Your ocean heat content chart is para-scientific. The data underlying it claims impossible accuracy and precision.”
——–
Brandon replies: “Good grief. Do they not teach statistics in engineering schools these days?”
_________________________
FAIL. Once again, you play the man, not the ball. That’s such a well- known “troll trick”, one would think that you’d have caught on by now, that we see through that sort of thing.
Alan Robertson,
One would expect expert users of the technique to recognize it. What I find interesting is that you don’t apparently notice how much more often I play the ball.
dbs,
“So finally you admit there are sources.”
What I asked for was to post the source. And you shouted:
“Stokes, I POSTED SOURCES.”
But you didn’t. There are no words pointing to the source. It is indeed possible to do as I did – check the URL, find that the directory name includes the characters 2008/06, and then look through the 48 WUWT posts in June 2008, on the off chance. That is not posting the source.
And of course, it’s there with a retracting update. Another flaky DBS graph. When posting graphs you need to:
1. Make sure it’s relevant to your assertion
2. Describe accurately what it depicts
3. Link to the source.
Linking not only lets the reader check on its meaning and provenance – it adds a bit of credibility, which you could greatly use.
Alan and Brandon
Brandon wrote:
Crispin says: “Your ocean heat content chart is para-scientific. The data underlying it claims impossible accuracy and precision.”
——–
Brandon replies: “Good grief. Do they not teach statistics in engineering schools these days?”
+++++++++++++
Alan complains (rightly) that he plays the man. However in trying to do so Brandon demonstrates that he does no understand what accuracy, precision, uncertainty and error propagation involve. I replied more directly to the point below (I think it is below).
Many interested amateurs (we are all amateur at most things) don’t get the points finely enough to be able to discuss the subject and it took ages for me to learn it. I had to because in spite of hating stats it is necessary for my work. The biggest error is that people assume that if you have a large number of measurements you know with greater certainty what the average is. This is only true under certain circumstances and those circumstances do not apply to readings taken from different instruments in different locations.
The absolutely decreasing uncertainty only applies if it is the same instrument reading the same thing repeatedly. Consider how scales are calibrated, for instance. The repeatability rating of a mass balance, which is not as good as its precision, is not based on 100 measurements taken on 100 scales reading 100 different masses, with each mass correct within the error allowed for calibration weights. No! The repeatability is made by measuring the same mass on the same scale a number of times. The accuracy is tested in a similar manner.
Now translate that into temperatures of a body of water. One could measure the same point in a volume using 10 thermocouples and average them. Assuming they are identical and they have been calibrated recently, the average is a number in which we can greater confidence than any one of the readings. This does not apply if the instruments are not identical. Other errors creep in.
But that example is not what is being measured in the ocean. They have 10 instruments measuring ten different places once each. Or 3500. It matters not. Thus the uncertainty of each unique measurement has to be preserved in the final answer, increased if any formulas were used in between.
This is basic lab science. The uncertainty of a single measurement doesn’t decrease by being mixed with readings taken from other instruments measuring something else. The uncertainty of the ocean temperature and therefore the heat content, cannot be more certain than ±0.06° because that is the uncertainty of just about all ARGO readings at the moment. Because of the sampling error, which can be determined statistically, the uncertainty is certain to be more than 0.06° because ….Math!
” I certainly don’t think of AGW moving in fits and spurts over the past two decades because about 93% of the energy being retained goes into the oceans …”
There is really no evidence that the oceans are heated anthropogenically.
Looks like some rather tiny line wiggles. What typical day-to-day instrument measures 0.001 K? Or is this another statistical construct w/ excessive significant figures? Uncertainty range? Would this wiggly line even show up on a graph with a real world scale?
Well Nich I have an Barometer that uses 3 decimal places. However it is in inches of mercury scale. And the lines that it plots do appear “erratic” but lower than the second digit. I would say that it is very accurate and is perfect for watching our atmosphere. It also provides a graph that displayes on the front. I have mine set for 100 samples per minute which makes the pressure look jerky and have pointie tops to them. But it is raw data and that is what the pressure looks like. (BTW it is my Iphone 6….)
Lee, you should stop breathing when near your instrument.
Rainer Bensch-
I thought of that. I also had concerns of the air conditioner making it jump when it turns on. However, since my entire study began with the evaluation of my A/C, it was the first thing I checked. After running the Barometer for a week testing this possible problem, I changed the settings to give me 100 samples each hour. It has a built in filter that somehow averages the data samples for that short period between samples. The patterns did not appreciately change reflecting the on and off of my A/C.
I also have three other barometers that have only two decimal places. Even tho the plots look slightly different, I have been able to use them as comparisons by marking them on the time scale when the second decimal digit changes. That way it is “fresh” readings. The 2 decimal instruments sometimes remain the same for up to 6 hours. I have compared all them with various NOAA creations that are mainly produced for airports and can see their instruments do the same. But for comparisons using their products I ignore the repeated readings. For that reason I went looking for the three decimal versions. The Iphone with the BAROGRAPH app is the only one I have found. It was not programmed for weather use but for counting steps as a person is jogging. Until someone out there provides a real Barometer app, I will continue to use Barograph and ignore the obvious problems it has. One is that it cannot be calibrated to local elevation and it sets the range automatically. So in order to make comparisons, I shift the plots Y axis and use it like you would an oscilloscope.
Ranier, I am glad you responded. It is tough to put information on a blog without any feedback. Just to make sure there is still a world out there.
FTOP_T- you say “The oceans heats the atmosphere.”
Your statement is very true but, its not the only thing that heats the atmosphere. When I compare all the diurnals (Temp, Pressure, Humidity, and Sunlight here at my little ranch) the Temperature begins to rise before the sun comes up. One of my instruments is a solar panel to watch sunlight. I started using them by connecting directly to a high impediance voltmeter (4 bucks at harbor freight), I am able to see exactly when first light of day is detectable. That varies from the Sun and Moon data that is provided by USNO (United States Naval Observatory). First light is when my moonlight monitor picks up an increase of voltage on the order of 1microvolt. I checked the signals using a termination resistor and it trimmed the signal considerable on the start and end day times. The experts of solar panels do not use them un-terminated. I sure others have and probably can see what I see.
Because first light is when the sun is well below the horrizon, and pressure in correlation with temperature begins to rise, there is other factors that warms up our atmosphere besides insolation. I have theories of my own how this happens starting with the solar wind influence on pressure.
LeeO
This was a predetermined outcome in June when the ocean temps were “Karl”ed. They were running out of credible wiggle room on land based adjustments. SST was the only dataset left to move the needle.
Nevermind that the sun heats the ocean which warms the air and not the other way around. Thus Ocean temps disprove vs. confirm AGW.
Queue the alarmist music for , “CO2 reduces ocean cooling”. Of course this means that the ocean can never be warmer than the -18C that reaches the surface, since if AGW was a perfect insulator a process that reduces cooling can never cause the object to be higher than its maximum received energy at which point it would reach equilibrium with the heat source.
the past two decades because about 93% of the energy being retained goes into the oceans …
Man made global warming makes the oceans do something they have never done before.
Be glad it’s not an ice age then….because 93% of our heat would be sucked up by the oceans.
The oceans heats the atmosphere. There is no man-made heat in the ocean. Here is a simple view:
http://ww2010.atmos.uiuc.edu/(Gh)/guides/mtr/hyd/smry.rxml
Brandon says: “Global warming “pausing” and “resurging” is a concept I see mainly being promoted by folks who reject AGW for whatever reason.”
————————
Oh. A promoted concept. Please clarify- are you implying that there was/is no pause?
Alan Robertson,
This is a textbook example of turning the scientific method upside down:
…a concept I see mainly being promoted by folks who reject AGW for whatever reason.
The conjecture is AGW. Skeptics have nothing to “promote”.
And Kevin Trenberth said:
The null hypothesis should now be reversed, thereby placing the burden of proof on showing that there is no human influence.
In other words: the real world is falsifying our AGW scare, so let’s defenestrate the scientific method and just presume we’re right, and put the onus on skeptics.
Amusing, if he wasn’t being paid with public taxes.
Brandon, Did you like the uncertainty of the Ocean Data?
Southern Hemisphere +0.64 ± 0.02
Northern Hemisphere +0.87 ± 0.00
Global +0.74 ± 0.00
So that the global temperature of the oceans has a mean less than 50% of the difference between SH and NH, but the uncertainty drops from ± 0.02 to ± 0.00, where I would expect an error range of about ± 0.01.
How can they have so little uncertainty?
lee,
± 0.00? There seem to be some digits missing?
Anyway, I would expect uncertainty to drop as number of observations increases. Since a global uncertainty estimate includes all the observations, I would naively expect it to have lower uncertainty than a hemispheric or regional estimate based on a subset of the same data.
I’d start by reading whatever reference it is from which you obtained those uncertainty estimates.
Brandon, from NOAA
https://www.ncdc.noaa.gov/sotc/global/201513
Whose digits are missing? Is it like the Irish calculator, with the razor delet key?
lee,
Thanks, their digits are missing obviously. They list 4 references at the bottom of the page, I’d start with:
Smith, et al (2008), Improvements to NOAA’s Historical Merged Land-Ocean Surface Temperature Analysis (1880-2006), J. Climate., 21, 2283-2293.
In order to check out these devices I set about buying four of them – Pt-100’s – from E and E process in Concord Ontario then monitoring them with an Agilent 34972A fitted with an Agilent 34901 multiplexer armature. This equipment is capable of measuring the temperature from an RTD which requires the use of two channels per 4-wire unit.
All the units worked to spec: they were stable at 0.01 degrees, with a noise level of ±0.002. The pair I tried first was not purchased as a ‘matched pair’ so I had to enter an offset to get them to report exactly the same temperature. They were never stable in the third decimal place and they never varied more than 0.004 C total.
It is difficult to measure a temperature accurate to 0.001 degrees under any circumstances and it is certainly not being done by five year old Pt-100 RTD’s. And then there is the spatial sampling issue.
Brandon:
“I would expect uncertainty to drop as number of observations increases.”
That is not what happens when averaging the results of multiple readings from multiple instruments taken at discrete positions within a large volume known to have an inhomogeneous temperature.
The original uncertainty of all the individual readings propagates through all subsequent calculations, and in fact increases slightly (assuming they make no adjustments which would make it worse). There are standard formulae for determining the uncertainty of a calculated result.
Your expectation is called ‘false precision’. I don’t think there is a term for false reduced uncertainty, it is just wrong to claim it. I assume Brandon, that you do not conduct scientific experiments professionally, correct? It is not a failure or shortcoming, it just helps me understand why the examples and assumptions you create are, as I said above, inapt.
Because you read so much it would serve you well to study the fundamentals of experimental design and data analysis. It would save you a lot of time and make our conversations more productive, not to mention shorter. I like your spunk but you have to up your game if you want to hang around WUWT.
Crispin in Waterloo,
Citation please? Make sure its relevant to this specific application.
I agree with that. And yes, adjustments for bias are made. See … what is it … Levitus et al. (2012): http://onlinelibrary.wiley.com/doi/10.1029/2012GL051106/full
Open access. The supplemental is where all the uncertainty formulae and calculations are detailed: http://onlinelibrary.wiley.com/store/10.1029/2012GL051106/asset/supinfo/grl29030-sup-0003-txts01.pdf?v=1&s=9ded61b2916fdd5d7370734693067b7696a33d53
Ok. And they are?
William Briggs calls it overcertainty, but usually in conjunction with critiquing wee pee values, not uncertainty estimates … unless they were obtained by running Monte Carlo experiments or any other method which relies on randomization. He doesn’t believe in random at all, but believes in free will. But I digress. I think he has a point that random and deterministic physical systems aren’t compatible, but I’m not convinced that it renders stochastic modelling in a deterministic but chaotic system completely useless. Now I really do digress.
You assume correctly, and I don’t consider it a failure or shortcoming either. I think the main reason you find my examples and assumptions inapt is that you don’t agree with the professional scientific conclusions they’re based on, though I cannot rule out that I’ve bungled something basic in this thread. I know I’ve screwed up before, twice this week that I know of for sure, matter of fact.
Not that it matters, nor that you should believe me, but I have. Fundamentals only, formally, undergrad level.
I’m not so sure about that, but my reasons are highly speculative and really aren’t central to the topic … which is what I’d really rather be discussing because I think it’s more interesting and important.
Gates says:
William Briggs calls it overcertainty, but usually in conjunction with critiquing wee pee values, not uncertainty estimates … unless they were obtained by running Monte Carlo experiments or any other method which relies on randomization. He doesn’t believe in random at all, but believes in free will. But I digress. I think he has a point that random and deterministic physical systems aren’t compatible, but I’m not convinced that it renders stochastic modelling in a deterministic but chaotic system completely useless…
“Wee pee values”? That whole paragraph, not to mention that post and most of your others, indicates something über strange going on around the clock. I skip most of your comments now, but it makes me wonder, what’s your motivation? It can’t be convincing readers here, because that’s just not happening. Are you trying to convince yourself?
Brandon,
‘They list 4 references at the bottom of the page, I’d start with:’
The problem with that is that none of the references is recent. However if we look at 2014 we see-
‘Ocean +0.57 ± 0.04’ – Global
‘Ocean +0.52 ± 0.03’ – SH
https://www.ncdc.noaa.gov/sotc/global/201413
So that doesn’t seem to help.
lee,
They should be the most recent references describing their current analysis, including the methods used to derive error estimates.
Not immediately, no. I’m out of ideas. If reviewing the citations doesn’t help, perhaps you could send them a short note asking for clarification.
And if I wanted to learn about climate change propaganda b.s., I can always read IPCC AR5, or visit the NASA and NOAA websites. I don’t need the b.s. regurgitated in here by you ad nauseam.
Wishing there was a troll ignore button for this site.
dbstealey,
Perhaps if you were less concerned about ferreting out my motives and more concerned with reading for understanding, my comments would make more sense to you.
It is my personal opinion that most active participants in this forum are impervious to logic, reason and the preponderance of evidence which support the case for AGW, so you’re correct: attempting to convince them of anything would be a fool’s errand of epic proportions.
Would you believe me if I told you?
Are we done with these irrelevant discussions about my motives here yet, or are you pretty much just out of anything substantive and relevant to the topic of this post?
Gates,
There aren’t any mirrors in your apartment, are there? Your comment is a textbook example of projection.
skepticgonewild,
QED
Brandon, Perhaps NOAA are so enamoured of Karl et al that they came up with new and interesting statistical techniques, to prove that significance of 0.10 is really very good.
lee,
Could be. I’m not in a position to make any better speculations than you can. Since reading the references hasn’t answered the question for you, and I’ve already told you that I’m out of ideas, if you want a better explanation your only recourse seems to write them a note and ask them about it.
Brandon
>>…uncertainties data …”
“Citation please? Make sure its relevant to this specific application.”
In relation to how to provide uncertainties about data sets from multiple instruments: this is so basic I am afraid it will have to skip this request.
Averaging numbers is something taught in primary school. Uncertainty is something taken late in high school. Average of averages is something taught I think in Grade 10. Propagation of uncertainty is something taught in university if you didn’t cover it by Gr 12. At WUWT we assume competence and being self-informed.
The uncertainty of a reading take once from one instrument is not reduced by taking additional readings from other instruments.
I wrote a lengthy reply to your comment above about the water pan experiment and WordPress ate it. Sorry, but I don’t have time to reproduce it. I have real experiments to run – in which you have expressed no interest.
In a close system, there is no increased precipitation if it operates at a higher temperature. The air coming over your ‘warmer water’ will not pick up additional moisture – it has already has more moisture left over from the last time it condensed out the water to a globally higher temperature. In short, the Delta T is constant. No increase in precipitation. End of short story.
In the meantime, please study a bit about how uncertainties are propagated, and the fundamental difference between the uncertainty of a calculated result and how well we know where the middle of that range of uncertainty is located. The location of the middle is being reported as the averaged value with great precision – a common error, a most fundamental mistake. Understanding this will help you with AG issues.
The numbers posted by ‘lee’ above are nonsense (not that it is lee’s fault). It is literally impossible to provide a global average temperature to 0.01 precision with ± 0.01 based on instruments that are accurate to 0.1 degrees. Literally impossible. At one or more points along the way they have dropped the uncertainty – taken values as absolutely correct – and started again. It is simply not possible to have instruments in the data set with an accuracy of 0.1 ± 0.1 and end up with an uncertainty of ± 0.01. The most outrageous recent claim is that a portion of the oceans have increased in temperature by 0.001 degrees over a period of years.
As for your crack about ‘anonymity’ I am very easy to identify. I use a short name for convenience.
Crispin in Waterloo,
I just love reserved wisdom.
Funny how so few people here have forgotten that.
Even odder how often uncertainty is translated here as, “we don’t know, nothing to see here, move along”.
Most odd how often that argument is translated here to, “and it’s impossible to ever know anything about this in the future, nothing to see here, move along”.
And yet exhibit so little of either on a daily basis … unless “self-informed” means “I thought it and asserted it, therefore it must be true”.
Ok, I’ll put down the broad brush now and pick up the one I use for fine detail work. I did not say that single measurement uncertainty is reduced by taking multiple measurements. I’ll repeat something basic, and according to you, anyone who made it through grade 10 with a passing grade should be able to get it:
The bar over the x means what?
Pisser, I hate when that happens.
No, I wrote: Your claims of personal expertise can’t really be verified so long as you are anonymous, and in any case don’t really interest or impress me.
I’m mainly interested in your arguments, regardless of your self-professed expertise. It’s mainly by quality of arguments that I attempt to judge whether I’m impressed or not.
Your experiments might actually interest me a great deal because I’m generally interested in many areas of science and engineering.
Ok, that all makes sense, and now I have better context for understanding your two room model. I’m also prepared to accept it without digging up a first-year physics text. My rebuttal is that the planet is not closed with respect to radiative transfers in and out, it is quite open to them. Strictly speaking, it’s not closed to mass transfers in and out, but I think we can safely neglect those for purposes of this conversation, this portion of which I am indeed quite enjoying.
As I said previosly, I could point you to hydrological cycle models which attempt to simulate this on a global scale, my recollection of litertaure is that work on this began as early as the ’60s. But “we” don’t do models in this forum except when “we” have built them ourselves and they’re very simple. Do you see my quandry here?
I’ve done that already, and I’ve already pointed you toward the literature in this specific application the first time you made that argument:
Don’t mistake my openly professed lack of domain expertise with complete unfamiliarity with some of the relevant issues, nor my skeptical questions for you as unwillingness or inability to understand your argument.
What I’d like you to get your mind around is that you are in effect claiming that Levitus et al. have taken my relatively naive approach to this domain. I think you’re sorely mistaken, and to convince me otherwise is going to require you reviewing that supplemental cited above, telling me where you think they goofed and what you think the actual uncertainty should be. And you must show your work. It’s a tall order, and anything less I will consider just more handwaving on your part.
Are you hearing me yet?
It wasn’t a crack. I made no assumptions about the reason for your handle, and no judgements either. That’s Anthony’s MO when an anonymouse says something “denigrating” about him. I respect anonymity for any reason up to the point that someone makes a claim about personal expertise — which doesn’t particularly impress me in and of itself, but if they’re going to trade on it in lieu of standing on reason and evidence alone, I they should probably be doing it under their real identity.
I don’t need to know who you are or what you’ve done to be impressed with your expertise. I just need to you make the expert arguments you claim you can, which according to you are not just on par with Levitus et al. (2012) but superior. I’d get cracking on it.
BG…apparently you are either too blind or lazy to click on the article’s links for yourself, but Whitehouse isn’t your manservant. If you HAD clicked on “suggestions” you’d have been led to another page in which you would find the following-
“In a joint summary with former head of NASA GISS, Dr James Hansen, Schmidt says 2015 global temperature “smashed the prior record” and “should practically terminate” discussion of any slowdown in the pace of global warming.”
Now, if you’d like to discuss ocean temps, you’ll have to remember the thermal inertia of the oceans and how long it takes for “warming” on this planet to be detectable in the oceans in the first place. NOAA discusses the idea here: (bold mine) http://www.oco.noaa.gov/roleofOcean.html
“The seasonal variations in heating penetrate into the ocean through a combination of radiation, convective overturning (in which cooled surface waters sink while warmer more buoyant waters below rise) and mechanical stirring by winds. These processes mix heat through the mixed layer, which, on average, involves about the upper 90 m of ocean. The thermal inertia of a 90 m layer can add a delay of about 6 years to the temperature response to an instantaneous change(this time corresponds to an exponential time constant in which there is a 63% response toward a new equilibrium value following an abrupt change). As a result, actual changes in climate tend to be gradual. With its mean depth of about 3800 m, the total ocean would add a delay of 230 years to the response if rapidly mixed. However, mixing is not a rapid process for most of the ocean so that in reality the response depends on the rate of ventilation of water between the well-mixed upper layers of the ocean and the deeper, more isolated layers that are separated by the thermocline (the ocean layer exhibiting a strong vertical temperature gradient). The rate of such mixing is not well established and varies greatly geographically. An overall estimate of the delay in surface temperature response caused by the oceans is 10–100 years. The slowest response should be in high latitudes where deep mixing and convection occur, and the fastest response is expected in the tropics. Consequently, the oceans are a great moderating effect on climate changes.”
Now, we KNOW that the atmosphere does NOT warm the ocean in any meaningful way. Only short wave radiation from the Sun can penetrate and warm the oceans, and we all know that Co2 re-radiated IR long wave radiation simply cannot warm the oceans. BUT, let’s pretend that human CO2 is magic and does just what I said it cannot do. With the above rough numbers in mind, Brandon, and “humans” only being blamed for temperature increases in the atmosphere since 1950 (2016-1950=66 years) it would appear that any “mean depth ocean warming” that WE could have caused would be microscopic, and only a tiny part of a warming of the oceans that started hundreds, if not thousands of years, prior to the industrial revolution. “Man-Made Warming” has not been an “instantaneous change”. It has been gradual. And so if instant change takes at least 10 years to be noticeable in the 90 m layer, how long do you suppose gradual change takes to be noticeable in it? (IF it mixed rapidly, and it does not) 230 years- 66=164 more years before it would even register as PART of the oceans warming! And then how much longer would it take for those gradual changes to be mixed down into the deeper layers in a slow mixing, multi layered, isolated layer ocean that is overwhelmingly COLDER than the “heat” being mixed into it from above?
Of course you may have discovered your own “new” exponential time constant that defies all known thermodynamic principles and which demonstrates that CO2 in the atmosphere, somehow now warms the oceans, past the 90m layer, with such rapidity that “human induced” warming that started roughly 66 years ago is now deeply and rapidly warming the Earth’s oceans in an unprecedented (and previously undiscovered) manner. Please share your newfound wisdom with the world Brandon! Break that story here on WUWT for us will you?
(Hint-there is NO physical way for the oceans up to 2000m to be reflecting actual surface temperature increases that closely UNLESS the oceans are causing the warming themselves. Because there is no known physical WAY that changes in atmospheric/land temperatures can penetrate the oceans that deeply, that quickly. It only works ONE WAY…from the OCEANS out…PERIOD. If you’re even going to attempt to say that it works in the opposite way-CO2+heat INTO the oceans-in which the oceans IMMEDIATELY and instantaneously increase in temps in almost near lock step, save your breath. You’ll be laughed off the internet.)
Aphan
Apparently you don’t understand that it’s not my job to properly do his citations for him.
Here’s the full text of Whitehouse’s statement containing that link:
This makes suggestions that the “pause” in annual average global surface temperatures has been “terminated” premature.
Also compare the 2nd sentence of Whitehouse’s lede paragaph: It is claimed that global warming has resurged, terminating the warming ‘pause’ for good.
Not the same as: In a joint summary with former head of NASA GISS, Dr James Hansen, Schmidt says 2015 global temperature “smashed the prior record” and “should practically terminate” discussion of any slowdown in the pace of global warming.
Further down:
Dr Thomas Karl, director of NOAA’s National Climatic Data Centre, echoed this point, telling a press conference earlier today that it is ‘virtually certain’ that 2015 is the hottest year on record. But while interest in which years break records is inevitable, understanding climate change means taking a much wider view. Osborn explains, “It is the long-term trend that tells us about climate change, rather than the relative warmth of individual years.”
Compare the headline of the OP: 2015 Global Temp, Or How Some Scientists Deliberately Mistook Weather For Climate
Not at all the same. Continuing on:
Q&A: A boost from El Niño
As well as being a symptom of the long term warming trend, scientists are interested in 2015 global temperature because of what it tells us about how natural fluctuations in the climate can act to amplify or dampen the warming signal, Osborn explains.
A huge El Niño in the Pacific – among the biggest on record – contributed to the record warmth in 2015, say scientists. In total, 10 out of the 12 months in 2015 either tied with or broke previous records, according to NASA and NOAA’s joint analysis. Since the El Niño only recently reached peak strength, scientists expect its impact to be even larger in 2016.
Compare Whitehouse:
Despite what some scientists have said the large increase over 2014 is far too great and swift to be due to a resurgence of forced global warming. It must be due to short-term natural variability, and you don’t have to look far to find it. 2015 was the year of the El Nino which boosted the year’s temperature.
Not withstanding that “some scientists” didn’t say what he attempted to lead to believe they’d said about the “resurgence” of a “Pause” they’ve been saying for some time is illusory due to natural variaiblity, they’re far from “downplaying” the role of El Nino in 2015, they go on to say that its impact is expected to be even greater in 2016.
Are you new to English? Or Essays? His “lead” is a summary of the article as a whole. In the 2nd to last paragraph we find this-
“This makes suggestions that the “pause” in annual average global surface temperatures has been “terminated” premature. ”
The word “suggestions” is BLUE and suggests a hyper link. If you click on it, it takes you to the site where Whitehouse found the quote from the scientists he’s talking about.
Here’s the URL for that page- http://www.carbonbrief.org/analysis-how-2015-became-the-hottest-year-on-record
Scroll down to just above the 1st chart.
See? That was really hard. And now BOTH Whitehouse and I have pointed you to his source. You can do it.
Brandon,
It’s okay to say, “Ouch!” ☺
Aphan,
No, it’s my native tongue.
Yeah, I did that already, and quoted the relevant bit in my previous post:
In a joint summary with former head of NASA GISS, Dr James Hansen, Schmidt says 2015 global temperature “smashed the prior record” and “should practically terminate” discussion of any slowdown in the pace of global warming.
Compare Whitehouse: This makes suggestions that the “pause” in annual average global surface temperatures has been “terminated” premature.
One of these statements presumes a “pause” ever existed, the other one does not. Can you tell which is which?
dbstealey,
Why would I want to do that? I’m not the one with English comprehension issues here.
*Lurking…brays with laughter at various intervals*
Great illustration…
Only it should be Homer with a goatee at the chalkboard, assuming he can write.
I can’t say I understand the headline for this article. It would take a brave person to call conditions averaged over the globe for a year or more “weather”.
Variation is the global climate, yes. Try comparing the global mean temperature of 2014-2015 with the last Great El nino of 1997/98.
Do you mean, an easy visual comparison on a graph, like this?
http://www.esrl.noaa.gov/psd/enso/mei/ts.gif
Alan Robertson.
“Do you mean, an easy visual comparison on a graph, like this?”
Nice chart, but it is not global mean temperature.
Harry Twinotter,
Especially compared to, “bbbbut blizzards!”. Compared to the standard, albeit somewhat arbitrary, definition of climate as the 30 year statistics of weather, I’d say it’s more weather than climate.
That is a good point. Been meaning to get around to updating these through 2015 year-end ….
http://3.bp.blogspot.com/-5NsdtYi0Ifg/VqQqEq8O-BI/AAAAAAAAAkU/BzdI7Q7-Gsk/s640/HADCRUT4%2Bvs%2BCO2%2Bmonthly%2B2015-12.png
http://3.bp.blogspot.com/-vniapHOw-Po/VqQqEXqI2tI/AAAAAAAAAkQ/387eopVqVoM/s640/HADCRUT4%2Bnon-CO2%2Bmonthly%2Bcontributions%2B2015-12.png
Lookee there, Nino 3.4 not as strong in 2015 as it was throughout 1997/98, 2015 temps are still clearly higher.
Alan Robertson,
Sure, that explains some of the variability around the observed secular trend since 1950, but not the trend itself.
Brandon Gates.
“Especially compared to, “bbbbut blizzards!”. Compared to the standard, albeit somewhat arbitrary, definition of climate as the 30 year statistics of weather, I’d say it’s more weather than climate.”
I would not feel comfortable calling something “global weather”, but I take your point.
Harry Twinotter,
Figured you would. Global weather, I like that ….
Weather is local and regional in scope; microscale, mesoscale, or synoptic scale. There’s no such thing as “global weather”, but since both you and Harry are big on disinformation, I can see why you’d embrace something so wrong.
Brandon,
Would you mind linking to your data source(s) for the graph, “Estimated non-CO2 contributions …”?
Thanks.
Jon Keller,
All data are from KNMI Climate Explorer (mostly the Monthly Climate Indices page) except Length of Day Anomaly (LOD) which I obtained from two sources and stitched together:
http://hpiers.obspm.fr/eop-pc/earthor/ut1lod/lod-1623.html
http://datacenter.iers.org/eop/-/somos/5Rgv/latest/213
Anthony Watts,
The title of the OP is: 2015 Global Temp, Or How Some Scientists Deliberately Mistook Weather For Climate
Perhaps you’re a better comedian than I’d previously thought. Whatever the case, I do have a severe case of the giggles at the moment.
HT says:
I can’t say I understand…
Got it.
The problem is that surface temperatures, be they up or down mean zip. What you need to compute is the excess retained enthalpy of the earth. A comprehensive map using satellite that can compute the radiation budget across all wavelength on a global basis would come the closest to being the only practical way to do it. The El Nino and surface temperatures are a vivid example of the uselessness of surface temperatures for computation of either global warming or cooling. But you have to have an academic background in reality to understand that. Sadly that is largely missing in today’s academia.
I used to be an aviation weather forecaster in the Air Force. A favorite saying from then, “climate is what you expect; weather is what you get”. The distinction was clear.
Today, “climate scientists” and global warming enthusiasts are unable to understand the difference.
I agree that we shouldn’t put much stock in annual temperatures when analyzing climate change. Look at decadal averages. Then we’re talking climate. And the trend in recent decades is very clear.
Better yet, take the longer view. Ooh, scary.
http://www.globalresearch.ca/articlePictures/globalcool3.jpg
+1
A view too long. As has been endlessly pointed out, the part marked “present global warming” points to the end of data in 1855.
OK, lets see this graph with 0.001 K resolution on the y axis.
Nick- This better?
http://www.skepticalscience.com/pics/kobashi2011_1000yrs.png
Or tack another 0.8C onto the end of this one-
Scary now? Nope. Not.
Aaaaaand, that’s a wrap.
Good night folks. Drive safely!
The increase in the surface temperature data is far too large to be due to El Niño variability.
The biggest of the El Niño lift is still come anyway.
And the satellite temps have traditionally shown more ENSO variability and they do have any kind of record increase yet.
Bill – yes, the increases seem somewhat larger and (IF correct) seem to have have happened sooner than previously?
I assume you meant ‘do not’ in the last sentence?
I’m confused. When there is an El Nino year we can expect drier than usual conditions yet we have had the wettest spring and summer for the last three years. Nearly all that rain is coming from the Indian Ocean. It is only a few years ago that the BoM declared that the Indian Ocean plays a part in our weather. My dad knew that back in the fifties.
Lawrie, it seems your El Nino’s have been ‘disrupted’ by abnormal man-made climate conditions. Better get used to it. CO2 is all-powerful.
Oh, I forgot to remind you: it’s your fault.
Send money. I’ll fix your El Nino’s for you.
By 2100.
But send the money now. These things take time.
2015 Global Temp, Or How Some Scientists Deliberately Mistook 50 Years of Global Weather For Climate
There, fixed that for you.
No link. Please give us a reference
“This is all slight of hand, and a little inaccurate. The IPCC says that just over half of the warming since the fifties is forced so most of the contribution to 2015′s temperature is natural variability.”
Now that is “slight of hand”. The IPCC, in the AR5 SPM D3, said:
“It is extremely likely that more than half of the observed increase in global average surface temperature from 1951 to 2010 was caused by the anthropogenic increase in greenhouse gas concentrations and other anthropogenic forcings together. The best estimate of the human-induced contribution to warming is similar to the observed warming over this period. {10.3}”
It didn’t say “just ovr half”. It said “more than half”. But it said the best estimate was that all the human contribution was similar to the total.
Nick:
“But it said the best estimate was that all the human contribution was similar to the total.”
Then they are worse scientists that I thought. It is regularly agreed among normal scientists that there are several natural variations in the climate with a number of contributing factors such as the level of ozone and the altitude of the ozone layer, among many others. If their ‘best estimate’ overlooks all the other sources of variability in the climate and the cyclical changes in temperature, including the period 1950-2010, then their ‘best estimate’ is far off the mark.
I suspect that their ‘estimate’ is really a computer model of the climate that projects several degrees per doubling of CO2 in the atmosphere. Brandon (above) said recently in another thread that the model projections have been adjusted down to match observations. “Isn’t that how science is supposed to work?” he wrote. Maybe science does work that way, but GCM science doesn’t. Not for climate things. Estimates that 100% of the warming from 1950 to 2010 are entirely caused by AG emissions of CO2 are at variance with a very large number of peer reviewed studies of the AG contribution to the global temperature, its rise or fall. As the human contribution remains undetectable to real instruments and real statistics, the claim remains hollow. There is nothing to back up the claim that the ‘human contribution’ is similar to the ‘total’. If true, it would require, at the least, the frequent adjustment of the human contribution to match the frequently adjusted temperature records.
I note too that the quote refers to the “global average surface temperature”, which as we know, has been paused for >18 years while CO2 rises at an increasing rate. Brandon was pitching (above) that it is really the ocean heat content we should be watching. If that is to be added to the temperature ‘rise’ then there is way too much total heat being accumulated.
Consider: The IPCC attributes to farming, industry and transport all the warming of the surface from 1950 to 2010, and the warming matches pretty much the whole temperature rise, they say, cited by you. But Brandon has it that there was also a huge increase in ocean heat content. Well, what warmed the oceans? Obviously it can’t be a human contribution because that has already been assigned by the IPCC to creating the whole temperature rise in the atmosphere. Accepting the claim by the IPCC necessarily requires rejecting Brandon’s parallel claim, which is that there wasn’t a rise in the atmospheric temperature (for a long time) but that the heat is instead in the oceans, and he produced a chart to support the claim.
The only possible conclusion I can come to is that there is a large natural variation in the total heat content of the oceans and atmosphere, and that any human contribution is statistically inseparable from natural variation. If it was separable, someone would have shown the method for doing so and we would not have these logically incompatible and excessive (literally) claims floating across computer screens around the world.
Was there ever a Pause? Is it over? Will the global surface temperature warm, on average, rise in the coming year? 20 years? Yes, no, yes and no. And the best the IPCC can come up with is to burn their candle at both ends?
Crispin,
“If their ‘best estimate’ overlooks all the other sources of variability in the climate”
No, it doesn’t. The trouble here is that observed is the sum of effects that need not be positive, so percents give the wrong idea. AGW could easily be more than 100%. They actually worded it awkwardly but carefully – “the human-induced contribution to warming is similar to the observed warming”. Natural variation is not said to be absent, just to have approximately zero net effect on warming over this period. Approximately.
” But Brandon has it that there was also a huge increase in ocean heat content. “
There is no inconsistency there, in fact the two must go together. The heat retained by GHG was sufficient to both increase surface temperature and warm the oceans. The amount of heat required to just warm the air without the oceans, if that were possible, would be small.
Nick said re:IPCC claim : “the human-induced contribution to warming is similar to the observed warming”. Natural variation is not said to be absent, just to have approximately zero net effect on warming over this period. Approximately”
You’re right, this statement makes no sense at all. “Approximately zero net effect”???
So in the past (RWP, MWP), natural variation was the climate driver , but in the IPCC fantasy -construct present it suddenly has “approximately zero net effect” ?
Why can’t the IPCC scientists, with their apparently prodigious ability to calculate average global temperature value changes to the 100th of a degree,give us a more specific quantitative value than “approximately zero”?
“Approximately zero net effect”???
Read it again: “approximately zero net effect on warming over this period”. Natural variation went up and down, as it does. But summed over the specific period 1951-2010, it adds to zero, if the AGW effect exactly equalled the observed effect. Over other periods it would add to something else.
But they aren’t asserting it certainly was zero. They say their best estimate is that AGW and observed were equal, but say that AGW could have been (improbably) as low as half. Then natural would be the other half.
“Natural variation went up and down, as it does. But summed over the specific period 1951-2010, it adds to zero”
Pure and absolute supposition , with ZERO proof. !!
Nick, that position is untenable. If the natural variation just happens to balance, in the oceans and the air, the temperature rise from an AGW forcing that is based on a modelled sensitivity, then there is no way whatsoever to separate natural variation from human effects. This, because the natural variation is unknown and there is no way to validate the models; lacking such validation there is no way to know what the sensitivity is and no way to know the AG influence.
The first victim of this informational black hole is the IPCC claim to have ‘detected the fingerprint of AG warming’. Bunk. No one has detected any such thing. If the AG forcing is known (by accident), then the great pause proves natural variability is at least as large. The natural variability can be warming or cooling. Therefore the null hypothesis has to be addressed. The claim that the human effect is known is hollow and unprovable. That natural variation can overcome a 25% rise in CO2 is known by observation. Observations trump assumptions every time.
Just out of interest, do you think the air warms the oceans? I sure as heck doesn’t in the Arctic.
Nick Stokes-
” But Brandon has it that there was also a huge increase in ocean heat content. “
There is no inconsistency there, in fact the two must go together. The heat retained by GHG was sufficient to both increase surface temperature and warm the oceans. The amount of heat required to just warm the air without the oceans, if that were possible, would be small.”
Bwahahahahahahahahah! Are you serious? DO you understand that the thermal inertia of the oceans is such that IF all the layers mixed as rapidly as the first 90 M of the oceans do (AND THEY DO NOT) it would take 230 years from a temperature increase at the surface to even BEGIN to change temps at deeper layers? Which means 2016-1950=66 years. 230 years-66 years=164. IF (and it’s an imaginary IF) we are responsible for ANY ocean warming at all, it won’t show up in the oceans as a temperature increase for at LEAST another 164 YEARS…and in reality, it’s even LONGER than that due to the slow mixing, moving of the oceans thermal mass and inertia.
IOW-the oceans are SO massive, and so cold, and so deep, that if the ocean’s temperature were CONSTANT and STEADY in 1950 (and they weren’t) ANYTHING that could possibly have been caused by human beings since 1950 won’t even begin to register in the oceans for at LEAST another 164 years..and possibly a thousand years. So there is no way that anything we’ve done could have heated the land and atmosphere AND the oceans at the same time. It’s physically impossible. If ocean temps are moving in lock step with atmospheric temps, then there is only ONE solid, logical, scientific, thermodynamic possibility…the oceans are warming and heating the atmosphere AND increasing the Co2 in it as they warm. PERIOD.
And human CO2 does NOT heat the oceans. IR re-radiated by Co2 in the atmosphere is NOT STRONG ENOUGH to penetrate the oceans surface. The only energy that does is short wave radiation and heat from the SUN.
Well, at least somebody is happy about all that snow on the East coast !!
http://video.foxnews.com/v/4718234367001/panda-bears-adorable-reaction-to-snow/?intcmp=hpvid1#sp=show-clips
VERY cute! Just like a little kid.
http://www.addletters.com/pictures/bart-simpson-generator/bart-simpson-generator.php?line=Polar+Bears+are+not+cuddly+pets++%21%21
I loved the Frozone guy (From The Incredibles) shoveling snow!
https://www.facebook.com/oryshow/videos/1095391250494689/?pnref=story.unseen-section