Temperature:
Global Surface & Sea Surface Temperature – NOAA PSL

NOAA Physical Sciences Laboratory (PSL) – Global Surface Temperature Anomalies – View animated version | PSL Map Room – Click the pic to view at source
Global – Sea Surface Temperature Anomalies
▶ NOAA NCEI – Optimum Interpolation SST
▶ NOAA Coral Reef Watch – Daily Global SST (5 km)
▶ NOAA OSPO – Ocean Products (including SST)
UAH Lower Atmosphere Temperature Anomalies – 1979 to Present (v6.1)
University of Alabama in Huntsville (UAH) – Dr. Roy Spencer and Dr. John Christy – v6.1 – Base period 1991–2020 – drroyspencer.com – Dr. Spencer’s monthly update at source
RSS MSU/AMSU Satellite Temperature Records – 1979 to Present (v4.0)
▶ RSS MSU/AMSU Time Series Browser – TLT, TMT, TTS, TLS (v4.0) – Interactive
▶ RSS – Upper Air Temperature Measurements Overview
Channels available: TLT = Temperature Lower Troposphere | TMT = Temperature Middle Troposphere | TTS = Temperature Troposphere/Stratosphere | TLS = Temperature Lower Stratosphere
Note: Per John Christy, RSS and UAH anomalies are not directly comparable — RSS uses a 1979–1998 base period (20 years), while UAH v6.1 uses the current WMO standard period, 1991–2020.
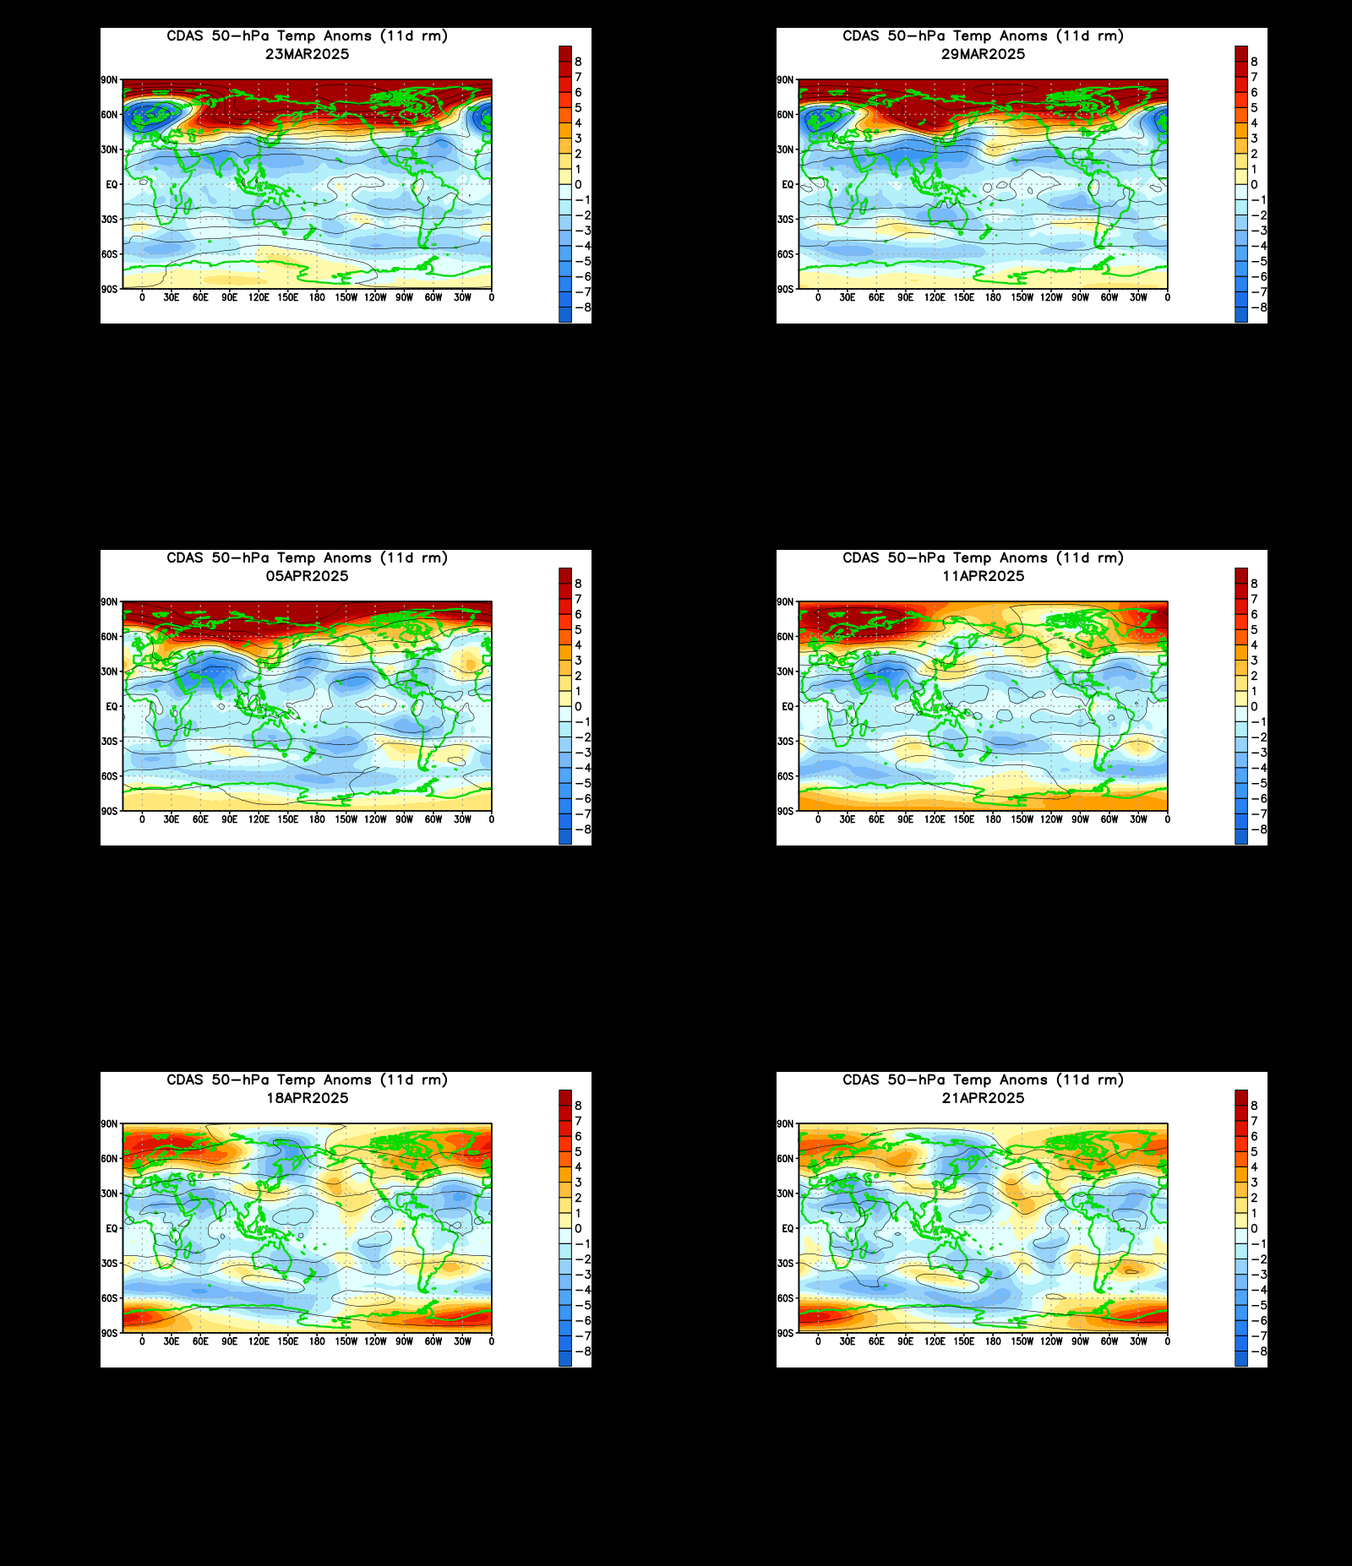
Global – 50-hPa/mb Height Temperature Anomalies – ~20,100 m (66,000 ft) – NOAA CPC
NOAA CPC – 50-hPa temperature anomaly animation page
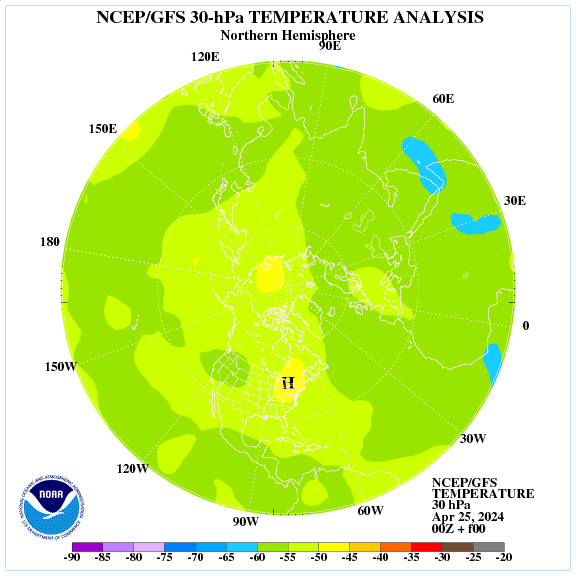
Global – 30-hPa/mb Height Temperature Anomalies – ~23,700 m (77,800 ft) – NOAA CPC
NOAA CPC – stratosphere analysis and forecast page (30 hPa, both hemispheres)
CPC’s daily GFS 30-hPa temperature analysis for the Northern Hemisphere (actual temperatures, not anomalies).
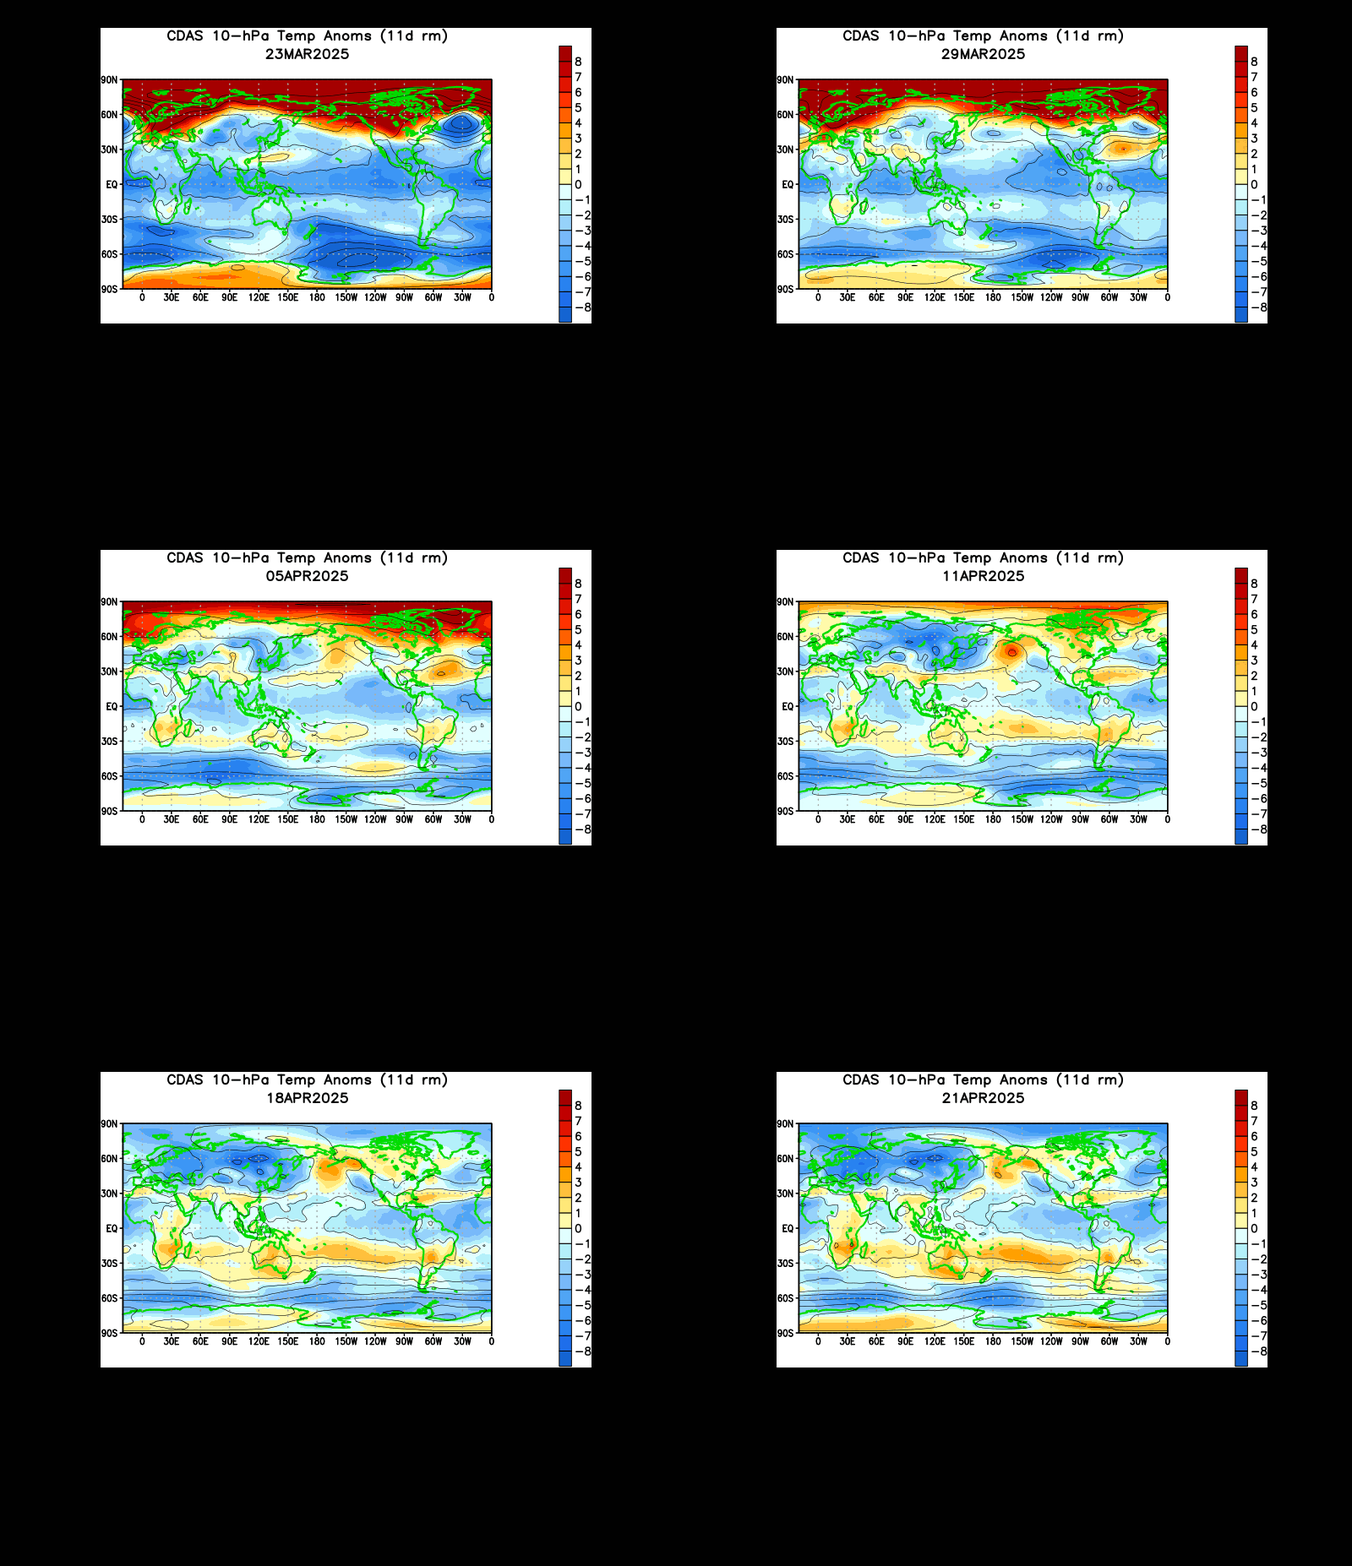
Global – 10-hPa/mb Height Temperature Anomalies – ~31,000 m (101,700 ft) – NOAA CPC
NOAA CPC – 10-hPa temperature anomaly animation page
Global Annual Temperature Deviations
▶ NOAA NCEI – Global Temperature Anomalies
▶ Berkeley Earth – Global Temperature Report
▶ NASA GISS – Surface Temperature Analysis (GISTEMP)
Atmospheric Transmission of Solar Radiation:
Apparent Atmospheric Transmission of Solar Radiation at Mauna Loa, Hawaii

NOAA Global Monitoring Laboratory (GML) – Mauna Loa Observatory – gml.noaa.gov – Click the pic to view at source
Atmospheric Moisture:
Atmospheric Relative Humidity – Global Monthly, 1948–Present
▶ NOAA PSL monthly climate time series
▶ climate4you – global temperature and humidity graphs
Atmospheric Specific Humidity – Global Monthly, 1948–Present
▶ NOAA PSL monthly climate time series
▶ climate4you – global temperature and humidity graphs
Clouds:
Global – Actual – Convective Cloud Top Heights in Thousands of Ft.
▶ CIRA SLIDER (NOAA/CSU)
▶ NASA Worldview
Atmospheric Pressure:
Global – 200-hPa/mb Height Anomalies – Atmospheric Pressure Anomalies at Approximately 12,000 m (40,000 ft)
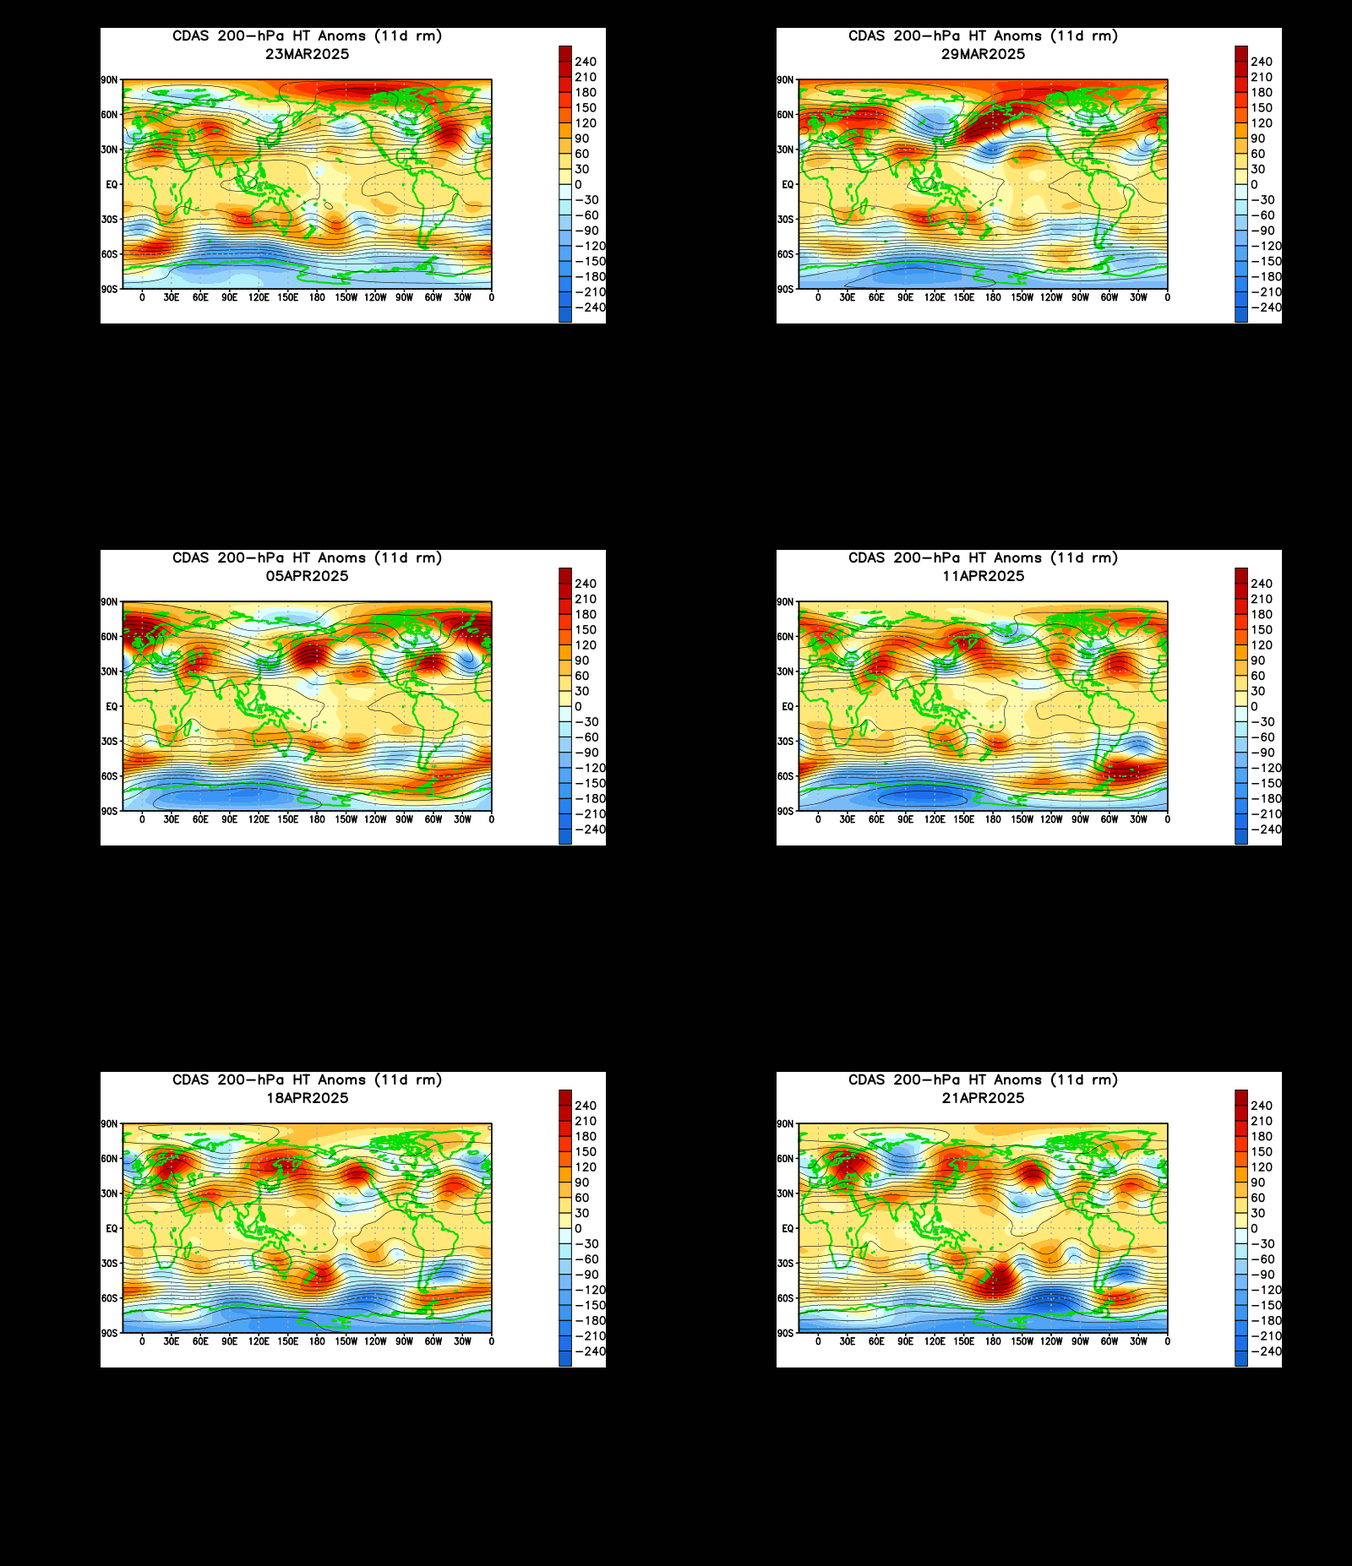
NOAA – National Weather Service – Climate Prediction Center (CPC) – Click the pic to view at source
Northern Hemisphere – 500-hPa/mb Height Anomalies – Atmospheric Pressure Anomalies at Approximately 5,500 m (18,000 ft)
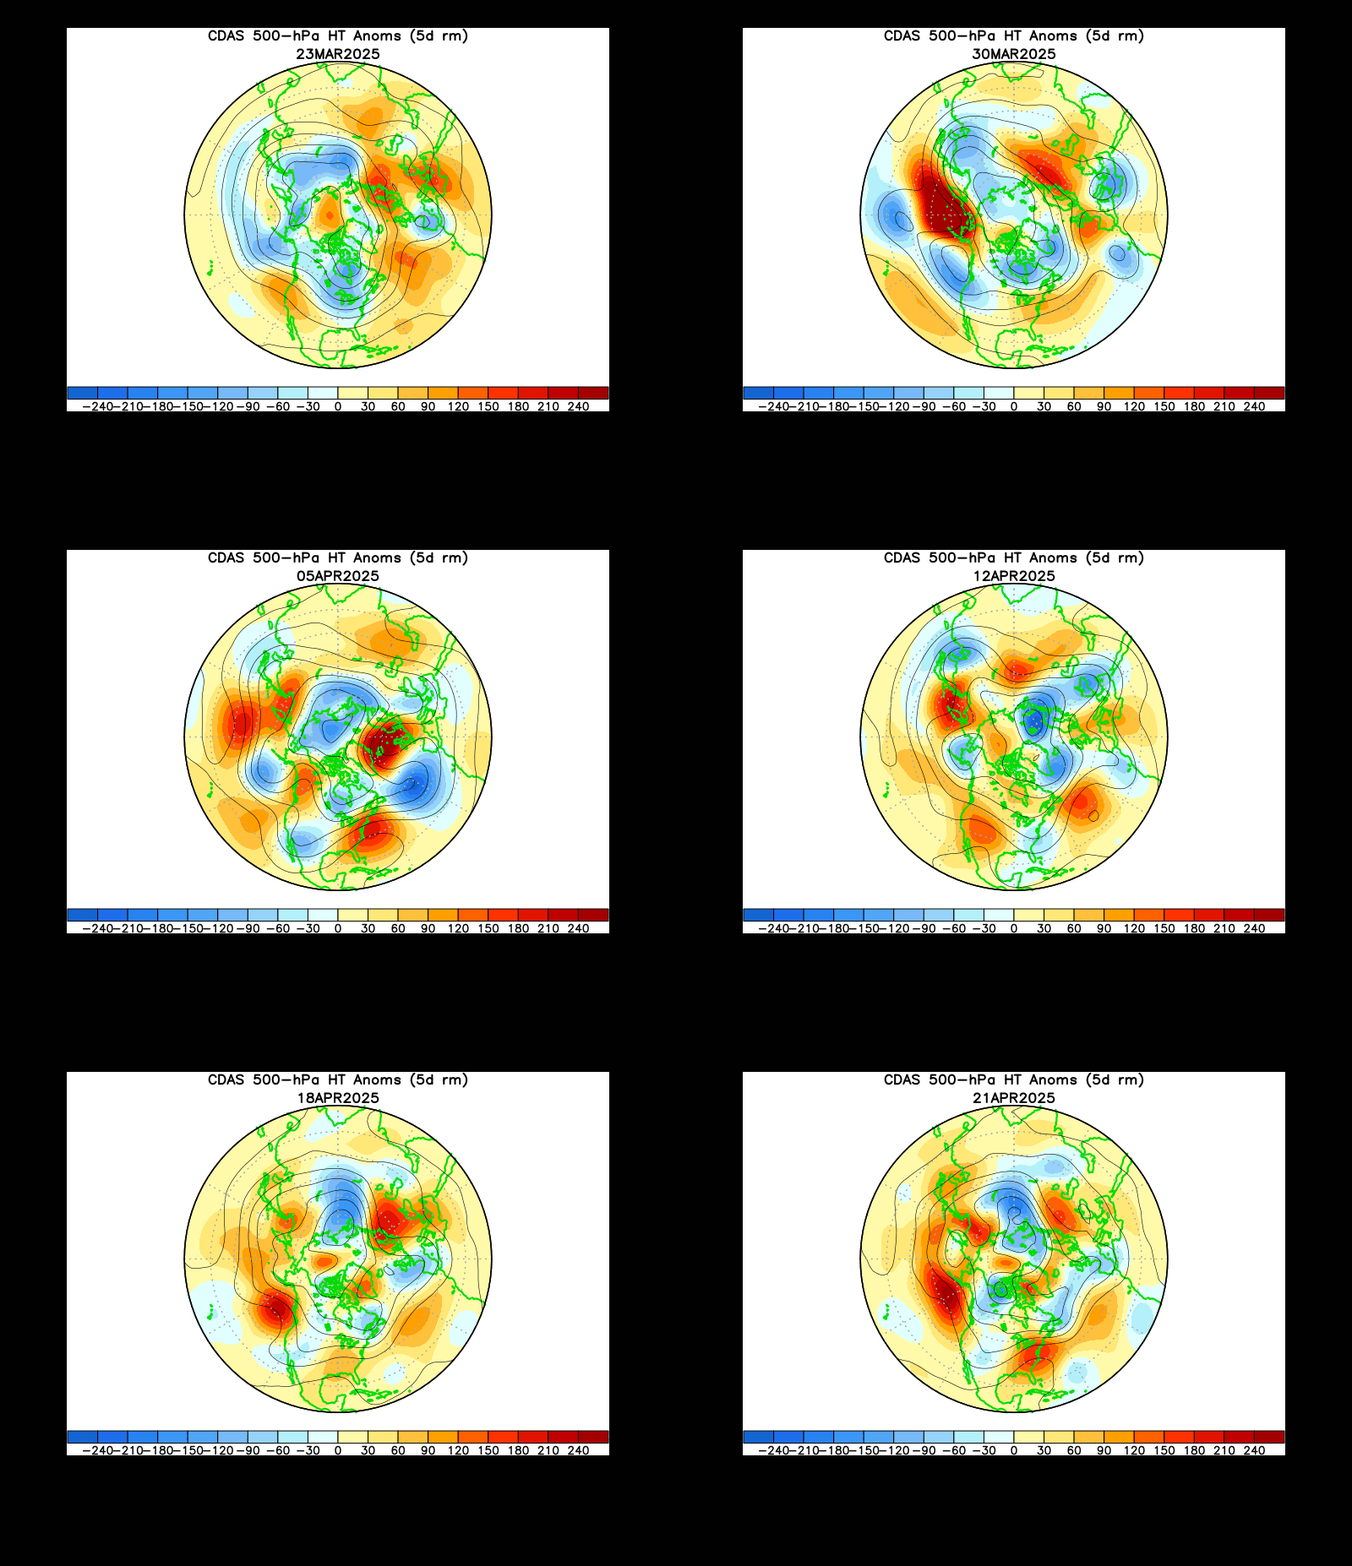
NOAA – National Weather Service – Climate Prediction Center (CPC) – Click the pic to view at source
Southern Hemisphere – 500-hPa/mb Height Anomalies – Atmospheric Pressure Anomalies at Approximately 5,500 m (18,000 ft)

NOAA – National Weather Service – Climate Prediction Center (CPC) – Click the pic to view at source
Wind Speed / Vectors:
Northern Hemisphere Heights and Wind Speeds – 250 hPa/mb (1 Day)

NOAA Physical Sciences Laboratory (PSL) – 250 hPa/mb Wind Analysis – View animated version at PSL – Click the pic to view at source
View a Jet Stream Animation – 250 hPa/mb Wind Speeds and Pressure at Approximately 10,000 m (32,800 ft) from StormSurf.com: Click Here
Ozone:
Cosmic Rays:
Oulu Neutron Monitor – University of Oulu, Finland

University of Oulu – Sodankylä Geophysical Observatory – cosmicrays.oulu.fi – Click the pic to view at source
Bartol Research Institute Neutron Monitor Network
Newark (DE) | McMurdo (Antarctica) | Thule (Greenland) | Fort Smith (Canada) | Inuvik (Canada)
▶ NMDB NEST – plot neutron monitor data for these stations
Individual Station Pages (NMDB):
- Newark, Delaware – NEWK
- McMurdo, Antarctica – MCMU (closed January 2017; historical data)
- Thule, Greenland – THUL
- Fort Smith, Canada – FSMT
- Inuvik, Canada – INVK
Bartol Research Institute, University of Delaware – www.nmdb.eu
Source Guide:
climate4you.com – Ole Humlum
Home Page – https://www.climate4you.com/
DrRoySpencer.com – Dr. Roy Spencer (UAH v6.1)
Home Page – https://www.drroyspencer.com/
Current Temperature Page – https://www.drroyspencer.com/latest-global-temperatures/
NOAA Physical Sciences Laboratory (PSL) (formerly ESRL Physical Sciences Division / PSD)
Home Page – https://psl.noaa.gov/
Map Room – https://psl.noaa.gov/map/
Current Weather Plots – https://psl.noaa.gov/map/wx/current.shtml
Data Page – https://psl.noaa.gov/data/gridded/
NOAA Global Monitoring Laboratory (GML) (formerly ESRL Global Monitoring Division / GMD)
Home Page – https://gml.noaa.gov/
Mauna Loa Observatory – https://gml.noaa.gov/obop/mlo/
Radiation Products – https://gml.noaa.gov/grad/
NOAA National Centers for Environmental Information (NCEI) (formerly NCDC)
Home Page – https://www.ncei.noaa.gov/
SST Products – https://www.ncei.noaa.gov/products/optimum-interpolation-sst
NOAA National Weather Service – Climate Prediction Center (CPC)
Home Page – https://www.cpc.ncep.noaa.gov/
Monitoring and Data – https://www.cpc.ncep.noaa.gov/products/MD_index.shtml
Atmospheric & SST Indices – https://www.cpc.ncep.noaa.gov/data/indices/
Regional Climate Maps – https://www.cpc.ncep.noaa.gov/products/analysis_monitoring/regional_monitoring/
Remote Sensing Systems (RSS) – MSU/AMSU v4.0
Home Page – https://www.remss.com/
Time Series Browser – https://images.remss.com/msu/msu_time_series.html
Upper Air Temperature – https://www.remss.com/measurements/upper-air-temperature/
University of Delaware – Bartol Research Institute – Neutron Monitor Program
Real-time Data (NMDB) – https://www.nmdb.eu/
University of Oulu – Sodankylä Geophysical Observatory – Cosmic Ray Station
Home Page – https://cosmicrays.oulu.fi/
StormSurf.com
Home Page – https://www.stormsurf.com/
Global Jet Stream (250 mb) – Wind and Pressure Animation
Weather Models / Ryan Maue (formerly policlimate.com)
https://weathermodels.com/
IRI/LDEO Climate Data Library – Columbia University
Home Page – https://iridl.ldeo.columbia.edu/
Global Maproom (atmospheric circulation and temperature) – https://iridl.ldeo.columbia.edu/maproom/Global/
SSEC / CIMSS – University of Wisconsin–Madison
SSEC Home – https://www.ssec.wisc.edu/
CIMSS Home – https://cimss.ssec.wisc.edu/
SSEC Data Center – https://www.ssec.wisc.edu/datacenter/
ECMWF – European Centre for Medium-Range Weather Forecasts
Home Page – https://www.ecmwf.int/
Charts – https://charts.ecmwf.int/
Additional Resources:
NASA Earth Observations (NEO)
https://neo.gsfc.nasa.gov/
General Subjects:
Atmospheric Circulation:
Wikipedia – Atmospheric Circulation
Wikipedia – Earth Global Circulation diagram
Atmospheric Pressure:
Wikipedia – Atmospheric Pressure
Atmospheric Waves:
Wikipedia – Atmospheric Wave
Brewer-Dobson Circulation:
Wikipedia – Brewer-Dobson Circulation
Ekman Transport:
Wikipedia – Ekman Transport
Gravity Waves:
Wikipedia – Gravity Wave
– Surface gravity waves (air–sea interface): Wikipedia – Surface Wave
– Internal gravity waves / inertial waves: Wikipedia – Inertial Wave
Geostrophic Currents and Wind:
Wikipedia – Geostrophic Current |
Wikipedia – Geostrophic Wind
Jet Stream:
Wikipedia – Jet Stream
Polar Vortex:
Wikipedia – Polar Vortex
Precipitation:
Wikipedia – Precipitation
Rossby Waves:
Wikipedia – Rossby Waves
Trade Winds:
Wikipedia – Trade Winds
Tornadoes:
Wikipedia – Tornado
Tropical Cyclones:
Wikipedia – Tropical Cyclone
Westerlies:
Wikipedia – Westerlies
 wpDiscuz