New Paper Calls into Question Reanalysis-Based and Climate Model-Based Explanations for the Slowdown in Global Surface Warming
Guest Post by Bob Tisdale
INTRODUCTION
The topic of this post is the paper Nieves et al. (2015) Recent hiatus caused by decadal shift in Indo-Pacific heating, which was embargoed until 2PM eastern today. The abstract reads (my boldface):
Recent modeling studies have proposed different scenarios to explain the slowdown in surface temperature in the most recent decade. Some of these studies seem to support the idea of internal variability and/or rearrangement of heat between the surface and the ocean interior. Others suggest that radiative forcing might also play a role. Our examination of observational data over the past two decades shows some significant differences compared to model results from reanalyses, and provides the most definitive explanation of how the heat was redistributed. We find that cooling in the top 100-meter layer of the Pacific Ocean was mainly compensated by warming in the 100- to 300-meter layer of the Indian and Pacific Oceans in the past decade since 2003.
The press release reads:
Redistribution of Heat in Oceans Explains Global Warming “Hiatus”
Since 2003, cooling in the top 100 meters of the Pacific Ocean has been compensated by warming in the 100- to 300-meter layers of the upper Indian and Southern Oceans, researchers say. These findings help to explain where the world’s heat has gone during the so-called climate “hiatus” — an apparent pause in global warming during the first decade of the 21st century. Because the Pacific Ocean covers such a vast expanse of our planet, say the authors, it is not surprising that its cooling could drive a significant change in temperatures globally. Surface temperatures around the world have cooled over the past decade or so, and scientists have been trying to determine whether this hiatus from the heat was triggered by an internal redistribution of heat in the ocean, with rapid warming happening at some deeper ocean level instead of at the surface, or if the world’s oceans are reducing their heat uptake. Now, Veronica Nieves and colleagues present an analysis of data collected over the past 20 years, which shows that Earth’s oceans have absorbed the same amount of heat — and that the planet’s atmosphere has let the same amount of heat through — for the past decade. Their results suggest that the interaction of the cooling Pacific Ocean, which covers nearly one-third of Earth’s surface, with the Indian Ocean at upper levels of the water column (from the surface to 300 meters depth) largely regulated global surface temperatures over the past two decades. During that time, temperatures below 700 meters didn’t change much at all, according to the researchers. Models of global climate should be updated to include these dynamics and account for the reorganization of heat within the oceans, they say.
Article #19: “Recent hiatus caused by decadal shift in Indo-Pacific heating,” by V. Nieves at University of California, Los Angeles in Los Angeles, CA; V. Nieves; J.K. Willis; W.C. Patzert at Jet Propulsion Laboratory in Pasadena, CA; V. Nieves; J.K. Willis; W.C. Patzert at California Institute of Technology in Pasadena, CA.
GENERAL COMMENTS
There’s really nothing new about the overall theme of Nieves et al. (2015). They blame the recent pause in surface warming on a rearrangement of heat within the oceans (like other papers)…and conclude that there has been no overall change in ocean heat uptake during the hiatus (like other papers). One novelty: they use data (not models, not reanalyses) to show where the heat has gone.
Our analysis indicates that during the most recent decade, cooling in the top 100 m layer of the Pacific Ocean is compensated by warming in the 100 to 300 m layer of the Western Pacific and Indian Oceans with the largest contribution in the tropics. The Southern Ocean plays a secondary role in warming the 100-300 m layer, but this warming is steady over both of the past decades. The Atlantic Ocean does show a switch from warming to cooling, but its area is so small that it cannot meaningfully contribute to the hiatus signal in surface temperature over the past decade (see figs. S1 and S2). Finally, we find little evidence for any change in warming rates below 700 m between the past decade and the previous one or that the net ocean heat uptake has slowed in the most recent decade.
The primary difference, however, between Nieves et al. and the other ocean-heat-uptake-increased-during-the-hiatus papers is that Nieves et al. say the variations in the heat uptake in the top 300 meters of the oceans can explain the hiatus, where others say the heat is hiding at greater depths.
With the final sentence of the paper, Nieves et al. conclude:
Furthermore, as previously shown for interannual fluctuations (11), the decade long hiatus that began in 2003 is the result of a redistribution of heat within the ocean, rather than a change in the net warming rate.
That sentence in some respects is a jab at climate model-based papers that claim the pause in surface warming was caused by decreases in radiative forcings. If there was no change in the net warming rate of the oceans to depth for the decades before and after 2003, then there hasn’t been a decrease in radiative forcings at the surface of the oceans.
Nieves et al. start the pause in 2003. With that start year, even the new NCEI (formerly NCDC) global land+ocean surface dataset (with its unjustifiable and overcooked adjustments) show warming at a rate that’s about one-third the rate simulated by the IPCC’s climate models for surface warming. See Figure 1. I’ve presented the model-data comparison two ways in Figure 1. In the top cell, the model output (multi-model mean) and data are referenced to the WMO-preferred period of 1981-2010, and in the bottom cell, to help highlight the differences in the trends, the model output and data were shifted so that their trend lines “zeroed” at 2003.

Figure 1
The GISS and UKMO HadCRUT4 surface temperature data, of course, show even lower warming rates, while the RSS and UAH (v6.0) lower troposphere temperature data show a very slight cooling from 2003 to 2014. Then again, Nieves et al. ended their analysis in 2012, so the trends would be even lower.
Another big-ticket item is that Nieves et al. point out problems with the reanalyses in the final paragraph. Pretty big slam (my boldface):
Comparison of several of the most commonly used reanalyses with ocean observations raises concerns about their fidelity in simulating temperature changes, or in quantitatively explaining the redistribution of heat associated with the recent surface temperature hiatus. Observational estimates provide a more accurate means of assessing oceanic temperature changes and show clear decadal signals that are robust across different analyses (see fig. S5) and clearly significant relative to observational errors. Our findings support the idea that the Indo-Pacific interaction in the upper-level water (0-300 m depth) regulated global surface temperature over the past two decades and can fully account for the recently observed hiatus.
Shifting topics, but related to the quote above: Nieves et al. fail to discuss in any detail the processes that cause “the Indo-Pacific interaction in the upper-level water (0-300 m depth)”, which are likely related to the sunlight-fueled processes of ENSO. Remarkably, the authors only make a passing reference to ENSO.
Because it covers nearly one-third of Earth’s surface, it is not surprising to find that surface cooling during the past decade appears to be mainly driven by the Pacific (see figs. S1 and S2). A closer look at different basins (figs. S8 to S12) shows that between 2003 and 2012 the most rapid warming in the top 300 m is around the depth of the thermocline (100-200 m) in the Indo-Pacific region and, to a lesser extent, in the Southern Ocean. This is also clear in the global maps (fig. S6) and the zonal average temperature trends in the upper 300 m (Fig. 2). In addition, this is where the most active redistribution of heat occurs on shorter time scales due to ENSO (11, 14).
It’s hard to believe that Nieves et al. discuss and present the ocean heat uptake of the Pacific Ocean but fail to provide anything more than a brief mention of ENSO.
Further to reanalyses, Nieves et al. write in the body of the paper:
Interestingly, reanalysis also do not seem to correctly reproduce the ocean warming rates and lie well outside the observation uncertainty at different depths and times. Both the hiatus and the net amount of heat absorbed by the ocean below 700 m are overestimated (see table S1). Reanalyses are also inconsistent with ocean observations, in terms of the vertical and regional distribution of heating. This is true for both global and basin-wide averages (see bottom panel of Fig. 1 and figs. S8 to S12). We found that biases are model dependent with NCEP showing the largest deviations, followed by ECMWF (particularly in the 00s within the 300-700 m layer) and SODA…
Nieves et al. then go on to describe problems with the individual ocean reanalyses. Those discussions of the flaws in the ocean reanalyses are quite remarkable.
The press release ends with a comment about climate models:
Models of global climate should be updated to include these dynamics and account for the reorganization of heat within the oceans, they say.
Easier said than done. In order to do that, climate models would have to properly simulate ENSO processes and their variability on decadal timescales. That would mean that modelers would have to use ENSO-caused variations in sunlight at the surface of the tropical Pacific to properly model ENSO ocean heat uptake and redistribution, and that’s a thorn in the side of the AGW hypothesis that modelers have been avoiding. The modelers would also have to be able to hindcast ENSO, which is chaotic. Good luck with that.
POINTS OF INTEREST
First: As noted above, the authors use 2003 as the start year for the hiatus, later than many discussions of the slowdown in surface warming. They compare the ocean heat uptake at different depths for the two decades of 1993-2002 and 2003-2012. I’ve included their Figure S6 as my Figure 2 as an example.

Figure 2
Second: Why did Nieves et al. excluded data for 2013 and 2014? They could just as easily have written the paper for the 12 years before and after 2003, instead of using 10 years. Are the results dependent on the start and end years? Considering that ENSO plays large roles in the uptake of heat in the tropical Pacific and its distribution from the tropical Pacific at depth, the results likely depend on the start and end years, especially over such short (decadal) timeframes.
Third: Looking at all of the left-hand maps of subsurface temperature trends for the period of 1993-2002 in my Figure 2 above, one should question the significance of the trends, considering (1) that they’re looking at a short, decade-long period, and (2) that there is so little source data prior to the ARGO, especially in the Southern Hemisphere.
How sparse are the measurements of subsurface ocean temperature in the Southern Hemisphere prior to the ARGO era? Take a look at Animation 1. It presents maps of the locations of quarterly temperature measurements at 250 meters from the NODC website here, starting in 1993 and ending in 2012. Let the animation play through and watch the severe drop off in the number of observations when the animation shifts from 2012 back to 1993. Then notice how the number of measurements and their spatial distribution drops off even more in the late 1990s/early 2000s, until the ARGO floats are introduced in quantity around 2003/04.

Animation 1
How realistic are the 1993-2002 trends at various depth ranges presented by Nieves et al., especially when there are so few observations and such a decline in the numbers and spatial coverage of the temperature measurements at depth in the late 1990s/early 2000s?
Fourth: Nieves et al. present data (sea surface, depth-averaged temperature and ocean heat content) for the Atlantic, Indian and Pacific Oceans…and for the “Southern Ocean”. An example is their Figure S1, which I’ve included as my Figure 3. It presents sea surface temperature data (Reynolds OI.v2) for the globe and ocean basins, with the data smoothed with 5-year filters.

Figure 3
Note the warming of the “Southern Ocean” sea surfaces. That warming stands out like a sore thumb, because we know the surface of the Southern Ocean, as typically defined as the oceans south of 60S, shows cooling with the Reynolds OI.v2 data. We plot it every month in the sea surface temperature updates. See Figure 4, which is from the most-recent sea surface temperature model-data comparison.

Figure 4
(The climate models used by the IPCC show a relatively low warming rate for the surface of the Southern Ocean (90S-60S), but the data show a slight cooling. Note also that the surface data in Figure 4 are presented in absolute terms, not anomalies and that the models start about 0.7 deg C too warm, based on the trend lines.)
The map presented in their Figure S18 (my Figure 5) helps to explain why Nieves et al. (2015) shows warming at the surface of the “Southern Ocean”. They use a convoluted definition of the Southern Ocean, convoluted inasmuch as they do not use a fixed latitude for the Southern Ocean. Notice also the overlap of the Southern Oceans and the Atlantic, Indian and Pacific Oceans. That means (1) the results shown for the Southern Ocean are not independent of the Atlantic, Indian and Pacific results and (2) the Atlantic, Indian and Pacific results include their respective portions of the Southern Oceans. The odd definition of the “Southern Ocean” certainly skewed the results shown in their Figure S1. Did it skew the rest of their results?

Figure 5
The big question: Why did Nieves et al. use such an oddball definition of the Southern Ocean? Maybe it was so they could claim…
The Southern Ocean plays a secondary role in warming the 100-300 m layer, but this warming is steady over both of the past decades.
As a reference: you’ll remember from the October, 2014 post There is a Wide Range in the ARGO-Era Warming (and Cooling) Rates of the Oceans to Depths of 2000 Meters, the NODC’s depth-averaged temperature data for the Southern Ocean (with the typical definition of 90S-60S) shows no warming to depths of 2000 meters, starting in 2005.

Figure 6
Fifth: Nieves et al. take a jab at papers that claim the missing heat is hiding in the deep oceans below 700 meters:
Analysis of deep hydrographic data in comparison with satellite measurements of sea level change indicates a contribution of 0.76 mm/year of sea level rise due to thermal expansion within 700-2000 m (22). Assuming a thermal expansion coefficient of 1.3 × 10⁻⁴ °C−1 for that layer, this implies an average warming of 0.0045°C/year between the mid-90s and mid-00s and between 700 and 2000 m. Data below 700 m in the pre-Argo era (prior to 2004) were extremely scarce (14), which can cause objectively mapped estimates to be biased low (23). WOA’s pentadal estimate provides an alternative reference value, which should suffer somewhat less bias since 5-years of data are mapped simultaneously instead of only 1 year. The WOA pentadal estimate shows a heat content increase of 2.4 × 10²¹ J/year or about 0.0015°C/year (1993-2002 period, 700-2000 m layer). The latter is consistent with the 0.0013°C/year rate of warming for the 700-1500 m layer as measured by the Argo array in the 00s (table S1). Together, these findings suggest no significant increase in the rate of warming below 700 m since 2003. This is consistent with Levitus’ results (12), but contradicts Ishii’s estimate, which shows increased heating on the order of +0.0029°C/year between the 90s and the 00s for the same layer (table S1).
Sixth: Last, while reading the paper, you’d note that trend uncertainties are rarely presented in the text. Just look at the quote above. That’s really unusual for a scientific study! How did it pass peer review without listing uncertainties in the text?
CLOSING
Scientific periodicals send out press packages about soon-to-be-published (embargoed) papers when they believe those papers are newsworthy. The newsworthy parts of Nieves et al. (2015) are the discussions of the problems with ocean reanalyses and how climate modelers got the answer wrong…again.
It will be interesting to see how the alarmists react to this paper since so many of them don’t even acknowledge the slowdown in surface warming.
Redistributive change.
Just added a link to the paper (paywalled):
http://www.sciencemag.org/content/early/2015/07/08/science.aaa4521.abstract
Surely the reason they didn’t use 2014 data is that the Paper was written in December of that year but was not published for 6 months
Tonyb
Tony Bob would not understand
Surely the reason they didn’t use 2014 data is that the Paper was written in December of that year but was not published for 6 months
##############
One of the nasty little tricks people use is the following.
You have data up to june 2015.
You decide to end the data at 2014.
You write your paper through 2014.. and submit .. its jan 2016.
You start reviews…
6 months goes by
finally in june of 2016 at final edit a reviewer says… hey.. update the data.
and that can can be kicked down the road foreever.
[snip]
Ah, Mosh. You coders have it easier than I do, as I am a near illiterate in that. I had to update to USHCN2.5. I did it in Excel by hand. Also typed in all the new metadta (with lots of qc) from HOMR. It was a monumental chore.
OTOH, I have the data-metadata rich USHCN to play with. You got Outer Mongolia. Plus, I only have to go back to 1979. I can afford to drop the perturbed stations (so I do). You can’t. So split you must. But I’ll have some suggestions for your pairwise soon enough.
GHCN is a spotty beast, and if even better bits like the BOM can’t tell us if an AFB did a station move (as at Amberley), it must be pretty bad. Never seemed to occur to them to swivel their dang chairs, punch a few buttons and, like, find out. I think those guys need to get more mud on their boots. I was nailing down up to a half dozen stations a day back in 2009 by interview, and airports were the easiest; you didn’t even have to know the curator’s name.
Steve Mosher and tonyb, you’re conveniently overlooking the basis for the question: time sensitivity to ENSO. As I wrote in the post: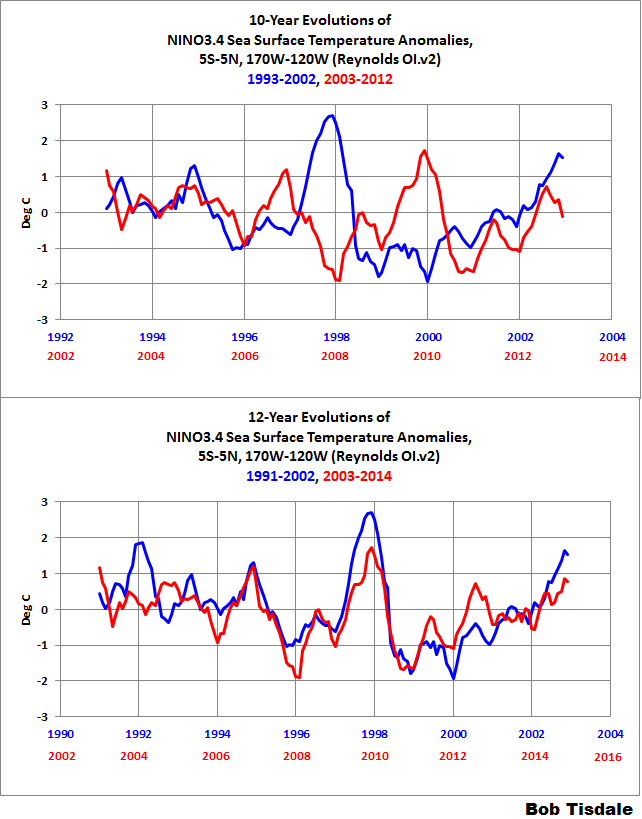
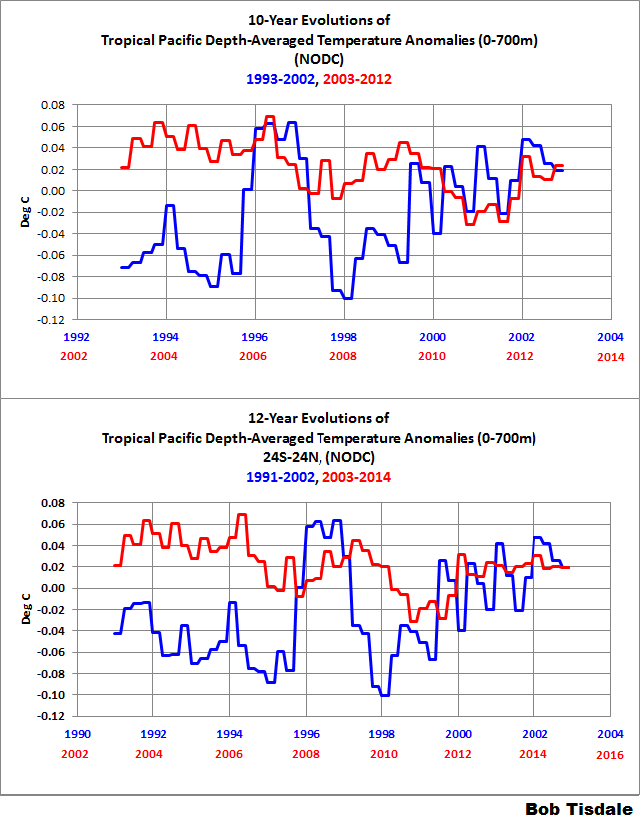
“Are the results dependent on the start and end years? Considering that ENSO plays large roles in the uptake of heat in the tropical Pacific and its distribution from the tropical Pacific at depth, the results likely depend on the start and end years, especially over such short (decadal) timeframes.”
Let me clarify:
Example 1: Are the results of Nieves et al. dependent on the timing and strengths of individual ENSO events, as represented by NINO3.4 sea surface temperature anomalies?
Example 2: Or, looking at the depth-averaged temperatures of the tropical Pacific for the depths of 0-700 meters, do the results of Nieves et al. depend primarily on the volatility of the responses of the subsurface temperatures of the tropical Pacific to the 1995/96 La Niña, the 1997/98 El Niño and the 1998-01 La Niña…and the simple decline in subsurface temperatures since 2003?
It is ridiculous and they will be proven wrong soon. Not much more to say other then I am sure the manipulation of data will continue along with these lame excuses.
Watch what happens to sea surface temperatures once the solar flux fall s below 100 in a consistent fashion.
Then we will have to hear the next excuse I suppose.
Clueless manipulative AGW enthusiast that will not quit in coming up with anything and everything to promote there soon to be obsolete theory.
But because they are so arrogant it gives opportunity for alternative theories which fly right in the face of AGW theory, such as what I have suggested so many times. I have to thank them for that because without their extreme stance opportunity to present a different stance would not be present.
Missing heat found! Located in ships “buckets”. Argo buoy’s terminated for cause due to inability to perform the job for which they were employed. And after all, there is no hiatus.
(Do I have it right, and is sarc tag a requirement?). Generously considering myself amongst peers, looking forward to reviews and immediate posting of this scholarly work of mine.
What channel is the tennis match?
About spit out my coffee after reading your post!!!!!!!!!
Thanks, Bob.
There seems to be a few papers claiming to explain “the pause” and others claiming there is not a pause. This stuff is beginning to get boring – think Greece, the Donald, …, watching brown grass in the summer.
Actually, of real interest are the shifting winds over the NE Pacific bringing temp & precip changes to Washington and Oregon.
Finally, some cooler weather is coming. Some of the apples in our orchards got a little heat stressed.
Doen’t this new paper disagree with the Huang 2015 SST revisions that Karl used to erase the pause?
Before reading the article I had the distinct impression that nobody really knows what’s going on with Earth’s climate system. The observations we have are too sparse and too uncertain, and even these cover too short a period.
Nieves et al effectively trash other scientists who claim to know what’s going on, and Bob Tisdale effectively trashes Nieves et al.
I finished reading the article with an even more distinct impression that nobody really knows what’s going on with Earth’s climate system.
Precisely! So much to learn. Settled science indeed!
Heh, our team has learned a tad. And we’ll be teaching it, too. (And I will defend in enemy territory.)
Good analysis, Bob. Once again we see disagreement between the modelers, the data manipulators, and those using actual observations. This brings into question the whole notion that we can in some way take the entire Earth’s temperature in a meaningful way. Global warming is just another gross simplification – along with the claim that CO2 is the master climate control and that spending money on carbon reduction will in some way change future climate – that obscures the fact that this science is far from settled. Of course the most vociferous climate alarmists never actually read the research papers, and wouldn’t understand them if they did.
They are attempting to cover all the bases in hopes that one of them will gain traction and convince the public to believe. The problem is they are contradicting each other in the process.
Sounds to me like a call for reasonable skepticism!
Thanks Bob your analysis is always thought provoking.
Redistribution of Heat in Oceans Explains [why there’s no reason to worry about] Global Warming
Not so fast. It’s just running around looking for ways in can cause positive water vapor feedback in the atmosphere while still being in the oceans.
Redistribution of heat in the oceans is called Natural Variability.
It has been going on at least since the end of the last Ice Age.
http://www.vukcevic.talktalk.net/E1.gif
Embargo(ing), Massaging, Fine tuning, Smoothing, Eliminating….since when do these words have anything to do with true science – let alone the simple truth….
What a bunch of ……s.!!
Now, if they’d look at cloud behaviour they’d catch a clue.
Next!
By the way, how did this get published in Science which declared the hiatus a fable just a couple of weeks ago? Cognitive dissonance, global climate models be thy name.
==============
Heh, this paper really smacks models around.
=========
Perhaps that is why it took nearly 7 months to be accepted for publication in what i thought was a rapid response journal .Lots of off- scene discussions perhaps – which is good of course .
There are more interesting charts in the “supplementary materials” section of the link provided by Bob above.
Modelers vs. Observers. It begins.
===================
during the so-called climate “hiatus”…
Wonder how they feel about NOAA saying their paper is wrong?
In order for it to be right, there has to be a pause…NOAA says there’s no pause
Nieves and Willis are at NASA JPL. NASA now says pause, oceans. Published in Science. NOAA (Karl 2015) says no pause. Published in Science. Science editor Marsha McNutt just editorialized that the climate science was settled. Obama assured us climate science was settled. How unsettling this must be for them.
I wonder if McNutt is aware of the discrepancy and if so, how she let this happen.
=======================
Andy Revkin must be wondering a little. He’s bright enough to note the discrepancy between the two papers.
Here’s your chance, Andy; settle the science. Heh, should you choose to undertake the mission.
=========
This is the sort of thing that Andrew Revkin wouldn’t have time to research, just going by the rationalizations he’s used in past.
He couldn’t bother to investigate Karl. Now I’ll bet a little corner of his mind wishes he had.
===========
Double heh, heh. I’ve just noticed Josh Willis’s name on the paper. A shot across the bow if I ever saw one. I’ve long had faith in Josh’s integrity; nice to see it validated.
==============
Yes, that gives the paper considerable credibility which is why it is surprising that in an online journal sch as this it took six months from submission to pub
Ovation. Unless it was seen as being contentious perhaps?
Tonyb
It just takes a good story to earn a pub ovation at the Angler’s Rest.
============
How about a Willis v. Willis? Theirs and ours.
Am I even reading this correctly:
The authors claim if there is no change in the net warming rate, but the heat has moved around, then there must have been a change in the net warming rate ….
geeze I thought Alice in Wonderland was fiction
So, no warming that survives through the year.
If you round to a single digit (same as measurments)
Min temp annual anomaly is 0.0 +/- 0.1F
Max temp annual anomaly is 0.0 +/- 0.1F
So warm water moves around, but adds no year to year increase in global temperatures.
[inserted “pre” html for table data. .mod]
It adds up. With the oceans 70% of the globe, it takes less to raise global temps. We find that land trends are up to doubled, but that only has about a ~15% effect on overall AGW because of the size of the ocean. With the ocean, a little goes a long way. (Dr. Karl would know about that.)
Sounds great.
Oh.
But they are there, right? Point 6 is just a style issue if they are there.
And it’s good to see Karl et al get another kicking. By “good” I mean “funny”.
I wonder if some of the dissent in his office over Karl’s paper was at least partly because some saw this paper coming.
The two papers don’t co-exist in the real world. Something’s got to give.
==============
‘Recent modeling studies have proposed different scenarios to explain the slowdown in surface temperature in the most recent decade. ‘ Given no increase , in the scientific sense , is called a ‘slowdown’ there by avoiding having to use words like paused, what would a decrease by called, really really slow down or reverse increase?
If the slope goes significantly negative I can’t wait to hear the competing explanations… it will be just like a teenager trying to explain why there’s a crease in the fender of a 56 T-bird.
Not if, when.
The slope will never go negative. They’ll readjust the past right through the next glacial period and tell us that the “record warm” temperatures of 2014 were really a global average of -30C
How can this be reconciled with the AR5 chart that shows no model underestimate of ocean heating?
You can’t say the models are wrong because the heat went into the oceans if the models aren’t wrong about the ocean heat.
I’m losing track. Is this excuse 65 or 72 to explain all the non-warming they insist hasn’t been taking place for the last two decades?
Pointman
The lead author’s name means “snows” (plural noun, not verb) in Spanish.