Holocene century-on-century changes have a standard deviation close to 1deg C, so if there is a signal due to carbon dioxide, it still has not emerged from the background noise
 Guest essay by Philip Lloyd
A paper of mine has just appeared in Energy and Environment:
(Lloyd, Philip J. An estimate of the centennial variability of global temperatures. Energy & Environment, 26(3), pp. 417–424 2015. DOI: 10.1260/0958-305X.26.3.417
with an abstract:
“There has been widespread investigation of the drivers of changes in global temperatures. However, there has been remarkably little consideration of the magnitude of the changes to be expected over a period of a few decades or even a century. To address this question, the Holocene records from several ice cores up to 8000 years before present were examined. The differences in temperatures between all records which are approximately a century apart were determined, after any trends in the data had been removed. The differences were close to normally distributed. The average standard deviation of temperature over a century was 0.98 ± 0.27 oC.
This suggests that while some portion of the temperature change observed in the 20th century was probably caused by greenhouse gases, there is a strong likelihood that the major portion was due to natural variations. “
I was led to this by a statement from Trenberth et al in AR4 “The standard deviation of the HadCRUT3 annual average temperatures for the globe for 1850 to 2005 shown in Figure 3.6 is 0.24°C. The greatest difference between two consecutive years in the global average since 1901 is 0.29°C between 1976 and 1977, demonstrating the importance of the 0.75°C and 0.74°C temperature increases (the HadCRUT3 linear trend estimates for 1901 to 2005 and 1906 to 2005, respectively) in a centennial time-scale context.”
This can only be regarded as naïve – the standard deviation of annual temperatures cannot indicate much about the standard deviation
over a century.
“This suggests that while some portion of the temperature change observed in the 20th century was probably caused by greenhouse gases, there is a strong likelihood that the major portion was due to natural variations.”
It seems this statement contradicts the premise of your argument, which is that no measurable temperature change in the 20th century can suggest any unnatural cause until it exceeds 1C.
There is no contradiction. Likelyhood of some warming can be 100% and still the signal is undetectable as such.
Yep undetectable after a half doubling of the effect of CO2 above 280 ppm. What’s 2X undetectable again, so we can get our bearings on a full doubling ?
Any other climate parameters where the effect is above the square root of F-all ??
Or the warming can be 100% caused by little green aliens or whatever else you might imagine. But it’s all purely theoretical until the warming exceeds the range of natural variability. That’s the claim being made here. Therefore the claim specifically DOES NOT “suggest” any specific cause. If he wanted to make this statement and be consistent with his argument he might as well have written “my guess is that some portion of the temperature change observed in the 20th century was probably caused by greenhouse gases…” That’s why he contradicts himself.
“Likelihood” and other fudge words are unscientific terms used to persuade people. That is why the ipcc use it. If it can’t be measured then it remains conjecture only.
Bruce Cobb is correct.
In science, data is essential. Measurements are data. But there are no measurements quantifying what the fraction of AGW might be, out of total global warming from all sources.
If any of the rise in temperature is man-made, there are still no measurements quantifying that putative fraction. Thus, man-made global warming is ipso facto a conjecture.
Philip Lloyd – Thanks for notifying us of your paper, but regrettably I have to disagree with a part of it – or at the very least seriously question. You say “[..] This suggests that while some portion of the temperature change observed in the 20th century was probably caused by greenhouse gases [..]“. The part before “This suggests” did not appear to me to contain or imply any such suggestion. Where in your data was there any suggestion that greenhouse gases changed in their effect at all? As I read it, you did not address the effect of greenhouse gases, and you did not find any temperature changes that indicated greenhouse gases having any changed effect. I therefore don’t see how you can justify the bit that I highlighted.
I regarded that statement on GHG attribution as an obeisance to the CC dogma gatekeepers to get published. Nothing more.
This is the problem with just about ALL so called “climate science”. The Data address one thing or the other …. but they almost NEVER address any effect of GHGs. … HOWEVER .. in almost every case, and probably the main driver behind the inclusion of “GHGs caused the recent warming” in papers, the inclusion of a mere sentence, pure op-ed, leads to the perception that there is some sort of consensus that GHGs are significant at all.
I’d like to see someone do a paper on such. If I had the time, and the personal fortune, I’d do a Medical Style assessment on climate research, where you look at the data, and line up the conclusions. I can almost guarantee that in “97%” of the cases, the data say nothing about GHGs induced global warming, but the sentence “due to climate change” will be included.
When I was in grad school many years ago, casually chatting with professors about “publish or perish” and obtaining grants, one made a statement that if the current fad or government interest was in “black squirrels” then anyone with any brains automatically changes their paper subject and conclusions to include SOME mention of “black squirrels.” So, for example, if you want to study, say, radon levels in homes, your grant proposal becomes a study on radon levels in homes and it’s possible effects on black squirrels. And then even if your paper has nothing in it to speak of about black squirrels (other than the inclusion in the title of course), by gawd your paper conclusions tag on a line something like: and therefor it’s suspected that the radon levels detected may also affect black squirrels…. more research is needed to quantify this effect. Or something along those lines anyhow.
I think we see the black squirrel effect applied very liberally to most papers even remotely related to “climate change.”
@William Hickman Nitschke, @Mike Jonas
The crucial word you both are missing is “while”.
While some warming might have been (or not) caused by X, Y, or Z, the data suggests that there is a strong likelihood that the major portion was due to natural variations.
You might want to read:
“Hypothesis Testing Relies On The Fallacy Of False Dichotomy”
http://wmbriggs.com/post/15947/
I still see no problem with Lloyd’s comment. Furthermore, I consider it irrelevant in regards to the finding, that is, the estimation of the centennial variability of global temperature.
You can lead a horse to water…
You welcome to show how the paper’s findings are incorrect.
Right.
So, Phillip, please explain the GHE in the light of Plancks Laws and the Laws of Thermodynamocs. Both are clear that the GHE is impossible. ie., heat can only travel from hot to cold. The reverse is impossible.
Therefore blankets, jackets etc. are all hoax?
Johnmarshall please don’t confuse radiation with conduction.
That certainly explains why my microwave oven does not work.
John I suggest you include the word “spontaneous” when saying anything about the direction of heat flow.
Graphicconception microwave ovens do not transfer “heat” and without your intervention of plugging it in and pushing a button nothing happens. In fact there are things that you can put in a micro wave oven and they will not get warmer as they do not absorb the emissions of the cyclotron.
WPeszko reducing the rate of cooling is not transferring heat. Insulation.
Radiation flows out from any object that is above 0K. It flows to all other objects in line of sight, regardless of the temperature of the other objects.
mkelly, radiating objects do not transfer heat, they radiate it, which is graphicconception’s point.
So called greenhouse gases work by radiation, not conduction.
MarkW then he is wrong in his example. As you are in your explanation of what he said.
mkelly,
There’s no cyclotron in a microwave oven. It’s a magnetron which produces microwaves (electro-magnetic radiation), cyclotrons accelerate charged particles.
Let go of this naive understanding of thermodynamics. If work is done in the process, you can move from cold to hot making the cold colder and the hot hotter – the refrigeration cycle. Yes, it does occur naturally in the atmosphere, too. Simply when warm winds rise up one side of a mountain they cool by expansion (adiabatically). They don’t have to wait for conduction from the colder surroundings at the mountain top. When this cool air flows rapidly down the other side, the reverse happens. It (Chinook winds) compress and heats up solely from this process with no need for added heat to the cold initiating air. Chinooks have caused temperature in mid winter in Alberta to jump 40C.
“The greatest recorded temperature change in 24 hours was caused by Chinook winds on January 15, 1972, in Loma, Montana; the temperature rose from -48 to 9 °C (-54 to 48 °F).”
http://en.wikipedia.org/wiki/Chinook_wind
Adiabatic behavior is, indeed, the first think you will have learned in thermodynamics to get you started. Refresh your knowledge on this pivotal concept. PV=nRT
At Gary Pierce.
Well I believe that Chinook winds simply replace pre-existing cold air with pre-existing hot air; so that is not a Temperature change, that is a location change. The hot air simply moved to where the cold air had been.
So it is simply convection, which is what winds are.
mkelly, you can believe whatever you want. However that doesn’t make your beliefs rational.
If I were preparing Lloyd as an expert witness for trial, I’d have to ask him the obvious question ‘Don’t you mean just that: “This suggests that there is a strong likelihood that the major portion was due to natural causes?”
He should stop there at that conclusion. Why add that the evidence suggests there is some warming ‘probably due to greenhouse gases?’ There is nothing else, no evidence shown anyway, that can be gleaned from his paper about historical temperature deviations that supports the conclusion that greenhouse gases probably causing additional warming, or if so, he should be prepared to identify on cross examination those portions in the report that support such an additional conclusion. I don’t see the evidence there myself for the extra statement. Otherwise, the conclusion that any heat is “probably” (instead of ‘might have been’) caused by greenhouse gases” is extraneous, almost gratuitous, there in a conclusion for another purpose. What could that other purpose be?
B,
Correctomundo. Evidence is lacking. The argument for MMGW is by made assertion, not by verifiable, testable evidence.
All of it.
People are as natural as the sunrise.
The differences were close to normally distributed. The average standard deviation of temperature over a century was 0.98 ± 0.27 oC.
=====================
99.7% of natural variability will lie within +/- 3 standard deviations. Thus, a change of average temperature as much as +/- 3C per century is within the bounds of natural variability.
It was not naive. It was “convenient.” As in, Purposeful. A willfull adherence, with a heavy dose of cognitive bias, to a dogma that required temp rise of the 80s-90s be anthropogenic CO2, to support the models, rather than vice versa. That in a nutshell defines the pseudoscience that the IPCC (and Trenberth) now wear to call anyone who disagrees with them “blasphemers” (aka, d*niers of the orthodoxy).
With roughly 30% of all manmade CO2 emissions since 1750 being emitted over just the last 19 years, with virtually no global warming trend observed over the past 19 years to show for it, it’s becoming painfully obvious global temperatures are much less sensitive to CO2 than CAGW hypothesizes.
Dr. Lindzen and other scientists suggest CO2’s contribution to total global warming since the end of the Little Ice age could be as little as 0.2C, which is consistent with “The Pause” observed for almost two decades…
The longer “The Pause” continues, despite record annual manmade CO2 emissions, the higher the probability CAGW is a busted hypothesis.
Observed satellite temperatures are already 2+ SDs below CAGW model-mean projections, and could well be 3+ SDs off in 5~7 years if current trends continue…
CAGW is on the cusp of being laughed and eye-rolled into oblivion.. None of CAGW’s dire predictions are coming even close to reflecting reality, so if the Scientific Method is still the measure of science, CAGW’s days are numbered…
CAGW adocates are quickly running out of excuses and time to explain why their hypothesis has failed so miserably for such a long duration.
From Samurai:
“Observed satellite temperatures are already 2+ SDs below CAGW model-mean projections, and could well be 3+ SDs off in 5~7 years if current trends continue…”
The snake is biting it’s own tail. The alarmists chose, quite deliberately, to include hopelessly and demonstrably wrong climate models in their “model mean” numbers for the single reason of getting a high average number.
They practised to deceive. Now, saddled with an alarming model mean, the pause, much sooner than it should have, caused the problem you describe so clearly. The only reason the temperature will be three standard deviations away from the model mean is because they chose such a silly number to begin with.
It is no longer possible to claim the temp is still within an expectable envelope. They saddled themselves with the hockey stick, and now they are getting beaten with it.
Everyone but everyone knows the high models are ridiculous. The IPCC only clings to them because it brings up the model mean. The lowest projections are probably reasonable but not in the slightest alarming. The pause is well within the envelope of reasonable models, but the model mean of the whole suite doesn’t allow them to use that lower value as a founding argument. They are stuck with the artificially and baselessly inflated number, provided in part by the relentless Canadian environment service which funds the second worst ‘prediction’ of all. Now their own number bites them in the ass.
Pretty much, but why stop at 8000 years? The hollowscene ain’t nuttin’ but another interglacial. Proxy indications of the entire range of earth temperature range from 7 to 20 deg. C. We have no explanation for any of this variance. Error bars are a joke. The only factor we can reasonably exclude is Carbon dioxide.
Lets look at the run up in T since 1979. (The Ice Age scare https://stevengoddard.wordpress.com/1970s-ice-age-scare/ endorsed by most every scientific body at the time)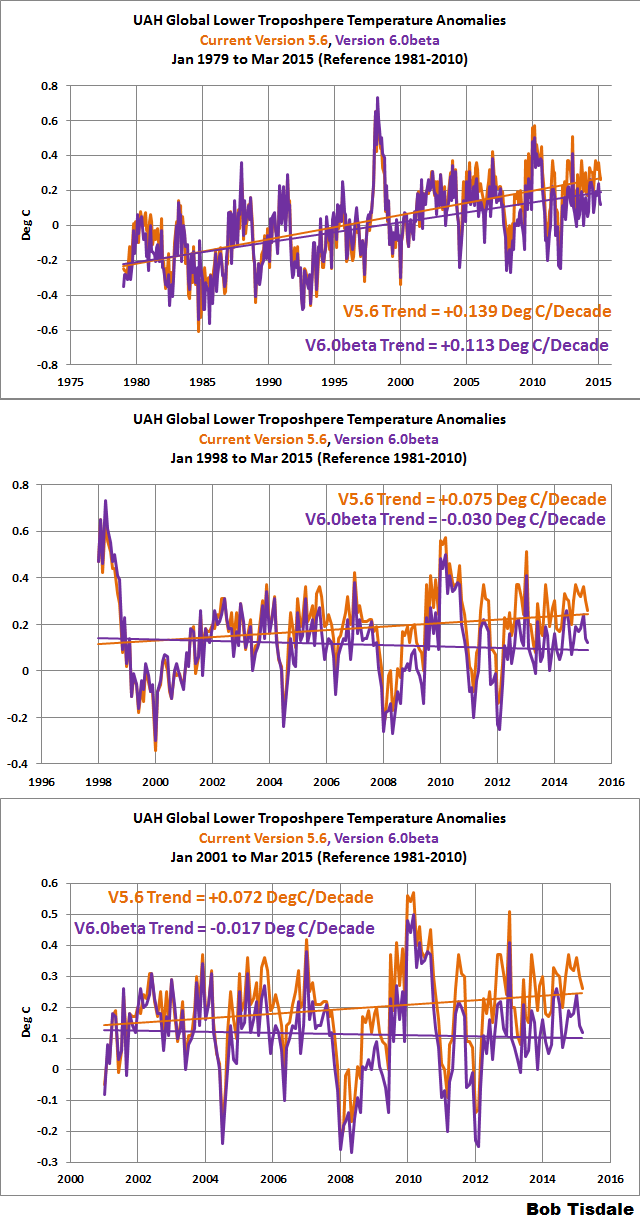

So we look at a smidge below -.2 C in 1979. And we look 2015 and see a smidge below plus .2 C, for a total increase of .4 c in 36 years. However we notice the trend line pulled down a bit by two volcanic events, and the the large step change up in 1998. During this time we did have a “Super El Nino, and we did have a positive AMO, with a very strong correlation to NH T.
Hadcrut 4 showing a smidge under .4 degree drop from the 40s high. If the reverse were to happen, a “super la Nina”, and a strongly negative AMO, what would the GT be? Could it erase the warming since 1979???
The point about these plots is that it is glaringly obvious that there is no straight line linear trend.
It is the use of a straight line linear trend (when the data shows something rather different) that has got ‘climate science’ into such a mess.
The fact is that there is no first order correlation between temperature and CO2 in any of the temp data series. The satellite data in particular makes it clear that there is simply a one off step change in temperature in and around the Super El Nino which event was almost certainly natural in origin and released a large amount of heat in the atmosphere.
What is not understood is why the temperature released in the 1998 Super El Nino has not dissipated/is taking so long to dissipate (depending how the ‘pause’ pans out).
Presently all one can say about climate sensitivity is that if there is such a thing we cannot measure the signal to CO2 over and above the noise of natural variation using our best temperature measuring devices. this may suggest that climate sensitivity is very low, however, I consider that there are wide error bounds to the various temperature data sets and given these wide error bounds, it is conceivable that climate sensitivity could be quite large (may be even as large as 1degC per doubling).
But as matters presently stand one is forced to conclude that there is no firm evidence (ie., evidence that withstands ordinary scientific rigour) that suggests that in real world conditions of Earth’s atmoosphere that CO2 does anything to control temperature such that it is likely that climate sensitivity, if any at all, is modest to non existent.
Of course, on top of that, in the proxy record, there is evidence that CO2 lags temperature and is a response not a driver of change. .
Shucks, forgot the satellite graph since 1979…
UKMO-CRU, NASA/GISS, NOAA/NCDC can do all the temp data fudging homogenization, cherrypicking, infilling they want. But nature doesn’t care. The polar sea ice levels have too many eyes on it to fudge. The agricultural productivity of the world has too many eyes on it. Local high low temp records are too many to refute when heat waves fail to materialize when cold spells abound. Tropical storms, same; too many eyes for them to fudge everything. Reality is bee-yotch slapping the climate change liars pretty regularly now.
The climate change modellers have done all they can with their grasp of reality. They’ve built their fake runways, bamboo control towers, manned with natives wearing the latest coconut model headsets… and still the airplanes don’t land and the global temps don’t move lockstep upward. Everything is right, but something terribly fundamental eludes their grasp.
Quite so, if nature does not play ball.
However, the warmists always rely upon an El Nino and are no doubt praying for a large one in the run up to Paris. If it pans out that way, it will not matter that there may be a La Nina in 2016/7 which brings down the anomaly and which by then extents the ‘pause’ to over 20 years. The only saving grace is that unless a lot of money is on the table, there is no way that China or India will play ball, and hopefully Australia and Canada will be luke warm and this may encourage a certain amount of realism that a deal to screw the West/Developed NAtions cannot be struck.
I thought the 97% used non-transitive dice…..
http://www.singingbanana.com/dice/article.htm
And don’t forget that Trenberth helped write the latest Royal Society and NAS report that states that human co2 emissions could stop today and we still wouldn’t see a change in temp or co2 levels for thousands of years. Here is their point 20 AGAIN.
I ask again , do they really believe this or not? And do the RS and NAS really believe in the mitigation of their CAGW?
https://royalsociety.org/policy/projects/climate-evidence-causes/question-20/
Neville: What’s the difference between a Rancher and an AGW climate scientist like KT? A Rancher has the BS on the OUTSIDE of his boots.
Wayne I agree with you. BUT these two science academies and KT, Solomons etc are supposed to be the best.
It’s okay to claim it’s all BS, but how do they always get a free pass? Surely there must be a journo somewhere who would call them to account for their BS?
I work in the telecom and television industry, the number of journalists that will or can tackle an issue of any complexity are very few and far between, and the number of journalists that have the substantive knowledge to take on a subject like this probably numbers in the “zeros.” Most journalists, (sic), are just looking for a story that will compete with other stories for web page space or on-air-time, so they go with the most outrageous narratives, like Hansen’s and Mann’s, because that makes for a more splashy headline.
Most “journalist make up what they write, God forbid they do research, they have a dead line to met, they can’t do any damn research! Add on to it they were the C & D students to begin with is it any wonder they can’t get anything right!
@Hugh
…There is no contradiction. Likelyhood of some warming can be 100% and still the signal is undetectable as such….
There are some delicate nuances of language going on.
English is a very ambiguous language, and meanings can be varied subtly (or radically!) by changing the placement of clauses in a sentence.
…This suggests that while some portion of the temperature change observed in the 20th century was probably caused by greenhouse gases, there is a strong likelihood that the major portion was due to natural variations. “…
In this case, putting ‘This suggests’ at the front of the sentence means that it governs the ideas following it – so the finding of 0.98+/-0.27 ‘suggests’ both that some portion is anthropic and some portion is natural. Which is not really the case.
It would have been better to say that:
…While some portion of the temperature change observed in the 20th century was probably caused by greenhouse gases, this suggests that there is a strong likelihood that the major portion was due to natural variations. “…
Ain’t English grate?
There is no doubt that in my mind the sentence is ambiguous, and possibly contradictory. It was no doubt deliberately framed in that manner. Possibly because with proxy evidence/data there are always large margins of error. Does anyone really consider that it is possible to conclude a trend +/- 0.27degC with proxy evidence?
That said, the final quoted sentence is an over extrapolation of the point made in the paragraph concluding: “…The differences were close to normally distributed. The average standard deviation of temperature over a century was 0.98 ± 0.27 oC.”
Proxy evidence is only useful as relative data, not absolute data.
And we have politicians to thank for what is called “modern” English (UK). It’s no wonder we can say the same thing in so many different ways.
Or so many meanings for the same words.
Indeed so. And is why so many other cultures are adopting “American English” because it says, what it says, on the can. But English English is like this…
This paper makes an important distinction, which papers like Markot, Shake’n’Mix willfully ignore: you cannot compare variability in data with a sampling frequency often measured in centuries or even millenia from ice cores and other proxies with the variability in annual or monthly ‘anomalies’.
The interannual variability is about twice the interdecadal variability ( and both are very similar to temperature changes )
https://climategrog.wordpress.com/?attachment_id=233
It is probably that centennial change is even less: it’s the integrating effect OHC
A centennial change of 0.7 deg C in SST is not alarming. What appeared alarming in late 1990s was the rapid uptick. But now Richard Betts of UK Met Office has just told us that this was understood and largely predicted. ( Though that is the first time I’ve heard that said ).
Kudos to Philip Lloyd for getting this published.
forgot the graph: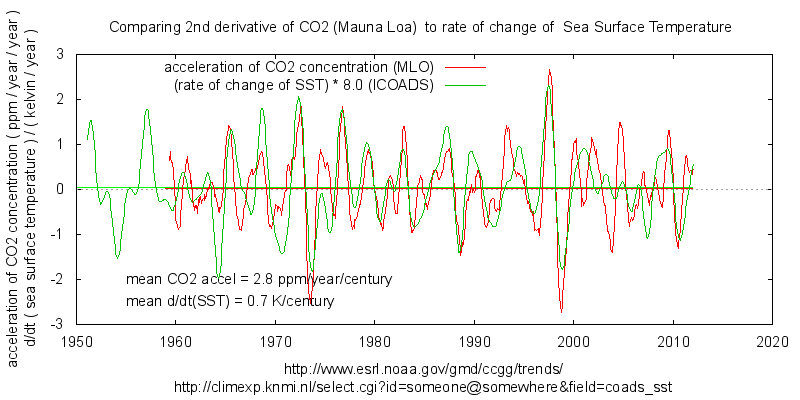
The correlation is clear. There is no credible case for claiming that changes in CO2 cause changes in SST. Plenty of evidence that SST is the cause and CO2 the effect.
Excellent, thanks for the graphic.
Mike , thank you for the plot. I expect many readers here have observed the fact that the current pause in the rate of ground temperature rise is coincident with the linearity of the CO2 concentration increase , ie dT/dt ->0 as d2CO2/dt2 -> 0 but have not seen it so elegantly demonstrated .. The problem is why is there such a dependence.?
I looked in a standard textbook , RM Goody’s 1995 edition of “principles of AtmosphericPhysics and Chemistry ” and tried playing with the simple equations in Para 5.3.2. The only way I could get linearity of dT/dt is by situation where the optical density of CO2 is vanishingly small compared to that of H2O . This contrary to observation , so is ruled out. There must be another CO2 related function but I have no clue what that might be.
I wonder if the Monckton equation is compliant with your graph?
There are lots of charts available that show ∆T is the cause of ∆CO2. Here is one of many I have saved.
But I have never found a similar chart showing that changes in CO2 cause subsequent changes in temperature.
dbstealey , thank you for your reply . Since I failed to reconcile Mike’s plot with the standard forcing theory as given by , for example, Goody , it leads to the reluctant conclusion that the standard theory is either incorrect , or , more probably , much exaggerated .
However this leads me to conflict with the theories and conclusions of scientists whose hems I am not worthy to touch so I am somewhat apprehensive in concluding that increase in CO2 follows rather than leads increase in temperature . However at present I see no alternative , which means that the standard radiative transfer theory needs reinvestigation . So who is going to do that?
mikewaite,
CO2 does lag temperature at all time scales see:
http://cdiac.ornl.gov/trends/co2/vostok.html
a paper discussing the observed (empirical) relationship observed bewteen CO2 and temperature during the Pleistocene
and
http://www.climatedata.info/Forcing/Emissions/Emissions/CO2_files/BIG03-co2—vostok-ice-core.gif.gif
a decent graphic for starters. Wikipedia also has some decent graphics for Vostok.
Mike said:
“What appeared alarming in late 1990s was the rapid uptick. But now Richard Betts of UK Met Office has just told us that this was understood and largely predicted.”
I would like to know how they could have predicted the AMO and Arctic warming from the mid 1990’s, especially as increased forcing of the climate should have reduced that warming by increasing positive NAO/AO conditions.
Still seems that science wanders within their lack of understanding of the natural law. How much time and money spent so far. we could have another one of our globe to buy somewhere in the universe. All this is happening in the form of clear and unclear processes that conform to natural laws, it is the result of mutual relations of celestial bodies in the solar system. Measurements and theories will never lead to a true knowledge of the causes of any phenomenon. It must be understood that we are formed within all these events in the universe, only we have the desire to be above it all and that we are the main factors in these changes, which is a big misconception.
First, the focus should be the origin of matter and all its associated properties. The most important thing is to figure out the concept and the formation of gravity, magnetism, electrical charge and the movement of matter. All manifestations of the heavenly bodies are the consequences of mutual relations of these major properties of matter. This applies to all the planets and celestial bodies in the entire universe. Our influence in such global changes in nature is absolutely unimportant. Our actions can cause some local changes, but that we warm up the planet by some cycles, which some attribute to our activity, it is absurd.
Focus on the effects of the mutual effects of magnetic fields that are “occupied” by those elements in movement that change their electrical charge. Therein lies the secret of all phenomena that modern science or not, or does not know to understand
100%.
We will not wait too long, I guess someone will realize that this is just a contest who will more nonsense to publish about this enigma. I will mention that this planet, but 4 of them are “organizers consensus” sunspot cycle of about 11.2 years, which are only indicators of what will happen. And what will happen depends on the intensity of the resultant impact of these planets to the sun. There are other many cycles which can be set for all time, in my, not theory, but the evidence (mathematics, astronomy, diagrams, etc.). I expect assistance programs, if any some interest.
I think these discussions useful, inasmuch as it is a lot of real relevance to the issue, but it’s out of the line leading to the true causes of the phenomenon.
Extremely well said sir. Appreciate your clarity and wide perspective.
Thank twice: first, that there is someone who has similar views and perhaps prove that in the near future to come to the fore and, secondly, as a simple, but very precise way of giving your opinion.
If global temperatures refuse to rise as models predict, high natural variability can rescue the models. Just define natural variability as the difference between the model and the observations and your model will always be fine. As long as there is some warming, however slight, you can pick any climate sensitivity you’d like and human caused warming can be said to dominant. For instance, if your model says that it should warm 5C over a century, but in reality temperatures only increase by 1C, then find 4C natural variation (cooling), and since 5C is more than 4C, human influence is still dominant.
Steiner– I’m sure the CAGW advocates will try to blame natural variability on the lack of CO2 induced warming for almost 2 decades, however, they can’t have their cake and heat it, too.
If, for example, they claim decreasing sunspot activity is the natural variable causing “The Pause”/cooling, then they logically have to admit that the strongest 63-yr string (1933~1996) of solar cycles in 11,400 years was the primary cause for 20th century’s 0.8C of warming; not CO2…
If they don’t do this, it’s completely impossible to explain why their hypothesis and climate models, which assume strong CO2 sensitity, don’t work…
Humans are breaking annual CO2 emissions records every year, with absolutely no global warming to show for it for almost two decades….
The CAGW: assumptions, math, physics, statistics, models, projections, etc., are completely falling apart and the longer these huge discrepancies exist, the higher the probability CAGW is a failed hypothesis.
“If, for example, they claim decreasing sunspot activity is the natural variable causing “The Pause”/cooling, then they logically have to admit that the strongest 63-yr string (1933~1996) of solar cycles in 11,400 years was the primary cause for 20th century’s 0.8C of warming; not CO2…
I don’t think they have to admit anything. They are doing government science and they are paid in many different ways to deliver the message that CO2 control is absolutely necessary. They are peddling myth not science, so they will twist logic into a pretzel as the need arises.
Samurai, you are completely correct in principle, but let’s get the numbers right. When you run the numbers, the modern maximum in solar activity includes the SC23 peak years. Using whole cycles isn’t necessary.
Using SIDC sunspot numbers, for the 68 years from 1936-2003, in terms of sunspot activity, the Sun had 89% more activity than the previous 68 years,1868-1935, (annual SSN of 76 vs 40.2). Using Dr. Svalgaard’s preliminary revised SSNs from 2014 (to be finalized in August), the disparity was 71.7% (73.5 vs 42.8).
The Sun caused global warming!
The ‘pause’ is the Earth’s cooling response to overall much less solar activity since 2003. Therefore,
The cause of the ‘pause’ was the cause before the ‘pause’!
That is too simple of an explanation for many, so they mistakenly try making it more complicated than it is.
Agreed: “CAGW is a failed hypothesis”.
The assertion that 75% of the warming in that last 50 years was due to a natural cause (it’s the sun) did not get traction when there was 18 years without warming.
18 years without warming might be a pause, a hiatus in a warming trend.
Do you think in your face cooling could change people’s minds?
http://wattsupwiththat.files.wordpress.com/2012/09/davis-and-taylor-wuwt-submission.pdf
I wonder what caused cyclic warming and cooling on the Greenland Ice sheet in the past? Curious that the same periodicity (time between events, 1500 years with a beat of +/- 400 years) between all warming and cooling events/cycles (including the massive ‘Heinrich’ Event is the same (same periodicity, same forcing function). It is also really weird that the warming and cooling periodicity is observed in both hemisphere.
Greenland ice temperature, last 11,000 years determined from ice core analysis, Richard Alley’s paper. William: As this graph indicates the Greenland Ice data shows that have been 9 warming and cooling periods in the last 11,000 years.
http://www.climate4you.com/images/GISP2%20TemperatureSince10700%20BP%20with%20CO2%20from%20EPICA%20DomeC.gif
Everyone of course is aware that there is now above normal total sea ice (sum of sea ice both poles). There is record sea ice in the Antarctic every month of the year and the Arctic sea ice is recovering.
Snowfall is above average on the Greenland Ice sheet.
Greenland Ice is cooling which is interesting, as the Greenland Ice sheet has ground zero in terms of amount of warming in the last 30 years.
Checkout the lack of melting on the Greenland Ice sheet.
http://beta.dmi.dk/en/groenland/maalinger/greenland-ice-sheet-surface-mass-budget/
Unfortunately I can’t see the whole article but two things puzzle me.
1. What is this concept of “average SD”? Which values of SD were taken in order to create this average?
2 .Normally if something is within +/- 3SD of the average we would consider it to be explainable by natural variation. This would imply temperatures could vary by up to almost 3’C before we would need to invoke AGW, and I’ve never heard anyone say that. If the SD of temperature is so large then this whole AGW thing would never have got off the ground in the first place…. would it?
Simple; add up all your SDs, and divide that sum by the number of SDs. There; that’s your average SD.
What it means ??
Nothing; it’s just something defined that way, in statistical mathematics.
As a geoligist, I regard man (both sexes) as part of nature, therefore even climate change attributed to man is by definition “natural”. It is only religious types who consider man (both sexes) as “not part of nature” and who therefore can consider some climate change as “unnatural”. I believe it is really significant to identify those people who do not consider themeselves as part of nature because it is always those people who want to control nature by controlling other people.
I am a religious type and consider man a part of nature. I don’t think it’s necessary to generalize and lump us religious types all together. More specifically the point is about if our ommissions of C02 that we choose to put in the atmosphere are warming the planet or not. Religion has nothing to do with it. If anything religions people are supposed to have faith in a higher being which suggests to me that they wouldn’t be so worried about climate change. You also imply religious types want to control people and that is an unfair generalization that is not true of every religious type.
Quite so Victoria. Well said.
Izzat omissions or emissions ? Omitting and emitting are sort of at cross purposes.
Not implying any judgment; but what types of religions don’t make any attempt to control the behavior of their adherents. Some even want to control the behavior of non adherents; to the point of wanting to kill non compliers ( and actually doing that ) , mohammedans for example ?
I agree with Victoria it is not religious types, it is specifically the green religion that has morphed into a warped ideology of man separate from nature and harmful, injurious, detrimental, deleterious, damaging, hurtful, destructive, and ruinous to nature..
If standard deviation is greater than observed change, then NOTHING can be concluded or even suggested. You have in effect NO evidence of ANYTHING!
Well the SD doesn’t really have any quantitative meaning except for data sets that exhibit a normal distribution of values.
And then it only separates cases closer to the mean from cases further from the mean. And remember the exact values of all data set items are known; so the SD doesn’t tell you anything that you didn’t already know.
“This suggests that while some portion of the temperature change observed in the 20th century was probably caused by greenhouse gases, there is a strong likelihood that the major portion was due to natural variations.” joelobryan said “I regarded that statement on GHG attribution as an obeisance to the CC dogma gatekeepers to get published. Nothing more.” Indeed, it was a sop to a reviewer – was I arguing with the physics that said carbon dioxide had to contribute to the warming? I responded that the Big Question was not whether is contributed, but how much, and eventually we agreed on the text.
” … was I arguing with the physics that said carbon dioxide had to contribute to the warming? I responded that the Big Question was not whether is contributed, but how much, and eventually we agreed on the text.”
Most understandable Dr. Lloyd. Even here at this site, one can not argue that CO2 does not contribute to the warming of the surface of the planet. One may argue that CO2 contributes very little. So, you did the same sort of thing to get the paper published. Understandable.
One can not argue, with scientific evidence to back up ones’ argument either way. The warming effect, however small, remains conjecture.
Bruce, there are those of us who would argue that we can, indeed, prove that CO2 does not warm the surface. However, that argument is not allowed here. See site policy.
“The reason there is so much contention regarding “global warming” is relatively simple to understand: In climate change science we basically cannot prove anything about how the climate will change as a result of adding extra greenhouse gases to the atmosphere.
So we are left to argue about unprovable claims.” John R. Christy
https://rclutz.wordpress.com/2015/04/25/on-climate-theories-response-to-david-a/
To sum up:
Catastrophic: No evidence and abundant evidence to the contrary.
Man-made: Effects on “climate” observed locally, as in the UHI effect.
Global: Little to no evidence globally, but see above.
Warming: Even the sign of any human effect can’t be known, ie whether the net effect of human activity is to warm or cool the air. But even if it’s to warm, so far that has been a good thing, however negligible, as has increased CO2 itself.
Climate Change: Of course. Earth’s climate has been everything from covered with a global ocean of molten rock to same of water ice, and everything in between.
No event has ever happened twice; that would be a different event.
Ergo climate must change, since it cannot repeat.
Philip Lloyd
I read your paper with interest and I accept its main conclusion. But I write to request your comment on a possible criticism of the paper.
This thread has included much discussion of a single sentence in the paper’s abstract. But there has not been much debate about an underlying assumption used in the analysis the paper reports.
The analysis was of temperatures indicated by proxy data from four ice cores (i.e. GISP, GISP-2, Vostock and Dome-C).
The paper’s conclusion includes
This begs the question as to whether it is valid to compare the proxy indications from ice cores to the increase that “thermometers recorded”.
If that comparison is not valid then it is reasonable to challenge the paper’s major conclusion ; viz.
Richard
Richard – one thing the ice cores do well is record temperature CHANGE. The end of the last ice age is clearly shown in many cores, and both the rate of change and its timing are similar. They don’t however, do a very good job on absolute temperatures, so comparison with thermometer records is dubious. I was primarily interested in change, for which they seem to do quite a reasonable job.
Philip Lloyd
Thankyou for your reply.
I stress that I agree your conclusion and your reply to me. However, they could both be questioned by doubters who could have difficulty equating your admitting the ice cores have problems indicating “absolute temperatures” and your comparison of “centennial standard deviation of temperature” with “During the 20th century, thermometers recorded an increase of about 0.7°C”.
I am trying to be helpful.
Richard
A waste of everybody’s time thanks to the get out clause at the end . .
I cannot access the paper.
There is yet another problem.
When you zoom in closely on ice core isotope temperatures and temperatures derived from other biologic proxies there are often mismatches, for instance: http://www.geol.lu.se/personal/seb/Geology.pdf.pdf
So if you look at the water cycle, isotope ratios in precipitation depend on two main factors, temperature during condensation at the source of the precipitation and raining out (Raleigh fractination) out on the path to the destination http://courses.washington.edu/proxies/AirTemp_2.pdf
However temperature during condensation is the effective dewpoint at the sourec location, which is much less dependent on source temperature but much more on absolute humidity.
And there is also the seasonal precipitation ratios that average out over the year. Wet summers or dry winters making the average precipation isotope mix “warmer” and vice versa. A combination of both effect explains the deviation that Bjorck et al 2002 -previous link- observe
ice core isotope thermometer are considered the gold standard however there are many complications challenging its reliability.
Just select a number of suitably conflicting proxy records average them and the inconvenient Holocene Optimum goes away not to discombobulate the true believers ever more:
http://upload.wikimedia.org/wikipedia/commons/c/ca/Holocene_Temperature_Variations.png
“During the Holocene itself, there is general scientific agreement that temperatures on the average have been quite stable compared to fluctuations during the preceding glacial period. The above average curve supports this belief. However, there is a slightly warmer period in the middle which might be identified with the proposed Holocene climatic optimum. The magnitude and nature of this warm event is disputed, and it may have been largely limited to high northern latitudes” (Wiki).
Next up the Eemian.
I don’t know what you mean. I thought we’re discussing paleo climate here, not politics. Incidently many proxies support a clear Mid Holocene Thermal Optimum, for instance the North Asian treelines That could be a much better paleo thermometer.
http://sciencearchive.uwaterloo.ca/~twdedwar/reprints-pdf/2000-qr-macdonald-et-al.pdf
But by the same token, many proxies do not support a cold Younder Dryas, nor a cold Older Dryas.
For all you hockey stick fans, there’s a nice one in that chart between 10 and 12 Thousand Years BP.
It depends on the relative humidity. That’s why we measure and report it.
No, It’s the dewpoint is predominantly a function of the amount of water vapor per volume and a little bit a function of the total pressure. That’s what determines the isotopes ratio at the moment of condensation. The initial ambient temperature of that air parcel at ground level is not relevant. If it’s relatively warm, it will take longer during ascend before condensation takes place.
For instance if you take a standard emagram http://en.wikipedia.org/wiki/Emagram
I made an example here:
you’d see that an rising air parcel starting with a temperature of 20°C and a dewpoint of 15°C (RH 73%) will start condensation in the lower blue circle at about 14°C at around a pressure around 920 Hpa
We also see that a rising air parcel of 30°C and a dewpoint of about 17°C (RH 46%) will start condensating again at 14°C in the upper blue circle.
But in both cases the ice cores get the same initial isotope signature that goes with a condensation at 14°C, however the real source could just as easily have been 20°C or 30°C. So, that’s the essential problem for ice cores. They register local dewpoint (like 14°C here in this example), not the ambient temperature.
The North Atlantic SST or its de-trended version Atlantic Multidecadal Oscillation–the AMO is the best known and likely to be most representative exponent of the climate’s natural variability.
The record could be split into two sections 60 years apart, 1860s-1950s and 1920s-2010s From 1860 to 2014 overall warming is about ¼ degrees C/century, and curiously also repeated by each section individually, while the 30 years min/max differential in each section is about 0.4C. This would imply a self-sustained natural oscillation.
http://www.vukcevic.talktalk.net/AMOq1.gif
This 60 years repeatability is ‘augmented’ by 0.2C temperature jump between sections, which it could be due to number of factors ranging from another longer term underlining natural process or simply the ‘anthropogenic’ data adjustment but
It is not possible to reconcile with the CO2 rise, whenever from 1860 to 2014, the CO2 effective starting point is taken.
Since TSI or other sources of energy have not the required variability, the most likely case is that the temperature variability is result of the available energy redistribution across the region, i.e. more equatorial heat content is moved pole-ward and less radiated into the space and vice versa.
This can be archived by alternative increase and reduction either in the volume or velocity (or both) of the Gulf Stream and the North Atlantic Drift current. The SST changes are strongly dependent on circulation and salinity stratification of the upper ocean’s layers. The deep ocean’s influence is a factor reflected in the thermohaline circulation (THC) including the N. Atlantic’s “overturning circulation”.
More HERE
1. Introduction
Our previous study showed that the response of tropospheric pressure to variations of solar activity (SA) and
galactic cosmic ray (GCR) fluxes reveals a regional structure determined by the positions of the main
climatic atmospheric fronts, as well as it strongly depends on the epochs of the large-scale circulation
[Veretenenko and Ogurtsov, 2012]. In the epochs of increasing intensity of the meridional circulation (the
form C according to Vangengeim-Girs classification [Vangengeim, 1952; Girs, 1974]) an increase of GCR
fluxes at minima of the 11-year cycle is accompanied by an intensification both of extratropical cyclones at
Polar fronts of middle latitudes and Arctic anticyclones at high latitudes of the Northern hemisphere, as well
as by a weakening of the equatorial trough at low latitudes. In the epochs of decreasing meridional
circulation the troposphere response to SA/GCR variations reveals a similar regional structure, i.e., the
regions of most pronounced effects are closely related to the climatic atmospheric fronts, but the sign of
SA/GCR effects in these regions is opposite.
It was also detected [Veretenenko and Ogurtsov, 2012] that the evolution of the meridional circulation
is characterized by a roughly 60-year periodicity which, in turn, influences the sign of SA/GCR effects on
troposphere pressure. Indeed, the reversals of the correlations between sea-level pressure at high latitudes
and sunspot numbers occurred in the 1890s, the early 1920s, 1950s and the early 1980s and coincided well
with the changes in the evolution of the C-type meridional circulation. Hence, the aim of this work is to
study what processes may influence the evolution of the large-scale circulation and, then, the character of
SA/GCR effects on troposphere pressure.
http://geo.phys.spbu.ru/materials_of_a_conference_2012/STP2012/Veretenenko_%20et_all_Geocosmos2012proceedings.pdf
1980 plus 30 is the 2010.
http://woodfortrees.org/graph/esrl-amo/from:1850
Ren
Thanks for the link.
http://oi57.tinypic.com/2n07b42.jpg
Let’s see a sharp decline AO in 2010..
Annual Arctic Oscillation (AO) index values since 1950. Pressure variability for the winter is larger than the annual variability. Following peak values 1988-1093, the AO index have since decreased to values near zero or below. AO data can be downloaded from the NOAA Climate Prediction Center by clicking here. Last update: 7 June 2014.
http://www.climate4you.com/images/AOsince1950.gif
MAVukcevic, the Sun absolutely varied enough to cause the AMO history you depict. Looking at the minimums and where they are in time wrt solar activity, ~1910 and ~1975, both occurred when solar was low, with the recent AMO maximum coinciding well with the Sun’s modern maximum from 1936 to 2003.
Solar energy accumulates in the oceans when solar flux is above ~120 sfu, and dissipates below that level.
A complete solar theory must include heat accumulation at depths in the oceans that takes time to make it’s way to the surface. Thus, SSTs are a function of today’s solar output, previous solar output, and circulation.
Nonsense, solar forcing of the NAO/AO was very strong through the mid 1970’s when the AMO was at its coldest, and has declined since the mid 1990’s with the AMO warming, because weaker solar wind increases negative NAO/AO:
http://snag.gy/fjGhc.jpg
North Atlantic SST can be linked (indirectly) to the solar 22 year cycles in two ways
They are described HERE and HERE .
I am not sure that the TSI could do it alone, unless available data is wrong.
Ulric, the only nonsense here is that you missed the point.
I didn’t mention the NAO or AO. I specifically referred to the AMO only.
In 1975, after SC20 was over, during which time the solar flux averaged 113 sfu/day, the cumulative effect of the lower solar activity from the end of SC19 onward, to that point in time, was the reason temps were at a low point then, after which they responded to higher solar activity levels in SC21, 22 & 23.
I was talking about solar flux, which you know is not the solar wind. You are comparing apples to oranges.
Now, that said, you would be well served to explain your mechanism as to how the solar wind affects the NAO/AO.
Perhaps you could show your enlightenment by describing the relationship(s) between AMO and NAO/AO.
Bob, the reason that the global mean surface temperature dropped 1970-76 was the collective negative feedbacks of a cold AMO, increased La Nina, and the associated increase in rainfall across continental interiors.
….which were the Earth’s natural cooling responses to lower solar flux for SC20….
Bob said “….which were the Earth’s natural cooling responses to lower solar flux for SC20….”
La Nina and a cold AMO act as amplified negative feedbacks to increased solar forcing. Global mean surface temperature changes are not directly proportional to forcings, but move inversely to forcings at up to interdecadal scales. I do not recommend that you follow what Piers Corbyn says on this. His forecast for less El Nino through the next 20 years, shows that he doesn’t know the first thing about the direct association of increased negative NAO/AO with increased El Nino, and a warmer AMO.
vukcevic, did you compare AMO with NH SST or global SST?
No, for what I think might be reasonable ‘reason’:
North Pacific in long term appears to be neutral ( east – west: oscillating between warm-cool and cool-warm),
I don’t think that the global SST data is good enough.
It’s hard to believe these guys are serious. Highly damped ice core data vs thermometers!?
Do these “Scientists” realize that when you “average” numbers, data, etc, over a period of time that the resulting graph is shifted by the process of averaging? The smother the graph, the more it is shifted or delayed.
We don’t even understand how human CO2 emissions contribute to total CO2 in the atmosphere. Until we understand this, it is futile to try and predict what effect human CO2 emissions have on temperature.
Globally, I would suggest that effect is ZERO. However, land use changes such as deforrestation etc, I would suggest local climate may be effected by human activities and there is evidence to support that. But CO2 (~3% of ~400ppm/v)? Nah!
likelyhood should be evaluated by correlation between cause and effect. A mere time series analysis of one parameter, temperature, cannot explain anything other that … it varies.
And searching for correlation is not successful. Anything that shows a rising pattern over the observation period may correlate with temperature: sea level, CO2, magnetic field declination. One has to look at Rates of Changes (derivatives) to see that such correlations are terribly bad.
See this paper: https://hal.archives-ouvertes.fr/hal-01146608