Guest post by Tom Fuller
The physics behind the theory of global warming are solid. CO2 is a greenhouse gas, we’re emitting industrial levels of it, with China now in the lead for emissions. A significant portion remains in the atmosphere for a fairly long time, though the residence time is widely disputed. This residence of CO2 retards the cooling of the Earth and temperatures warm as a result.
One of the few non-controversial datasets in climate change is the Keeling curve, the graph of the concentrations of CO2 in the atmosphere reproduced here:

We see concentrations rising steadily from 315 parts per million in 1960 to 395 ppm last year. It’s close to 400 ppm now.
Human emissions of CO2 caused by burning of fossil fuels and production of cement have risen similarly:

Emissions have climbed at an even higher rate than concentrations.
And the third data source to look at (for simplicity’s sake–we could actually look at dozens of data sources) is temperature changes. This chart shows the global average temperature change from a ‘normal’ 30-year range from 1950-1980. It comes from the Goddard Institute for Space Studies, led by scientist James Hansen.
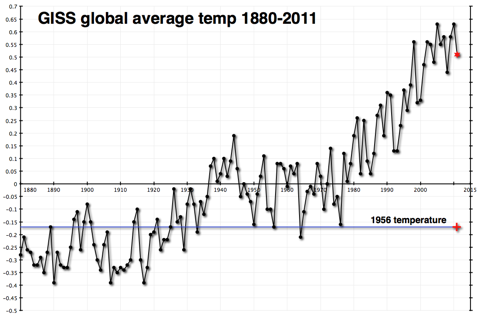
This shows a fairly constant rise in temperatures since 1978.
Once again, you don’t have to be a climate scientist to think that there seems to be a connection. The physical theory published first by Svante Arrhenius over 100 years ago and elaborated on by a century’s worth of scientists has observational evidence that tends to confirm it. I certainly believe in it.
In fact, I believe that global temperatures will probably rise by about 2 degrees Celsius over the course of this century. The difference in estimated temperature rises from different sources almost always comes from the differences in estimated atmospheric sensitivity to concentrations of CO2 in the atmosphere. Having extra CO2 in the atmosphere warms the atmosphere, which is presumed to produce more water vapor, which is also a greenhouse gas and would contribute more warming than the CO2 by itself. How much extra warming would ensue is pretty much the heart and soul of the debate over global warming.
Those who think that there isn’t much of an additional effect (that sensitivity of the atmosphere is low) have been chuckling very publicly because temperatures haven’t risen very much (if at all) since the big El Nino year of 1998. This is not hugely surprising, as the shape of the data is uneven, a sawtooth with ups and downs that can last a decade or longer. But it is happening at an inconvenient time politically for those who are worried that sensitivity is high. They are trying to get the world to prepare for warming of 4.5C or higher, without much success.
Here’s what temperatures look like more recently.

By itself, this chart doesn’t explain very much. As I said, it is not uncommon or unexpected for the temperature record to have flat or declining periods that last a decade or more.
However, I have a problem. The Carbon Dioxide Information Analysis Center (CDIAC) has estimates of how much CO2 humans have emitted since 1750. (Confusingly, they convert the CO2 to tons of carbon with a fixed formula.) That chart is the first one way up there at the top of the post. It rises dramatically
But looking at the data global.1751_2009 (3), one thing jumps out at me. CDIAC writes “Since 1751 approximately 356 billion metric tonnes of carbon have been released to the atmosphere from the consumption of fossil fuels and cement production.” And they helpfully provide an Excel spreadsheet showing their estimates by year.
And almost one-third of that number, 110 billion metric tonnes, have occurred since that time in 1998 when temperatures reached their temporary plateau.
| 1998 | 6644 |
| 1999 | 6611 |
| 2000 | 6766 |
| 2001 | 6929 |
| 2002 | 6998 |
| 2003 | 7421 |
| 2004 | 7812 |
| 2005 | 8106 |
| 2006 | 8372 |
| 2007 | 8572 |
| 2008 | 8769 |
| 2009 | 8738 |
Above: Table1, CO2 emissions by years, million metric tonnes – data CDIAC
Because heat moves somewhat sluggishly through the earth’s oceans, and because there is a lag factor in other earth systems, we do not expect a hair-trigger reaction to increases in CO2 emissions and concentrations.
But one-third of all human emissions of CO2 have occurred since 1998. And temperatures haven’t budged as a result.
This does not ‘disprove’ global warming–at all. I still believe that temperatures will climb this century, mostly as a result of the brute force effect of the 3,000 quads of energy we will burn every year starting in 2075–the reason I started this weblog.
However it makes it exceedingly difficult to use the past 15 years as evidence of a very high sensitivity of the atmosphere to CO2 concentrations. And it makes me feel more comfortable about my ‘lukewarm’ estimate of 2C temperature rises as opposed to the more alarming 4.5C rises put forward by some of those who are most active in the movement to reduce emissions drastically.
And it makes me wonder about why people don’t include relevant data when they discuss these issues. Is it really that politically incorrect to show real data, even if that data doesn’t advance your case?
Tom Fuller blogs at: 3000Quads and is co-author with Steve Mosher of the CRUTape Letters.
A plot of HadCruT4 temperature anomalies vs atmospheric CO2 concentration is shown here
http://i1244.photobucket.com/albums/gg580/stanrobertson/Temp-CO2-1850-2012-v2.jpg
The CO2 data prior to 1960 was entered as annual amounts with a weight of 12x rather than the monthly amounts reported later at Mauna Loa. The least squares best fit line says that we are getting 1.9C per CO2 doubling. At the current rate of increase of CO2 of 0.5% / yr, that will take 140 years. Since temperature increase is proportional to the log of CO2 concentration, it will increase linearly with time and yield only 1.36 C over the next century. This shows what the earth is doing now in a completely model independent way.
But if the temperature arrest continues for another decade or two, the line would become less plausible and it would strongly suggest that something other than CO2 is driving the earth’s climate.
Note that the CO2 axis on my plot is logarithmic!
Thanks for the statement of your belief in AGW, in spite of the strong evidence you cite to the contrary. Very faithful of you.
Existence of greater moisture in the atmosphere as a result of warming has, apparently not occurred, according to recent surveys. And this implicit claim that adding carbon (regardless of concentration levels) must always either result in positive feedback, or little feedback is also not proven,although this article assumes otherwise. Looking at a simplified system, where only CO2
increases is useless when dealing with a very non-simple system like the climate. Nor is the claim that emissions will continue and increase as far into the future as is claimed I consider preposterous, regardless of whether people stay concerned or not- technology practically at our fingertips (electric cars, Generation 4 fast reactors, China’s aggressive hydro and nuclear programs, etc.) make certain that natural progression of technologies will radically reduce carbon emissions, which, in my view, makes current concerns about the distant future a non-issue.
I think perhaps that may be the most unrealistic portion of concerns about future carbon levels – they assume highly unlikely future energy world and a virtually static technology. Electric cars, for example have (assuming cheap and practical batteries) a distinct economic advantage over gas powered vehicles, which they will replace, irregardless of public concerns about carbon emissions.
Much the same can be said about nuclear power. And that, gentlemen, is be the ball game.
Forget about CO2 – – it’s largely irrelevant.
Recall the parallel sawtooth-shaped patterns of T and CO2 vs time from various polar ice-core datasets.
First, temperature always changes direction before CO2 follows (hence, cause/effect)
Second, T always begins to decline when CO2 is at its greatest concentration; and T always begins to rise when CO2 is at its lowest concentration.
So CO2 is always a trailing indicator unless we’re talking plant physiology and growth rates. That’s where CO2 rules.
CO2 is only an issue because lefties see it as a path to tax every human activity in the world.
@arthur4563: you wrote: “Electric cars, for example have (assuming cheap and practical batteries) a distinct economic advantage over gas powered vehicles, which they will replace,… ”
I don’t see how electric cars have a distinct economic advantage. Could you tell me what they are?
lower cost? less weight? longer range? faster refuel rate? I think the answer is no to these questions, but perhaps I don’t know what to ask.
You use GISS data? GISS?? Really? And with a straight face?….
Golly…
“The physics behind the theory of global warming are solid.”
” CO2 is a greenhouse gas,…”
With two such spectacularly wrong statements to start with, the rest of the analysis is built on very soft sand.
The author also asks the following question;
“Is it really that politically incorrect to show real data, even if that data doesn’t advance your case?”
Anyone who does not think that the answer is “YES” has not being paying attention.
Looks to me like the next third runs from about 1972 t0 1997, so 2/3 since just 1972. We should have fried by now if the active hypothesis were true.
If you hold up three fingers and say that represents the nominal 280 PPM pre-industrial CO2. Then hold up four fingers and say that represents the current level, near 396 PPM. As each finger represents enough CO2 to completely block the 15 micron, 666 cycles per cm CO2 absorption band, turn your hand sideways, as in a salute, to see the real difference between three and four fingers of CO2.
The net effect of the CO2 absorption band is like a one foot diameter tree in in the middle of a ten-foot wide stream. Adding more CO2 just lowers the altitude of total absorption.
Below is a Wikipedia graphic that shows the miniscule difference between 300 PPM (green) and 600 PPM (blue) as calculated by MODTRAN, a program developed by the Air Force to calibrate their equipment.
MODTRAN Radiative Forcing; Double CO2
MODTRAN3 v1.3 upward irradiance at 20 km [up], U.S. Standard Atmosphere
http://en.wikipedia.org/wiki/File:ModtranRadiativeForcingDoubleCO2.png
Tom, kudos for your presentation: courageous in a sceptic blog. And Anthony, balance is good, nay, necessary. Tom, I do have a bit of trouble with your use of the term ‘belief’. This has always been a notable feature of the [luke]warm to warm side of the climate change argument. (I use ‘climate change argument’ to stress that it’s the CAUSE of the climate change that is in question, not whether climate change ‘exists’ and is ‘real’)
What is your belief founded on? You “believe” that temperatures will rise 2 degrees by century’s end. Please elaborate, even if a generalization is all you have time for. Your ‘brute force’ remark is much like the general view that “we MUST be having an effect” (a view rarely if ever backed by why someone would assert it). Your ‘estimate’ of 2 degrees must have a foundation?
I will agree, however, that yes, cherry-picking is all too prevalent, as is the convenient erasure of historical accounts by laypeople (the weren’t ‘scientists’…appeal to authority). To many inconvenient truths tend to skewer the case. However, your presentation seems to leave the question just as open at the end as it was at the beginning; far from the consensus certainty that is the hallmark of the greenhouse-driven climate change paradigm.
MODTRAN Radiative Forcing; Double CO2
MODTRAN3 v1.3 upward irradiance at 20 km [up], U.S. Standard Atmosphere
http://en.wikipedia.org/wiki/File:ModtranRadiativeForcingDoubleCO2.png
Yes, notice the difference in Watts.
Now quickly what was the difference in watts from the sun between the LIA and today?
Another hint. How many excess Watts does it take to melt greenland?
How many excess watts to melt all the artic ice?
The second Figure (emissions trend) is too old; the right-hand end being 2000, where the emissions from developed nations tended to plateau but those from developing nations (esp. China) began to skyrocket.
IIRC, from 1990 (start year of Kyoto) to 2012 the global CO2 puff has increased by ca. 60% while the Mauna Loa CO2 concentration has increased by merely 10% or so.
This fact alone may be enough to cast a big doubt on AGW, let alone on CAGW.
As an engineer, I would think one would pause to rethink a hypothisis when the response is flat for fifteen years while the level of the stimulus is dramatically increased. An open minded engineer or scientist not married to his/her theories would look elsewhere for a valid relationship.
Maybe there is something wrong with the “physics” after all.
How many thermometers were there in the Southern Hemisphere in 1880 to calculate the global average temperature of the Earth for that year?
3.39 W/M^2 is the total difference and water can change it rapidly blocking 600-1000 W/M^2..
I would dare say the the minor flux in solar output is not the issue. Now the magnetic waves are a much different issue and they influence water vapor with great ease as they bend and fold the atmosphere..
Dear steven mosher, your argument is assuming that there is no other way heat can escape than through radiation in the blocked band. There is, both in other radiative bands and through latent heat, convection etc.
Also, you ask us what the difference in watts between lia and today is. We have no clue and neither do you. We didn’t meassure radiation at the toa at the time.
Best,
Rikard
“This does not ‘disprove’ global warming–at all. I still believe that temperatures will climb this century, mostly as a result of the brute force effect of the 3,000 quads of energy we will burn every year starting in 2075–the reason I started this weblog.”
Now I didn’t run any numbers but consider this. If humanity releases “3,000 quads of energy every year” than that is a constant. Heat is transported away from the surface via convection, conduction and radiation and radiated away to space in the stratosphere mostly. A heat engine.
If we offset the system by adding a constant amount of energy per time it will only shift the temperature at the surface by a constant amount, making the heat engine slightly more efficient. A new equilibrium is reached.
Will humanity multiply exponentially, thus increasing the amount of energy added per year exponentially? Unlikely. As people get more wealthy birth rates drop.
( http://www.gapminder.org )
Will humanity , while growing in number sub exponentially (therefore negligibly), grow energy use per person exponentially? Again, unlikely. Electricity use per person in Germany, for instance, has been stagnant since the 1970ies. We are deriving more value from each unit, though – more efficient fridges, computers, TVs etc. (if one can call TV a value)
Steven Mosher says:
December 6, 2012 at 9:00 pm
“MODTRAN Radiative Forcing; Double CO2
MODTRAN3 v1.3 upward irradiance at 20 km [up], U.S. Standard Atmosphere”
Steven, is there any observational evidence that the real atmosphere behaves similar?
I’m asking because it should be measurable.
Simple answer Tom, YES.
Deception in the name of THE CAUSE, is desirable and necessary.
At least thats my default since reading the CRU emails and Climate Audit.
The recent blame every storm on CC has done nothing to enhance the credibility of believers.
I value honest opinions but will check the data myself to the best of my ability.
Oh Tom I haven’t checked your blog in a while, what was your take on the orchestrated propaganda carried out by the BBC? 28 -30 not so unbiased experts.
Tom Fuller;
This residence of CO2 retards the cooling of the Earth and temperatures warm as a result.
>>>>>>>>>>>>>>>>>
This is wrong. The temperature of the Earth SURFACE is in theory warmed. By saying simply “the Earth” you are including the atmosphere. The average temperature at equilibrium of the system as a whole (surface+atmosphere) doesn’t change at all due to a doubling of CO2.
Mario Lento says:
December 6, 2012 at 8:27 pm
“@arthur4563: you wrote: “Electric cars, for example have (assuming cheap and practical batteries) a distinct economic advantage over gas powered vehicles, which they will replace,… ”
I don’t see how electric cars have a distinct economic advantage. Could you tell me what they are?
lower cost? less weight? longer range? faster refuel rate? I think the answer is no to these questions, but perhaps I don’t know what to ask.”
A typical smallish electric car costs 25 k EUR – 15k for the car and 10 k for the battery. The battery delivers a range upwards of 100 km and is typically designed to last for 100,000 km or about 1,000 charge cycles.
So you pay 10,000 EUR for 100,000 km or 10 Eurocent per km (13 US cent per km) for the battery alone BEFORE you pay for the electricity. (Which is at German prices and let’s say 7 kWh per 100km about 1.75 EUR – BUT you already paid 10 EUR for the battery depreciation over the same distance…)
IFF batteries were 10 times less expensive one could talk – because in that case the value of a battery would be negligible. But it’s not the case. And no “Moore’s Law” for batteries.
Steven Mosher;
How many excess watts to melt all the artic ice?
>>>>>>>>>>>>>>>
May I refer you to arctic circle temps?
http://ocean.dmi.dk/arctic/meant80n.uk.php
If you’ll note, there are on average less than 100 days per year in which temps are high enough to melt ice. There are approximately 200 days per year when temps are -30C or colder. So the answer is a LOT more than a few. In fact, you can go back to the early 60’s, and you’ll find that temps were a lot lower over the course of the year, but the number of melting days was NOT less. SB Law requires that there be more warming in the winter than in the summer, and once you factor that in, the number gets even bigger. Sorry, no boost from water vapour at that latitude either, cold = dry.
A better question might be how many watts will it take to reverse the increase of ice in the Antarctic?
“And it makes me wonder about why people don’t include relevant data when they discuss these issues. Is it really that politically incorrect to show real data, even if that data doesn’t advance your case?” Absolutely. Those most strident on both sides of the question are not interested in real empirical data. They are only interested in model results, not data at all, which advance their cause not matter what that cause may be. This people have turned the question into a religious quest for power the furtherance of the theology.
RE: Steven Mosher says: (December 6, 2012 at 9:00 pm)
“MODTRAN Radiative Forcing; Double CO2
MODTRAN3 v1.3 upward irradiance at 20 km [up], U.S. Standard Atmosphere
. . .
“Yes, notice the difference in Watts.”
Based on the MODTRAN radiation code, web tool hosted by the University of Chicago, it appears that the radiant energy outflow reduction caused by each *complete doubling* of the CO2 concentration in the atmosphere can be compensated by a surface temperature increase on the order of one degree C. This relationship seems to hold from 20 PPM to well over 1000 PPM CO2. This program calculates the raw effect of adding CO2 to the atmosphere without regard to any complex and controversial climatic feedback effects.
The dangerously high positive feedback levels originally estimated by the IPCC seem far-fetched and unsupported by current data.
David Archibald, in his article, The Fate of All Carbon says, according to current estimates, there may not be enough economically recoverable, combustible carbon left in the ground to ever reach one full doubling of the CO2 content in the atmosphere. (560 PPM)
http://wattsupwiththat.com/2011/11/13/the-fate-of-all-carbon/