Old Radar Sites In Greenland Show Icecap Growth Over the Years
(And let’s not forget what we’ve learned about the temperature reporting from the DEW line Radar Stations – Anthony)
By Joseph D’Aleo, CCM, AMS Fellow
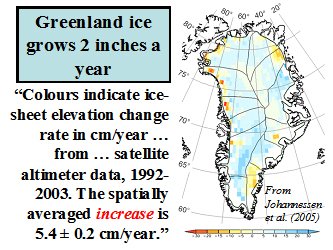
Though the ice may be melting around the edges of the Greenland Icecap in recent years during the warm mode of the AMO much as it did during the last warm phase in the 1930s to 1950s, snow and ice levels continue to rise in most of the interior. Johannessen in 2005 estimated an annual net increase of ice by 2 inches a year.

(Above: Recent Ice-Sheet Growth in the Interior of Greenland, Ola M. Johannessen, Kirill Khvorostovsky, Martin W. Miles, Leonid P. Bobylev, Science Express on 20 October 2005 Science 11 November 2005: Vol. 310. no. 5750, pp. 1013 � 1016, DOI: 10.1126/science.1115356)
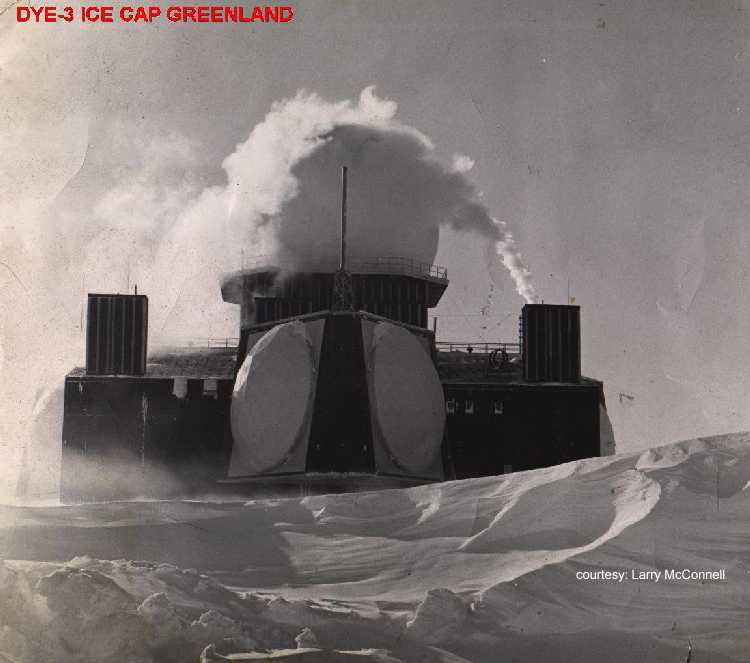
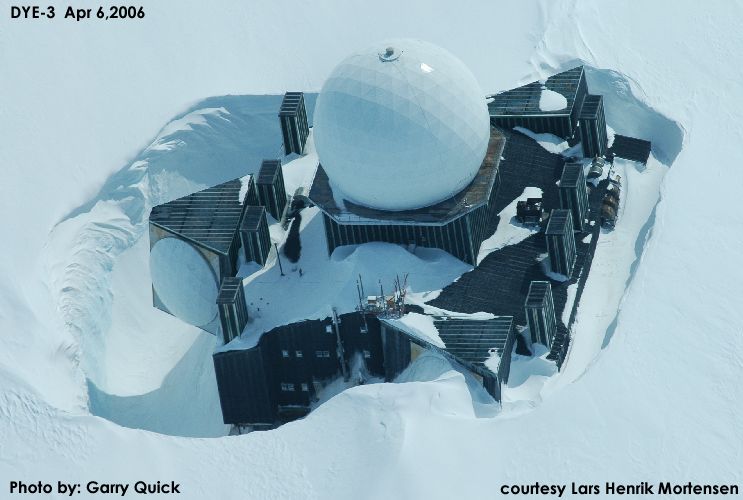
A Canadian Icecap emailer noted during the cold war there were two massive radar sites built on the Greenland icecap now abandoned. They are called Dye-2 and Dye-3. When built they sat high above the snow, recent pictures show how the snow is building up around them, proving the snow build-up in recent times. This demonstrates this snow accumulation over time.
Dye-2 and 3 were among 58 Distance Early Warning Line radar stations built by America between 1955-1960 across Alaska, Canada, Greenland and Iceland at a cost of billions of dollars. Their powerful radars monitored the skies constantly in case Russia decided to send bombers towards America. After extensive studies in late 1957, the USAF selected sites for two radar stations on the ice cap in southern Greenland. Dye-2 was to be built approximately 100 miles east of Sondrestrom AB and 90 miles south of the Arctic Circle at an altitude of 7, 600 feet, and Dye-3 was to be located approximately 100 miles east of DYE II and slightly south at an elevation of 8,600 feet.
The selected locations for the new radar sites were found to receive from three to four feet of snow fall each year. Since the winds were constantly blowing with speeds as much as 100 mph, this snow accumulation constantly formed large drifts. To overcome this potential problem, it was decided that the Dye sites should be elevated approximately twenty feet above the surface of the ice cap.
Dye 3 was built in 1960. From a distance the structure, with its onion-shaped dome, looks like a Russian orthodox church. Dye 3 was an ice core site and previously part of the DEW line in Greenland. (The Distant Early Warning (DEW) Line: A Bibliography and Documentary Resource List Arctic Institute of North America, Page 23). As a Distant Early Warning line base, it was disbanded in years 1990/1991. The Dye 3 cores were part of the GISP (Greenland Ice Sheet Project initiated in 1971) and, at 2037 meters, was the deepest of the 20 ice cores recovered from the Greenland ice sheet as part of GISP. Samples from the base of the 2km deep Dye 3 and the 3km deep GRIP cores revealed that high-altitude southern Greenland has been inhabited by a diverse array of conifer trees and insects within the past million years. (Eske Willerslev, et al. (2007) Ancient Biomolecules from Deep Ice Cores Reveal a Forested Southern Greenland Science 317 111-114)
The first image below is from 1972.

See larger image here.
Here it is in 2006.

See larger image here.
In looking back at the time the sites were abandoned, one console operator lamented “We were very busy during this time and I was sad to see it end. I remember thinking of all the waste,” he said. The site is slowly disappearing into the snow. Its outbuildings are no longer visible and drifting snow will consume it completely one day, but that day appears to be decades away.” Read more here.
posted on solar 24
“Solar activity continues at very low levels and the sun remains blank of sunspots. We are going through what has been a much longer than expected solar minimum.”
As every month passes… looks more and more like David Archibald’s prediction’ are coming to fruition LOL
Altimeter measurements are not definitive. They do not measure the mass of the ice. They measure its altitude, but can’t determine the density.
http://www.sciencedaily.com/releases/2007/03/070327122328.htm
“…Just a few years ago, the world’s climate scientists predicted that Greenland wouldn’t have much impact at all on sea level in the coming decades. But recent measurements show that Greenland’s ice cap is melting much faster than expected.
These new data come from the NASA/German Aerospace Center’s Gravity Recovery and Climate Experiment (Grace). Launched in March 2002, the twin Grace satellites circle the globe using gravity to map changes in Earth’s mass 500 kilometers (310 miles) below. They are providing a unique way to monitor and understand Earth’s great ice sheets and glaciers.
Grace measurements have revealed that in just four years, from 2002 to 2006, Greenland lost between 150 and 250 cubic kilometers (36 to 60 cubic miles) of ice per year. One cubic kilometer is equal to about 264 billion gallons of water. That’s enough melting ice to account for an increase in global sea level of as much as 0.5 millimeters (0.019 inches) per year, according to Isabella Velicogna and John Wahr of the University of Colorado, Boulder. They published their results in the scientific journal Nature last fall. Since global sea level has risen an average of three millimeters (0.1 inch) per year since 1993, Greenland’s rapidly increasing contribution can’t be overlooked. ..”
Sea level hasn’t risen for three years. If Greenland and Antarctica were melting, there would have to be an associated rise in sea level.
http://sealevel.colorado.edu/current/sl_noib_global_sm.jpg
Curious that the “world’s greatest climatologist” seems to have a different opinion, seemingly defying the laws of conservation of mass.
http://www.physics.utoronto.ca/news_repository/will-oceans-surge-59-centimetres-this-century-or-25-metres
a study led by James Hansen, the head of the climate science program at the National Aeronautics and Space Administration’s Goddard Institute for Space Studies in New York and a professor at Columbia University, suggests that current estimates for how high the seas could rise are way off the mark – and that in the next 100 years melting ice could sink cities in the United States to Bangladesh.
“That’s enough melting ice to account for an increase in global sea level of as much as 0.5 millimeters (0.019 inches) per year”
Eric,
At that rate, it will only take 2,000 years for sea level to rise another meter, on top of the 100 meters it has risen during the last 15,000 years. One meter is less than the difference between high and low tide on most beaches.
in the first photo, who is that guy in mukluks mooning us?
I think the truth is they are still calibrating Grace.
http://www.sciencedaily.com/releases/2008/12/081215091013.htm
Some ice melts, the bedrock rises. More ice acculumlates, the bedrock sinks and they have to guess what it all means.
I remember reading the Club of Rome reports. Rather scary at the time, but today we can see the fallacy of extending trends.
At least the Club of Rome had the good sense to use real trends. Hansen is using imaginary trends from computer models to make his predictions.
If Greenland is melting, why aren’t these old DEW line installations high and dry?
Why is it World War II planes left there 60 years ago are hundreds of feet down in the ice?
And these people are worrying about 2% of an inch rise in ocean levels per year?
Sometime in the future, and I don’t think it will be decades, people will simply laugh at this silliness.
The 1972 picture shows the snow already engulfing this building – it was originally built on stilts.
This very nice photo from ’67 shows the original construction…
http://www.firebirds.org/menu10/mn10_p29.htm
I do not know if these sites were built directly on the ice, but if so the structures will slowly sink into the ice, just by their weight. (ref the South Pole Station’s building history)
It also shows the local effect of albedo, if it is not sinking in the ice by its weight as somebody offered.
I would think though that building on stilts, which is usual in areas where there is no solid ground, makes it stable enough. Other wise, if it were sinking, it would have tilted, since certainly the weight is not equally distributed.
Why is it World War II planes left there 60 years ago are hundreds of feet down in the ice?
———————
Well, aside from the obvious snow, a bit of gravity maybe too ?? Which brings me to a similar layperson’s question:
I’ve lived in the East San Francisco Bay now for 30 years. For those who know it, I drive or walk the frontage road along the Bay between Emeryville and Berkeley frequently. As a photographer of wading birds, I have observed the mudflats many times at high tide, low tide and tides in-between. Now, although eyeballing may indeed be more accurate than getting your data from Hansen, I’m still wondering why the San Francisco Bay water level, by 30 years of eyeballing, looks like it’s lower. Is it:
a) because it is lower ?
b) because the seismic activity in the region is lifting the land mass ?
c) dredging of the mud has decreased ?
d) because Mr. Pauchuri thinks that I also believe that the earth is flat ?
e) through z) of other reasons ?
Anyone know ??
http://www.p38assn.org/glacier-girl.htm
WWII Bombers under ’25 stories’ of ice in Greenland… I’d guess that at 3 to 4 feet per year, more or less.
Gee, ice & snow accumulating in the interior and flowing to the edges where it melts near all the (relatively) warm water. Sounds like a normal glacier to me…
I think it was the History Channel had a film of the recovery and restoration of one of the P38 bombers. Amazing.
Does the ice pack on Greenland grow. One measurement over a long period of the 20th century, when “global warming” was supposed to be rampant, was measured with the aid of a Lockheed P-38 Lightning fighter aircraft.
A couple of B-17s and a gaggle of Lightning fighters were being ferried to England in 1942. They ran into heavy weather and had to put down on the ice in Greenland.
The crews were rescued; but it was concluded there was no reasonable way to get the aircraft off the ice again; so they were abandoned.
Many years later; around 2002 as I recall, the aircraft were discovered entombed in the ice (60 years after abandonment). Some of the planes got crushed by the ice on top of them, but at least one P-38 was considered to be sufficiently intact to be recoverable.
They dug down into the ice and removed the ice from around the plane nleaving a space, that enabled the plane to be taken apart and hauled to the surface. The plane was fully restored to flying condition, and a few years ago it took to the air somewhere ion Texas as I recall, after being entombed in the ice for 60 years.
Oh I forgot to mention; the P-38 was buried 262 feet under the ice, when it was discovered and salvaged.
And yes I am recounting this from memory; so all you doubters can google it up for yourself and correct my mistakes.
It is reasonable to conclude that the long term growth rate of Greenland ice in that part of the island is about 4.37 feet per year, so by the time we get that 10 deg C global warming rise in 100 years or so, and the oceans have risen 200 feet, the rest of those planes will be safely buried under about 550 to 600 feet of ice.
Jack Simmons (21:06:25) :
I remember reading the Club of Rome reports. Rather scary at the time, but today we can see the fallacy of extending trends.
Some of us can see the fallacy, others… Required reading in the Economics of Ecology class I took in the ’70s was “The Limits to Growth” by Medows et. al. (i.e. the Club of Rome stuff). The professor was very very good. Mr. Gustafson, I think it was. We had to read “Limits” for 2 or 3 weeks and he let us get up a good head of panic steam… then pulled the rug out.
We were then given a bibliography of the hundreds of works that had destroyed “Limits” and told to pick some percentage of them and report on them. We all felt suckered after reading the critiques… There is nothing like feeling “had” to turn you from the Dark Side 😉 In one swoop he created an entire classroom of new skeptics…
At least the Club of Rome had the good sense to use real trends. Hansen is using imaginary trends from computer models to make his predictions.
Um, I don’t think so. What “Limits” did was computer projections. The only major difference I can see between “Limits” and Hansen is that the models in “Limits” were far simpler (and still wrong). There was an attempt to say that they had not made predictions, only ‘projections’. More hog wash. When the book says ~”We are going to run out of natural gas in 10 years” that’s a prediction even if you wrap it in a disclaimer of ‘if all trends continue’.
The astute reader will notice that 40 years later we have record supplies of natural gas… “Limits” suffered from 2 major flaws (and many minor ones).
The most basic was taking resources as fixed amounts and applying exponential consumption models. Resources are not fixed, they are price dependent, and consumption models are not exponential, they are “S” shaped with price. They also applied exponentials to other things, like population growth, that are also “S” shaped rather then exponential. Their model was broken, rather like Hansen’s model.
The other major flaw was not allowing for resource substitution. Just how many vacuum tubes would it take to run your iPod? Oh, guess we don’t need all that much glass, energy, and metal after all since we’ve moved on from vacuum tubes… I now use a plastic bucket in the yard. When I was a kid it was galvanized steel. etc.
Sometime in the future, and I don’t think it will be decades, people will simply laugh at this silliness.
Yup. It will be added to “Y2k” and the “Tech Bubble” in the modern equivalent of “Memoirs of Extraordinary Popular Delusions and the Madness of Crowds” (a Must Read, BTW…)
[Wow. Good to see someone who knows how resource dynamics wok and how the Club of Rome screwed up. ~ Evan]
Patrick H – D’ya suppose the ice will melt more or less rapidly as temperatures rise?
This recent report on Abrupt Climate change
http://downloads.climatescience.gov/sap/sap3-4/sap3-4-final-report-ch2.pdf
estimated that each 1C rise in temperature adds about 300 Gt per year of ice mass balance loss (but with error bars of 133 Gt). A quick back-of-the-envelope territory sum and
1 cubic kilometre ice = approx 0.92 Gt
1 cubic kilomtere = 0.239 cubic miles
So each additional 1C adds about another 78 cubic miles / year to the rate of melt. An increase of 4C over todays’s temperatures would give a SLR of 0.17 inches/year, a crudely averaged linear increase of 3C between now and 2100 would result in a SLR from meltwater alone of about 12 inches, but with an uncertainty of about +-5 inches.
But the majority of projected SLR (about 70-75% according to the IPCC WG1 Technical Summary) is actually due to thermal expansion rather than meltwater. So a 1 to 1.5m SLR by 2100 is surely at the top end of the range, requiring a worst case temperature rise but it is not totally implausible. If the ice sheet disintegration proves to be non-linear, as Hansen speculates, and some recent observations seem to indicate, then multi-metre rises are a distinct possibility.
While snow added 60 cubic kilometers (14 cubic miles) of ice mass to Greenland’s interior each year between 2003 and 2005, the low-lying coast areas of Greenland lost nearly three times as much ice – 172 cubic kilometers (41 cubic miles) – each year during the same period.
This is the signature you would expect from a warming climate. Increased ice in the interior due to increased precipitation. Decreased ice at the margins due to melt.
I can’t say how valid/accurate the gravimetric measurements are, but I am suspicious of satellite data that is truncated and doesn’t show up to the present. I checked the GRACE website and there hasn’t been any more data published I could see (much of its in German). So all we have is 3 years of data for the Greenland ice melting much faster than thought claim.
If this was the serious problem claimed you’d think publishing the data would be a priority. Unless of course the newer data doesn’t show rapid accelerating ice melt.
Here’s how they built them
http://www.lswilson.ca/dye2construct.htm
John Philip,
I’ve been watching global warming play out since about 1978, and have seen nothing dramatic happen. I don’t expect to see anything dramatic in the next 30 years. Looking at the history, we should expect another news cycle of global cooling hysteria within the next ten years.
“Only two things are infinite, the Universe and human stupidity – and I am not so sure about the former.”
Albert Einstein
philincalifornia (21:47:44)
Very reasonable questions, Phil, but you wouldn’t believe how hard to answer.
First, some geology/geodesy (I’ll keep it simple, if only so I can understand it!). Far from being a billiard ball, the earth is more like a blob of jelly. It’s (nearly) a sphere because that minimises the sum of the potential energies of all its particles. It’s a flattened sphere because it’s rotating. If you disturb the shape of the earth, e.g. by spinning it faster or piling up a mountain range, it will quite rapidly adjust to the new equilibrium shape.
Now think of the Earth’s surface as flat. Except that it isn’t! Mountains stick up, and ocean basins go deep. The fastest-responding element on the surface is water. Actually that responds rather too fast, as it sloshes about under the influence of lunar, solar and all the other gravitational effects. Still, we can damp that out to get a mean sea level. But, the mountains, etc. are still floating on the rock of the mantle. As tectonic plates move about they pile up into each other and pull apart leaving gaps. In San Francisco you’ll know all about that!
Now 18,000 years ago a goodly part of the Northern hemisphere was covered with a couple of miles of ice. With a density of about .8 tons per cubic metre it was about a third of the density of rock, so it was the equivalent of about 4,000 feet of mountain pressing down, and in 18,000 years it has all gone. So now the rock that was underneath the ice finds itself deeper than it should be and so is forced up by the pressure on the mantle driven by those bits that were not ice-covered but driven up by the weight of the neighboring ice sheets (think rubber sheet on water with weights put on it).
OK so far? That’s isostacy. But it’s not the only thing that’s going on in the Earth’s surface. As Tectonic plates collide some slide down under others, forcing them up above where they “should” be – like the Rockies, Andes and Himalayas. There are also uneven distributions of mass within the Earth which mean that the theoretical surface is not even a flattened sphere. The ocean surface roughly follows the gravitational surface, but currents also distort things.
At the end of all that, what is sea level?
Crudely, anything but level. The geodetic answer is rather more complicated, but at the end of it to claim that sea levels are rising world-wide is highly questionable. Yes, we can measure overall sea levels from satellites, but only for the last 30 years or so. All previous records depend on tide poles at ports, and these were put in with reference to stable land levelling benchmarks. Ultimately, the land levelling benchmarks were put in with reference to sea level derived from years of tidal observatiions. Anyone see the circularity here?
Given that land levels are anthing but stable (the Indonesian earthquake of 2001 saw land level sprang up 5 metres in one go), anyone who tells you that world sea lavels have risen or fallen by x cm in the last century or so is talking b*****ks. The land surface is going up and down like a w’s ds all over the world, so to say that we can measure the level world-wide (as opposed to locally) to that degree of precision is compleat nonsense.
John Philip
Patrick H – D’ya suppose the ice will melt more or less rapidly as temperatures rise?
John Philip – D’ya suppose the ice will melt more or less rapidly as temperatures fall?
Greenland appears to be floating upwards – its landmass is rising up to 4 centimetres each year, scientists reveal.
And the large country’s new-found buoyancy is a symptom of Greenland’s shrinking ice cap, they add.
“The Earth is elastic and if you put a load on top of it, then the surface will move down; if you remove the load, then the surface will start rising again,” explains Shfaqat Khan of the Danish National Space Center in Copenhagen.
In the case of Greenland, the “load” is its ice cap, he says.
Such uplift is not an unknown phenomenon. Relic “raised beaches” are relatively common in some areas, where the loss of ice after the last Ice Age caused the land to rise, leaving beaches often metres above the water.
Khan and his team detected the country’s uplift using measurements from GPS stations located on the bedrock, underneath the ice.
Khan and his colleagues have been monitoring data from these stations since 2001 and have found that the southeastern tip of the country is definitely rising upwards. They have also found that the rate of rise has dramatically accelerated in recent years
http://www.newscientist.com/article/dn12872
Jerry 🙂
Brilliant! Just wish my geology lecturers could have put it all in so simple terms I would have understood it much better!
I have a suspicion that we are in free-fall over climate. We observe a change in something, being simple bead wearing stick waving humans we have to attribute it to the gods being angry at us, so we have to appease them! Why can’t think about these changes & conclude that they are simply things we haven’t noticed before, not that we’ve caused them to happen. It was warmer that today in the Bronze age, ditto in the Roman age – they made wine in Yorkshire for instance, it was warmer again in the MWP when the Vikings settled on Greenland, it warmed & cooled at least 4 times during the past 140 years or so. All these periods correlate better than CO2 levels in the atmosphere with changes in the Sun’s output & Sunspot activity.
The problem is that the Tyndall Centre & the Hadley Centre were all set up to find evidence of Global Warming caused by mankind. After a few years one has to produce results as large budgets are involved, along with salaries, pensions, career advancement, status, etc. The whole thing becomes a whirling mass of self-supporting & justifying for existence rather than pure research & science.
BTW, it’s ruddy cold in the UK right now again, a thick carpet of frost everywhere in the west, thank goodness the wind hasn’t returned! More coal please!
George E.Smith.
A man who knows his stuff! and anyone, who doubts his knowledge has taken leave of his/her senses.
Patrick Henry,
Hansen is blowing hot air again. Ask him to put money down on his bs.
I personally sent another e-mail to WP Juliet Eilperin:
http://www.washingtonpost.com/wp-dyn/content/article/2008/12/24/AR2008122402174.html
Offering to bet $10,000.00 on a sea level rise of 30 mm over the next 5 years (0.6 meters by 2108). (I upped the ante thinking my first offer for $1K was maybe too measly for her).
Not a peep!
Carlo,
if they are so sure, they they’ll put their money where their big mouths are.
But observe how they bolt for the exits when we demand they back up their drivel. And observe how they bolt when Steve McIntyre demands they provide their raw data! They’re all a bunch of charlatans.
True land masses rise when ice loads are removed. Also true land masses rise when adjacent neighbouring land are pressed down by increasing ice loading. The pressed-down land areas simply displace the land areas that are less weighted down, and so upwards.
It could very well be that added ice weights in some areas of Greenland are simply pushing those areas that are not gaining weight upwards. This is the case with Scandanavia, which is still rising because of the removed huge ice mass from the previous Ice Age. Scandanavia’s rising is allowing the northern coastal parts of Germany to sink. This is actually being measured today – 10,000 years after the end of the last Ice Age.