Why You Should No Longer Fear Global Warming – Join Me in Calgary on November 16

For years, we’ve been told that climate change is an existential crisis, that extreme weather is spiraling out of control, and that unless we fundamentally transform our energy systems and way of life, catastrophe awaits.

There’s just one problem with many of these claims: when you look past the headlines and examine the actual data, the picture is considerably less frightening.

That’s the subject of a presentation I’ll be giving in Calgary, Alberta, on November 16, 2026, hosted by the Friends of Science Society.

The title is deliberately straightforward:

“Why You Should No Longer Fear Global Warming aka ‘Climate Change'”

And yes, I’ll be bringing the receipts.

What the Data Actually Shows

I’ve spent decades working in meteorology, studying weather and climate records, examining temperature measurement problems, and questioning claims that seem to get more dramatic with every new round of media coverage.

One thing I’ve learned is that there’s often a considerable difference between what the public is told about climate change and what the underlying scientific records actually demonstrate.

We hear that hurricanes are becoming increasingly destructive because of climate change. But what do the long-term records of hurricane frequency and intensity actually show?

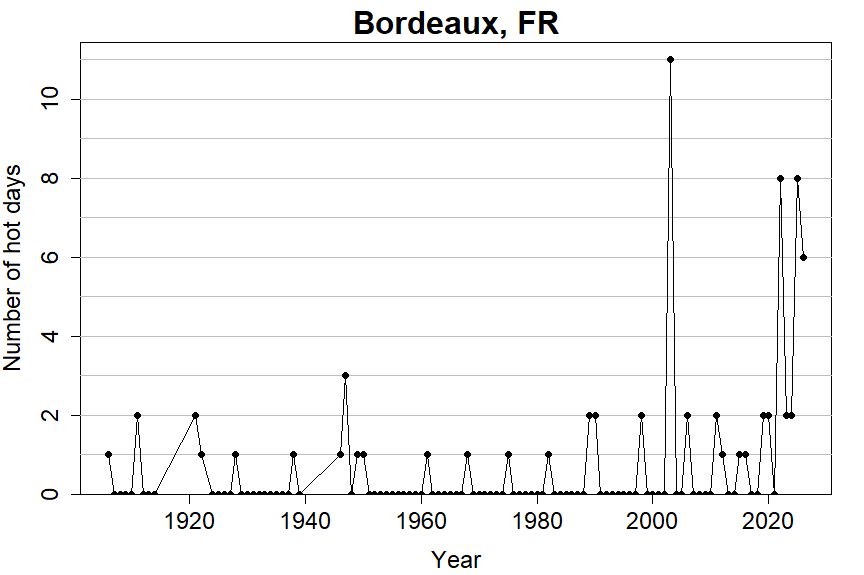
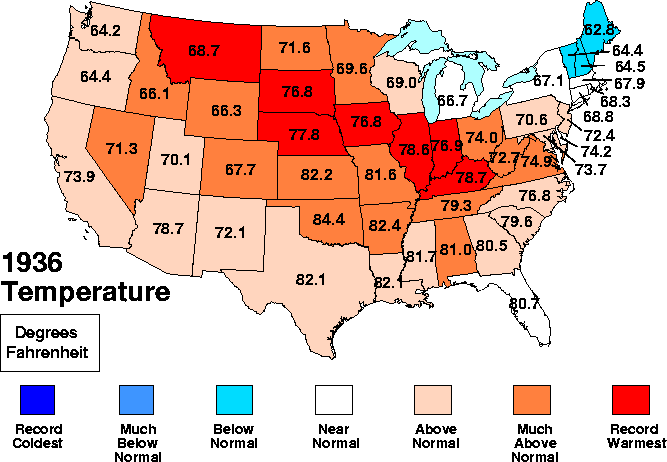
We’re told that heat waves are unprecedented. Yet historical U.S. temperature records show that the 1930s remain a remarkable period for extreme heat, particularly when examining the frequency of very hot days.

We hear alarming predictions about rising seas, disappearing polar bears, vanishing snow, worsening droughts, and an Arctic supposedly on the verge of becoming ice-free.

Some changes are real, of course. Global temperatures have risen, glaciers have retreated in many regions, and global mean sea level continues to increase.

But the magnitude, causes, regional differences, and practical consequences of these changes deserve careful examination. The data often tell a more complicated story than the nightly news.

That’s what this presentation is about.

Multiple Climate Topics, Four Major Categories

During the evening, I’ll examine multiple climate-related topics, organized into four sections.

1. Extreme Weather

We’ll examine hurricanes, tornadoes, heat waves, floods, droughts, and weather-related deaths.

The central question is simple: Are these events actually becoming worse in the ways we’ve repeatedly been told?

For some measures, the long-term trends are surprisingly unremarkable. Others show regional or seasonal changes, while improvements in forecasting, infrastructure, and disaster preparedness have dramatically reduced vulnerability to many weather hazards.

For example, global weather-related disaster mortality has fallen enormously over the past century, even as populations have grown.

That is a genuine success story, although you wouldn’t know it from much of the coverage.

2. Climate Impacts

We’ll look at sea level rise, Arctic sea ice, polar bears, coral reefs, wildfires, snowpack, and the well-documented greening of the planet.

One particularly interesting subject is the increase in global vegetation observed by satellites, partly attributable to rising atmospheric carbon dioxide.

CO₂ is routinely discussed as though its only meaningful effect is to increase temperatures. Yet it is also an essential ingredient in photosynthesis, and satellite observations have documented widespread increases in leaf area.

There are trade-offs, regional variations, and other environmental influences, naturally. But those benefits deserve a place in any serious discussion of atmospheric CO₂.

We’ll also examine claims about wildlife and ecosystems, separating observed changes from projections about what might happen decades from now.

3. Science, Temperature Measurements, and Climate Models

This is familiar territory for longtime WUWT readers.

I’ll discuss the limitations of climate models, the importance of comparing their projections with actual observations, and the influence of urbanization and land-use changes on surface temperature measurements.

Many readers will remember my work examining the quality of weather station siting across the United States.

A thermometer near asphalt, buildings, or artificial heat sources can experience local influences that complicate the measurement of broader climate trends. Researchers apply adjustments and use multiple observational systems to address these issues, but the methods and remaining uncertainties deserve continued scrutiny.

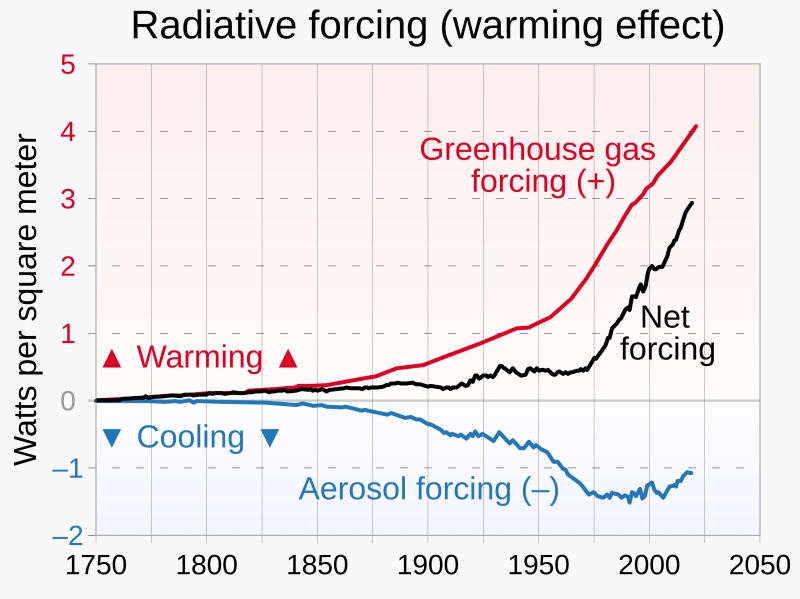
We’ll also examine the logarithmic relationship between CO₂ concentrations and radiative forcing, natural climate variability, solar influences, and the contribution of El Niño to recent temperature fluctuations.

And yes, we’ll revisit the famous “97% consensus” claim.

Scientific questions are ultimately settled by evidence, reproducibility, and the strength of competing explanations. Opinion surveys cannot substitute for those things.

4. What We Were Told Was Wrong

This section may be the most entertaining.

Over the years, we’ve seen some spectacular predictions about the climate future.

We’ve been warned about enormous numbers of climate refugees, disappearing islands, catastrophic changes in ocean chemistry, and a variety of deadlines after which supposedly irreversible disaster would become unavoidable.

Some of those predictions were poorly framed, others were exaggerated in the media, and still others were based on assumptions that deserve reassessment.

We’ll revisit several prominent examples and compare the original claims with what subsequently happened.

We’ll also discuss the use of high-emissions scenarios such as RCP8.5 and the growing recognition that scenario plausibility matters when communicating future climate risks.

A scenario is a conditional exercise. Treating an extreme scenario as though it represents the inevitable future is a recipe for misleading the public.

And there’s been far too much of that already.

Why This Matters

Climate policies have consequences.

Energy costs affect households, businesses, agriculture, manufacturing, and the reliability of electrical grids. Decisions involving trillions of dollars deserve more than appeals to fear or unquestioning acceptance of worst-case projections.

We should be able to discuss the benefits, costs, uncertainties, and practical limitations of proposed policies without being accused of heresy.

The climate system is enormously complex. We still have important uncertainties involving clouds, aerosols, ocean circulation, regional precipitation, and natural variability.

Acknowledging those uncertainties is an essential part of doing good science.

And examining the actual observations can provide a useful antidote to the constant drumbeat of catastrophe.

Come Join Me in Calgary — Or Watch Online

The Friends of Science Society has arranged an evening presentation followed by questions and answers. I’ll be discussing the data behind these 25 topics and explaining why I believe a more measured perspective on climate change is justified.

You don’t need a science degree to attend. The presentation is intended for the general public, and I’ll be using graphs and official datasets from sources including NOAA, NASA, the EPA, and the IPCC.

Here are the details:

Date: Monday, November 16, 2026
Time: 7:00 p.m. Mountain Time (doors open at 6:30 p.m.)
Location: Coast Calgary University Area Hotel by APA
Address: 1804 Crowchild Trail NW, Calgary, Alberta, Canada

Admission:

  • Friends of Science members: $25 CAD
  • Non-members: $30 CAD
  • Livestream: Free for members, $10 CAD for non-members

Free parking is available on site, and the venue is accessible by LRT.

Important: Tickets must be purchased in advance. There will be no ticket sales at the door.

Click here for event information and tickets.

Copies of Climate at a Glance, which I co-authored with James Taylor, will also be available for purchase at the event.

A Final Thought

After decades of hearing that we’re perpetually just a few years away from climate catastrophe, perhaps it’s time to ask a different question.

What if the future isn’t nearly as frightening as we’ve been led to believe?

That doesn’t mean ignoring genuine environmental problems or pretending that climate change has no consequences. It means examining those consequences in proportion to the evidence, understanding the limitations of predictions, and recognizing humanity’s extraordinary ability to adapt.

If you’re in the Calgary area, I hope you’ll join me. If you can’t attend in person, the livestream makes it possible to participate from anywhere.

Bring your questions. Bring your skepticism. And above all, bring your willingness to examine the evidence.

I’ll bring the graphs.

See you November 16.

— Anthony Watts


Event information and registration: Friends of Science Society
The climate data they don't want you to find — free, to your inbox.
Join readers who get 5–8 new articles daily — no algorithms, no shadow bans.
4.9 14 votes
Article Rating
Subscribe
Notify of
434 Comments
October 20, 2026 10:23 am

“Yet historical U.S. temperature records show that the 1930s remain a remarkable period for extreme heat”

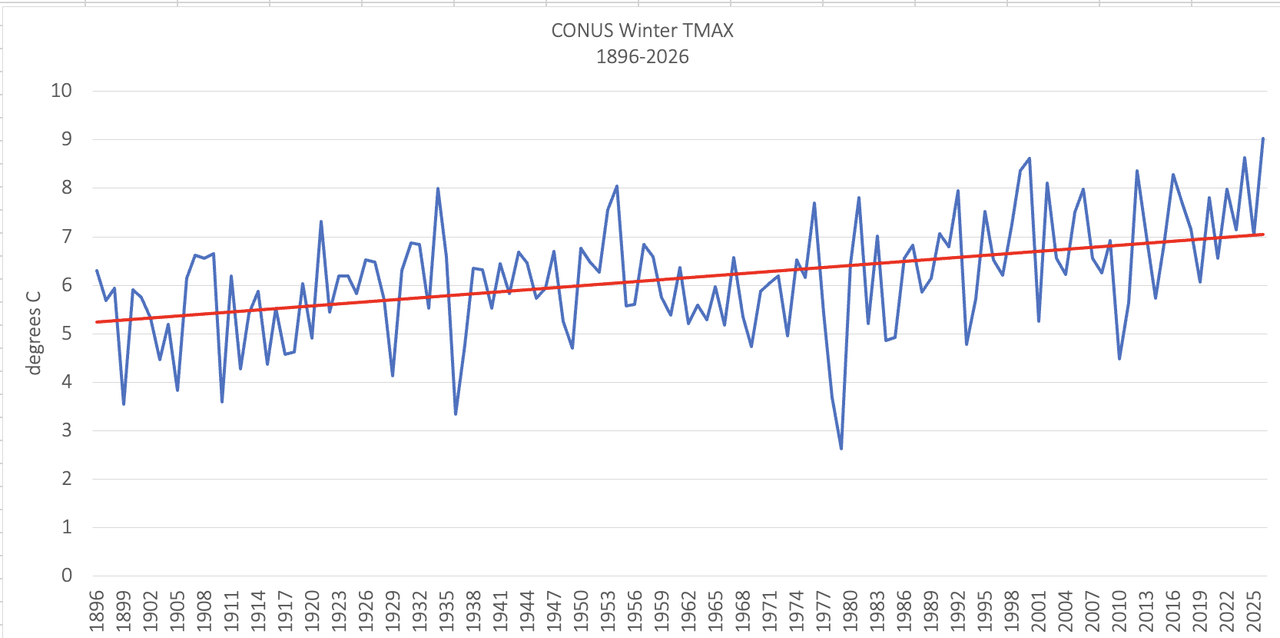
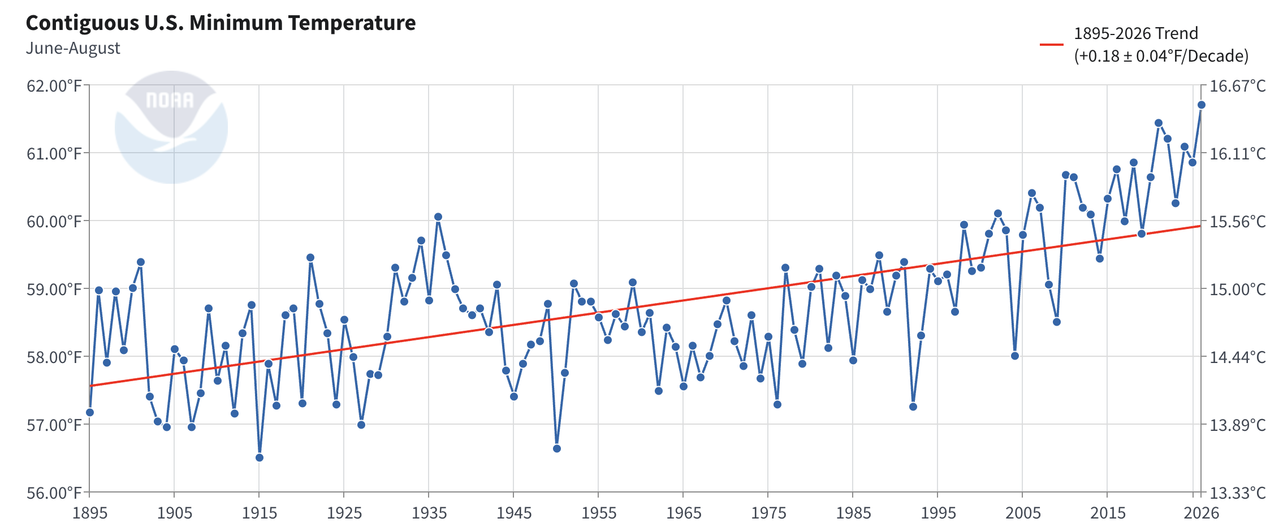
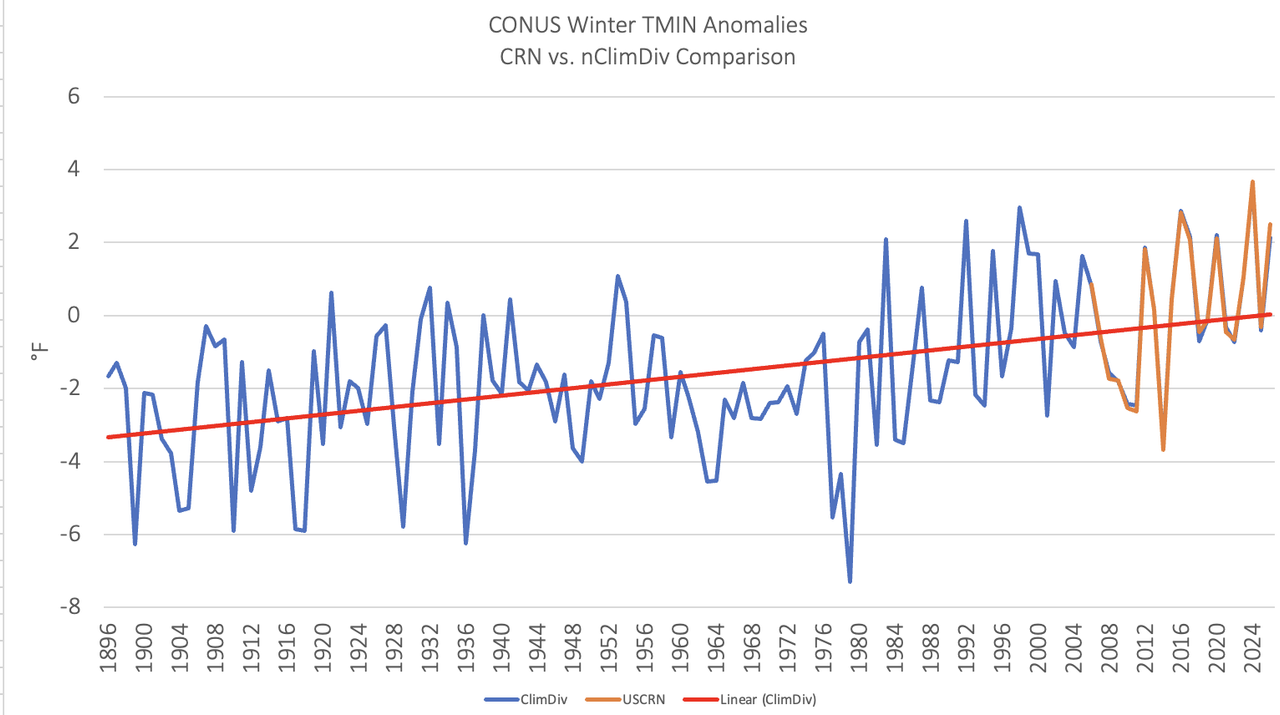
And really cold winters, too. The 1930s in the CONUS weren’t actually all that hot:

comment image

The winter of 1936 ranks among the coldest on record.

Reply to  Eldrosion
October 20, 2026 11:21 am

You do know that that red line is meaningless, don’t you?

Reply to  Phil R
October 20, 2026 11:23 am

Not useless at all. It clearly illustrates how rapidly winters are warming across the USA.

Reply to  Eldrosion
October 20, 2026 11:42 am

It doesn’t illustrate squat. The graph is the data (such that it is). People can look at the data for themselves and see what it’s doing or not doing. To someone with a hammer everything looks like a nail. And whenever there is time series data all you trendomancers want to throw a straight line on it.

Reply to  Phil R
October 20, 2026 11:56 am

So, you and the others here prefer eyeballing over quantitative analysis.

Not surprising.

Reply to  Eldrosion
October 20, 2026 12:48 pm

It is quantitative because time in not part of a functional relationship that determines temperature. You do know what a time series is don’t you? A time series has no causative value in climate science. It is like a business selling 10 things seeing its revenue increase but having no clue to why. The stock market would change overnight if time ever becomes a causative factor in stock price.

Reply to  Jim Gorman
October 20, 2026 2:03 pm

It is quantitative because time in not part of a functional relationship that determines temperature. 

I need to correct this.

It is not quantitative because time is not part of a functional relationship that determines temperature. 

Sparta Nova 4
Reply to  Eldrosion
October 20, 2026 1:24 pm

I see no quantitative analysis in that graphic.
I see a red line.

MarkW
Reply to  Eldrosion
October 20, 2026 1:36 pm

Analysis of cherry picked data. That’s good enough for you.

Reply to  Eldrosion
October 20, 2026 11:42 am

And that’s a bad thing?

Reply to  Joseph Zorzin
October 20, 2026 11:54 am

Yes, warmer winters reduce mountain snowpack, an important source of water supply in many states.

It also negatively impacts the ski industry.

Reply to  Eldrosion
October 20, 2026 12:09 pm

If there’s more rain and less snow- then communities down stream need to build dams to store the water. The ski industry? Well, we can’t have that happen, so now I know it’s reasonable to spend trillions of dollars and only use “clean and green energy”. /s

Warmer winters also mean people will use less fossil fuels to heat their buildings. Fuel oil here now in central Wokeachusetts is pushing close to $6/gallon. I see a lot of people now turning to wood. That’s a good thing if the wood comes from well managed forests or from their small properties- if they cut the right trees and leave the trees that should be left. So, warmer days, we’ll use less of that evil fuel, and more of nature’s wonderful product, wood.

Reply to  Joseph Zorzin
October 20, 2026 12:36 pm

The West already has a large network of reservoirs.

They now have to contend with reduced snowpack, prolonged drought, higher evaporation and higher water demand from humans. They are showing strain already.

https://science.nasa.gov/earth/earth-observatory/lake-powell-drops-to-record-low-levels/

Reply to  Eldrosion
October 20, 2026 12:51 pm

They are primarily showing strain because of higher usage. Growing population you know. The lower birth rate will solve that problem without spending trillions of dollars.

Reply to  Jim Gorman
October 20, 2026 1:52 pm

https://agupubs.onlinelibrary.wiley.com/doi/full/10.1002/2016WR019638

“Between 2000 and 2014, annual Colorado River flows averaged 19% below the 1906–1999 average, the worst 15-year drought on record. At least one-sixth to one-half (average at one-third) of this loss is due to unprecedented temperatures (0.9°C above the 1906–1999 average), confirming model-based analysis that continued warming will likely further reduce flows. Whereas it is virtually certain that warming will continue with additional emissions of greenhouse gases to the atmosphere, there has been no observed trend toward greater precipitation in the Colorado Basin, nor are climate models in agreement that there should be a trend. Moreover, there is a significant risk of decadal and multidecadal drought in the coming century, indicating that any increase in mean precipitation will likely be offset during periods of prolonged drought. Recently published estimates of Colorado River flow sensitivity to temperature combined with a large number of recent climate model-based temperature projections indicate that continued business-as-usual warming will drive temperature-induced declines in river flow, conservatively −20% by midcentury and −35% by end-century, with support for losses exceeding −30% at midcentury and −55% at end-century. Precipitation increases may moderate these declines somewhat, but to date no such increases are evident and there is no model agreement on future precipitation changes. These results, combined with the increasing likelihood of prolonged drought in the river basin, suggest that future climate change impacts on the Colorado River flows will be much more serious than currently assumed, especially if substantial reductions in greenhouse gas emissions do not occur.”

max
Reply to  Eldrosion
October 21, 2026 4:01 am

The last date was 12 years ago, the “results” could be compared with reality for that amount of time.

Reply to  Eldrosion
October 21, 2026 4:05 am

““Between 2000 and 2014”

What a carefully selected period! WTF does 15 years tell you about “climate” in the long term?

Reply to  AGW is Not Science
October 21, 2026 5:27 am

climate is a cyclical process. From glacial to interglacial. I.e. millennia in length. 100 years isn’t long enough. 500 years isn’t long enough.

Nyquist doesn’t just control the time period of observations for high frequency signals but also for low frequency signals. You can’t look at a segment of a sinusoid that is a few radians long and discern the future – unless you are a climate scientist of course.

Reply to  AGW is Not Science
October 21, 2026 7:53 am

It was latest complete period included in their analysis.

But if you read the paper, you’ll find the authors examined drought in context of historical temperature and precipitation records going back to 1896 and river flow records extending back to 1906.

The entire point was to examine why the latest period was the most severe 15 year period in the river flow record.

Reply to  Eldrosion
October 21, 2026 5:15 am

Too many people have moved into the American southwest during a period of better than average weather with more water- now that we’re back to drier conditions- all those people should move again. Or, they can learn to use less. One huge use of water is flushing toilets! Millions of people flushing many times/day. I’m sure there are technical solutions to that problem.

Reply to  Joseph Zorzin
October 21, 2026 5:22 am

It’s called an outhouse! Or a pit toilet!

Reply to  Tim Gorman
October 21, 2026 5:25 am

They’ll work- but I bet engineers can make more efficient toilets that don’t use 2-3 gallons of water to flush a few ounces of urine.

Reply to  Joseph Zorzin
October 21, 2026 6:16 am

Usually urine is pretty sterile. It might smell but that’s a different problem with different solutions. So why flush it each time? Just store it in a sealed container to limit the smell and flush it once a day (or when the container is full). It will just naturally provide its own flushing liquid.

Isn’t that what they do on airliners?

Reply to  Tim Gorman
October 21, 2026 7:15 am

I don’t flush every time for urine. Living alone, nobody will be offended. My water bill has been shooting up like everything else- good reason to not flush unless necessary. Now, if only everyone in the southwest where they worry about CO River water, that might alleviate the problem somewhat. I have 3 full bathrooms so I can spread the problem of unsightliness out a bit.

MarkW
Reply to  Tim Gorman
October 21, 2026 12:07 pm

At the company I used to work for, they had no flush urinals that did pretty much that. They all had to be replaced after it was discovered that the urine was eating away at the connections and fixtures.

Ex-KaliforniaKook
Reply to  MarkW
October 21, 2026 11:44 pm

At Boeing we had the same idea. Boeing installed new urinals that used an oil that was lighter than urine. No flush, no smell, the urine went into the pipes and beyond. The urinals had a pleasant blue liquid in them.

But after about two – three years (as I recall) the buildings began to stink. The urine had eaten through the pipes, no longer being diluted by water. Nasty situation. I sometimes wonder if that helped Boeing decide to sell most those campuses (Seal Beach and Huntington Beach) because it was too expensive to repair.

CampsieFellow
Reply to  Ex-KaliforniaKook
October 22, 2026 3:54 am

I have visited toilets in motorway service stations in Germany that say that they use neither water nor chemicals. How they work I have no idea.

Reply to  Joseph Zorzin
October 21, 2026 10:01 am

Done years ago. Today’s toilets are so efficient on water use that they often put too little water in the pipe, resulting in sewer/septic line clogs.

If you’re looking for wasted water try LAWN watering.

Reply to  AGW is Not Science
October 21, 2026 10:22 am

The new ones maybe- but millions of homes and buildings still have toilets from a generation or two ago. I think even the newer ones use 2 gallons. Not sure how 2 gallons will clog anything but it’s not my field of expertise. 🙂

MarkW
Reply to  Joseph Zorzin
October 21, 2026 12:12 pm

We recently bought a home that was built back in the 1970’s. We had to replace both toilets, when I inspected the tanks, I found that when I rubbed the inside of the tank with my finger, the ceramic would powder up and flake off.

The clogging occurs because the lower water volumes are not sufficient to move the solid waste on down the line.

stevo
Reply to  AGW is Not Science
October 22, 2026 2:07 am

Well that would be a personal opinion based on how much you like a good lawn… other people prefer to not flush or wash their car and water their plants. Bottom line….. its not up to you to decide how people use their water allocation. We have been through these arguments quite thoroughly here in Australia… Meanwhile we have massive flooding and the dams that were never going to fill again according to our Climate Czar have been full for a decade or more now……Anthony could use that as an example of total overreach. .

Reply to  Joseph Zorzin
October 21, 2026 8:30 am

The problem is living in desert areas and trying to turn them into temperate zones while ignoring how little rain falls there.

Desalination plants should have been in the construction phase years ago, but that assumes competent governments in west coast states, and their governments are the exact opposite of “competent.”

All the “issues” of the west coast states, save earthquakes, are caused by or exacerbated by “environmentalist” lunacy .

Don’t build dams;
Remove existing dams;
Route water that should be routed to reservoirs to the ocean;
Don’t allow controlled burns;
Don’t allow removal of dead trees and vegetation;
Don’t allow trimming of trees near power lines;
Close coal and nuclear power plants and build worse-than-useless wind and solar;

…then blame the resulting problems on “climate change,” the scapegoat for their stupidity.

Ex-KaliforniaKook
Reply to  AGW is Not Science
October 21, 2026 11:50 pm

Oh – you’re talking about California. We passed Prop 14 around 2015, which was verbally said to be for the purpose of building more reservoirs. In actuality, it paid for some studies, the removal of some dams that Buffet had bought and wanted to remove, and funds for immigrants.

No reservoirs. One of the reasons I left. The description of the propositions (and especially the titles) had little to do with the written propostion.

Reply to  Jim Gorman
October 21, 2026 4:03 am

As long as the borders are secure…

MarkW
Reply to  Eldrosion
October 20, 2026 1:38 pm

The west is losing a lot of it’s reservoirs do to the actions of your co-religionists and their opposition to them.
The west could have built more, but were prevented from doing so.

Reply to  MarkW
October 20, 2026 1:48 pm

You’re welcome!

MarkW
Reply to  Eldrosion
October 20, 2026 3:53 pm

First you declare that reservoirs are the answer, then you celebrate their removal.

Keep this up and you will reveal your true goals.

Reply to  Eldrosion
October 20, 2026 12:49 pm

How many fewer people die from cold? Would you condemn them so the ski industry could make more money?

MarkW
Reply to  Eldrosion
October 20, 2026 1:37 pm

Not true. Warmer winters just change the timing of when that mountain snow pack is released.

Reply to  MarkW
October 20, 2026 1:49 pm

Warmer winters mean more precipitation fall as rain than snow. Not good for mountain snowpack.

MarkW
Reply to  Eldrosion
October 20, 2026 3:54 pm

Whether it’s rain or snow, in a few months, it all ends up in the same place.

Your attempts to paint everything as catastrophic is failing.

Sparta Nova 4
Reply to  Eldrosion
October 22, 2026 12:57 pm

*deleted and posted below*

Mario Barbafiera
Reply to  Eldrosion
October 20, 2026 3:45 pm

Other than the increase in Antarctic Snow recently is precisely because of warm, moist air breaking through. One needs warmth for evaporation, for snow to fall. It’s more complicated than cold = snow, warm = no snow.

Reply to  Mario Barbafiera
October 20, 2026 7:13 pm

Yes, the situation differs by region.

If temperatures rise above 0°C, precipitation fall as rain rather than snow. In Antarctica, temperatures are, of course, well below freezing.

leefor
Reply to  Eldrosion
October 20, 2026 9:06 pm

At what elevation will it fall as rain rather than snow? 😉

And from CONUS? Even the lowlands near 30N?

Sparta Nova 4
Reply to  Eldrosion
October 22, 2026 12:57 pm

We have had snow fall and not on a mountain when the temperature was above 0 C.

Reply to  Sparta Nova 4
October 22, 2026 1:47 pm

Often. I am reminded of John Fogarty – Have you ever seen the rain.

DipChip
Reply to  Eldrosion
October 22, 2026 4:47 am

since the 1930 census the population of California, Nevada, Arizona, has increased from 6.2 million to 50.3 million, In a desert region of the world. 

Sparta Nova 4
Reply to  Eldrosion
October 22, 2026 12:54 pm

Ah yes. I remember the skier from Alaska giving testimony in a Congressional hearing. He did not know how much CO2 was in the atmosphere, among other details.

MarkW
Reply to  Eldrosion
October 20, 2026 1:35 pm

Warming winters is a good thing. Considering that fact that cold kills about 10 times as many people as does heat.

Leon de Boer
Reply to  MarkW
October 21, 2026 4:12 am

It’s a bot or an activist troll I don’t know why you all bother interacting with it.

Nothing is going to change on the climate change policy now because every country is struggling with economic issues mainly caused by crazy left wing policies. The riots in Europe have given politicians in insight into the problems cause by lefty politics

Causes of Unrest

Cost of Living: High fuel, energy, and food prices have squeezed household budgets.
Public Services: Dwindling resources in schools, universities, and healthcare have sparked widespread student and labor union walkouts.
Housing Crisis: Surging rents and unaffordable housing have led to tent camps and demonstrations.On top of that you have an AI revolution wiping out jobs and climate change rates as last on a list of problems voters care about.

Le Pen is leading polls in France and afd in Germany has seen it’s lead increasing. The afd got huge numbers in 3 recent state elections. So even if trump fails at midterms, Europe is about to to take a hard right swing and climate change politics is gone.

MarkW
Reply to  Leon de Boer
October 21, 2026 6:11 am

People used to fight bears that were chained up.
It’s an opportunity to hone your skills (in this case arguments). It’s also to inform the lurkers. Finally it’s the challenge, to see how long until the trolls start drooling on themselves.

Reply to  MarkW
October 21, 2026 6:49 am

I wrestled a bear once. But beer was involved and that’s a story for another time. 🙂

MarkW
Reply to  Phil R
October 21, 2026 12:13 pm

Did you actually wrestle the bear, or is that just what your friends told you the next morning?

Reply to  MarkW
October 21, 2026 1:08 pm

No, actually wrestled. Beer was involved, but not that much. Trained bear at a bar. Knocked me around a bit (actually, a lot). Lot of beer after I regained my breath.

Reply to  Leon de Boer
October 21, 2026 7:48 pm

> It’s a bot

Followed by an LLM laius.

Marine has 33%. Anyone who thinks this is enough for France to turn RN has no idea how elections are run in France.

AfD can’t even form a state gubmint where it actually is elected.

If only there were bears at Tony’s, it’d be worth visiting more often.

stevo
Reply to  Leon de Boer
October 22, 2026 2:13 am

I’ve been praying for years… hope its true this time.. the pendulum has finally swung far enough??? people have certainly had a a gutful of govts not doing their job of looking after their constituents.

Sparta Nova 4
Reply to  Eldrosion
October 22, 2026 12:52 pm

Rapidly. 3 C over 170 years?
It went from 87 F to 51 F in 12 hours in my local.
Environmental testing of components requires 3 C to 5 C per minutes.

Rapidly is ill place hyperbole.

Mr.
Reply to  Eldrosion
October 20, 2026 11:24 am

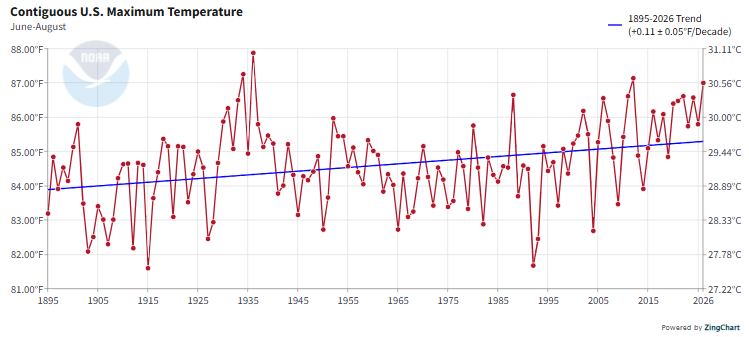
What was tmax doing then?

Reply to  Mr.
October 20, 2026 11:46 am

Probably not much. Seems like most of the warming, such as it is, has been in Tmin. Doubt Tmax shows the same thing, though I’m willing to be shown differently.

Reply to  Mr.
October 20, 2026 11:49 am

comment image

Reply to  Eldrosion
October 20, 2026 12:03 pm

About two degrees since the little ice age. Yep, not much.

Reply to  Phil R
October 20, 2026 12:22 pm

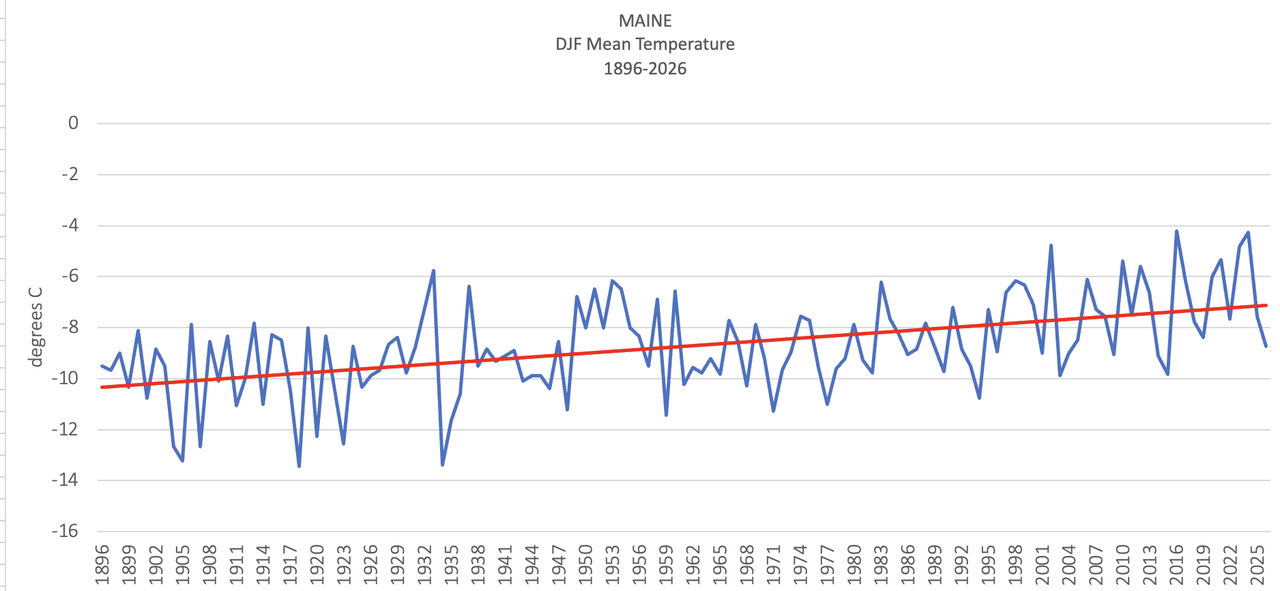
The CONUS average masks regional differences.

In northern states, the winter warming is even greater.

comment image

Maine’s average DJF temperature has increased by over 3°C since 1896.

Reply to  Eldrosion
October 20, 2026 1:56 pm

Guess that means the winter warming in the southern states is even less.

Reply to  Phil R
October 21, 2026 10:05 am

Read the label – WINTER tmax. So not a climate measurement but a seasonal measurement.

Reply to  AGW is Not Science
October 21, 2026 1:11 pm

Yeah, I saw that. Also note he cherry-picked northern states being colder than average (imagine that, northern states colder in the winter). Hence my comment about southern states being less cold than average.

Reply to  Phil R
October 22, 2026 6:40 am

Funny how “averages” work, isn’t it?

Reply to  Tim Gorman
October 22, 2026 8:47 am

🙂

Reply to  Eldrosion
October 20, 2026 12:52 pm

Again, I see a step around 1980. What changed in the CONUS at that time?

Mr.
Reply to  Eldrosion
October 20, 2026 1:36 pm

Wow!, look at 1932 – 1935.
It’s taken us ~ 70 years (a lifetime?) to get back to those warm times.

(And a 6.3 billion increase in world population, with the equivalent increase in land clearing, let alone urban heat islands effects.
Only morons would think that land clearing and UHI increases on these scales would not see ambient temps in these areas increase relatively. But we got air conditioning to more than compenseate.)

Reply to  Mr.
October 20, 2026 1:54 pm

Pristine, UHI-free CRN data corroborates wintertime TMAX trends:

https://www.ncei.noaa.gov/access/monitoring/national-temperature-index/time-series/anom-tavg/3/2

Ex-KaliforniaKook
Reply to  Eldrosion
October 21, 2026 11:55 pm

You’re very funny!

C_Miner
Reply to  Eldrosion
October 20, 2026 4:12 pm

That’s a pretty clear 3PI/2 sine wave, going from a minimum to a maximum. If it goes out to 2 full cycles then the trend would appear to be less than 0.5C per century.

Reply to  C_Miner
October 20, 2026 5:21 pm

You can’t predict an apocalypse with a sine wave. However, a linear regression projected out far enough will foretell the end of the world.

Reply to  Phil R
October 21, 2026 4:12 am

Their whole foundation for their bullshit story is cherry-pick to get a scary (to THEM) “trend” and then bleat about IF the trend continues, [insert hyperbolic statement about supposed disaster here].

Rinse and repeat.

MarkW
Reply to  AGW is Not Science
October 21, 2026 6:15 am

The pattern that I find interesting, is the timing of the 5 warm periods since the end of the Holocene Optimum.
End of the Holocene to the Minoan warm period. About 1200 years.
Minoan to Egyptian warm period, about 1200 years.
Egyptian to Roman, about 1200 years.
Roman to Medieval, about 1200 years.
Medieval to Modern, about 1200 years.
Also, the peak of each warm period is a little lower than the previous, as are the depths of the troughs between them.

Reply to  MarkW
October 21, 2026 10:10 am

Yup, we’re in an upward blip in an overall DOWNWARD trend during the Holocene.

When the next trough arrives, not to mention the descent into the next glaciation, all the people howling about global warming now will be wishing for its return.

Or (have said this before), they’ll claim “the warming caused the cooling,” and they’ll do it with a straight face.

Reply to  AGW is Not Science
October 21, 2026 11:25 am

“When the next trough arrives, not to mention the descent into the next glaciation,”

Whenever that happens. I’ve been hearing that for decades on here and on other skeptic blogs.

MarkW
Reply to  Eldrosion
October 21, 2026 12:15 pm

I’ve been waiting for evidence that the current warming is not entirely natural for over 50 years. Still nothing but crickets.

Reply to  MarkW
October 21, 2026 2:39 pm

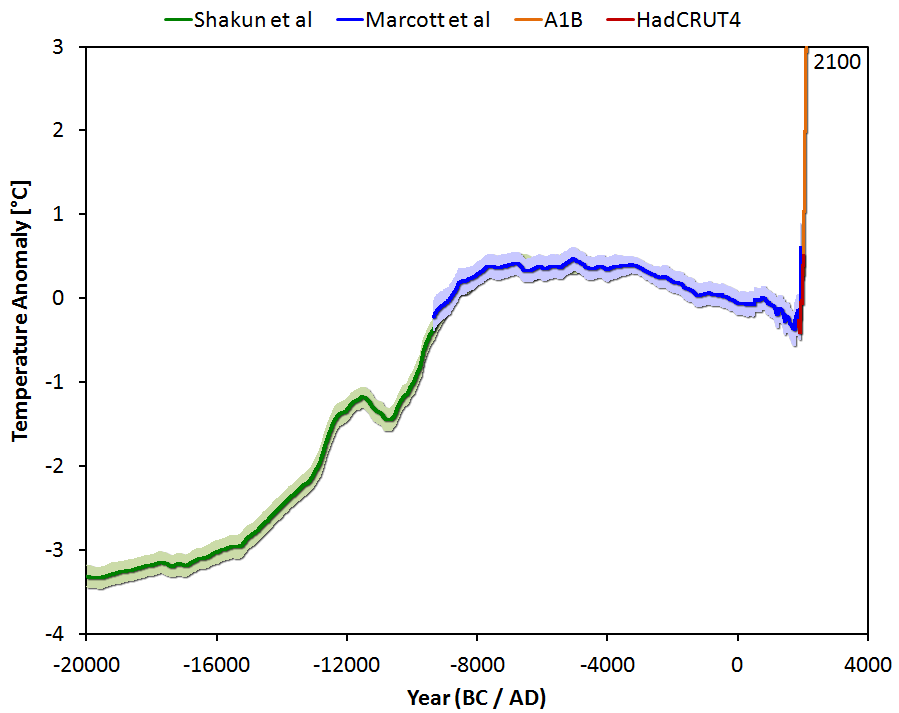
“Yes, global average temperatures rose by about 4°C to 5°C (7°F to 9°F) over a period of roughly 7,000 years coming out of the last ice age according to the Royal Society. [1]
Key Details of the Post-Ice Age Warming
Temperature Change: Global average temperatures increased by approximately 4°C to 5°C (with some estimates up to 5.5°C).Timeframe: This transition spanned about 7,000 years, generally starting around 17,000 to 18,000 years ago as the Last Glacial Maximum receded.Rate of Change: The natural warming rate averaged less than 1°C per 1,000 years. By comparison, human-driven global warming has caused roughly 1.3°C of warming in just the past 200 years—making modern climate change more than ten times faster. [1, 2]”

MarkW
Reply to  Eldrosion
October 21, 2026 3:35 pm

And here we go again, the moron insists on believing that the warming out of the most recent glacial phase was slow, steady and consistent.

Reply to  MarkW
October 21, 2026 8:25 pm

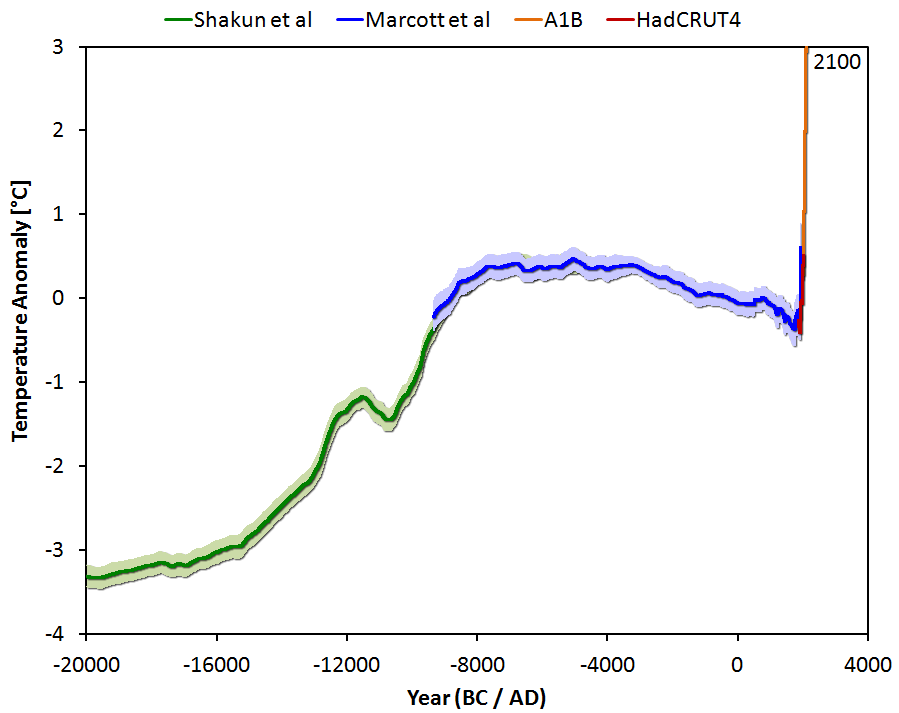
No, warming out the recent Ice Age was fast:

comment image

Sparta Nova 4
Reply to  Eldrosion
October 21, 2026 1:09 pm

We’ve been waiting for all those “climate disasters” proclaimed over the past 50 years to be acknowledged they did not occur.

Reply to  Eldrosion
October 21, 2026 12:29 am

This whole discussion, as usual, ignores the elephant in the room: energy policy.

Activists love to argue about warming, and nothing but warming. Because it allows them to continue with two false assumptions:

(1) that their proposed measures, the whole net zero agenda, are sensible and practical and affordable

(2) that if implemented locally they would make a difference to global warming.

Both are false, both are things the activists want at all costs to avoid talking about, because as soon as you examine then quantitatively they turn out to be unjustifiable, and obviously so. Even according to the activists own theories they are false.

The thing to say to Eldrosian (and Beeton and others) is not that they are wrong about global temperatures. They probably are, but never mind that. What you need to point out is that

(1) There is no connexion between what they want in energy policy and their claims about temperatures. The temperature claims do not justify, don’t give a rationale to support, the energy pollcies they advocate. This is partly because the policies do not materially reduce local emissions (they only attack a small percentage of emissions, and they end up using gas in least efficient mode, intermittent fast start), and partly because local emissions are a tiny part of global emissions, and the biggest and fastest growing emitters don’t buy it and have no intention of stopping growing, let alone reducing..

(2) The energy policies are also defective by design. You cannot replace dispatchable electricity generation with intermittent wind and solar. You also cannot justify adding wind and solar to a functioning fossil + nuclear grid: the fuel savings are minimal and the expense, once fully stated, astronomical. And you cannot at the same time as you try and implement this move to wind and solar generation expect to convert everyone to EVs and heat pumps, which will raise demand just as you make supply unreliable and intermittent.

You all need to focus, when debating Eldrosian and Beeton and others, on their policy agenda. This is the really important thing. This is what affects quality of life and well being. They are in the position of parents who claim that finishing your dinner is important because global hunger. And then try to only argue about the extent of global hunger, while avoiding the question of how finishing your dinner has any effect on it. And in the end resort to the traditional closure: “don’t argue with your mother”.

Yes, its at that level of irrationality. Call them on it!

Reply to  michel
October 21, 2026 4:15 am

Good point, to which we must add: A warmer climate IS NOT A PROBLEM, but a BLESSING.

Reply to  AGW is Not Science
October 21, 2026 4:38 am

AND also that there is zero empirical evidence that indicates the CAUSE of the warming is anything other than NATURAL variation – and plenty of empirical evidence that says it is NOT atmospheric CO2.

Sparta Nova 4
Reply to  michel
October 21, 2026 6:15 am

Well put.

Reply to  michel
October 22, 2026 5:37 am

> which will raise demand just as you make supply unreliable and intermittent.

Ukrainians and Iranians might demur about the reliability of fossil fuel.

MarkW
Reply to  Willard
October 22, 2026 12:37 pm

Is there anything that war does not make less reliable?

Reply to  MarkW
October 22, 2026 1:21 pm

Do you have a point, Mark?

Reply to  Eldrosion
October 20, 2026 11:42 am

You probably love it when there’s a record cold. When we have nice, comfortable, warm weather when it’s supposed to be cold- you must get bummed out. 🙂

Reply to  Joseph Zorzin
October 20, 2026 11:58 am

The thing is it is getting so hot that we’re losing the comfortable, warm weather, too.

Tony Sullivan
Reply to  Eldrosion
October 20, 2026 12:03 pm

“getting so hot”

Did you not proofread what you typed before posting that line? It’s nothing short of extreme hyperbole.

Reply to  Tony Sullivan
October 20, 2026 12:06 pm

My statement is based on what the data shows.

Reply to  Eldrosion
October 20, 2026 12:13 pm

Even if the data is more or less true- most people don’t give a dam- not sufficiently to support net zero plans- especially if they appreciate the BENEFITS of warmer weather.

Reply to  Joseph Zorzin
October 20, 2026 12:31 pm

“most people don’t give a dam- not sufficiently to support net zero plans”

Then I guess we’ll just keep warming the planet until people care enough.

What could possibly go wrong?

Reply to  Eldrosion
October 20, 2026 12:58 pm

Let’s see,
Fewer cold deaths,
more food,
less energy on heating,
an open Northern Passage for shipping,
more rain,
just to name a few.

MarkW
Reply to  Eldrosion
October 20, 2026 1:41 pm

Since the tiny bit of warming has been 100% beneficial, why should people care?

Reply to  MarkW
October 20, 2026 1:54 pm

Well, you obviously care so…

MarkW
Reply to  Eldrosion
October 20, 2026 3:56 pm

I see that along with logic and science, reading comprehension is another subject you failed at.

I don’t care about the warming, especially since it isn’t a bad thing.
What I care about is the damage those who claim warming is bad are doing to others.

Reply to  MarkW
October 20, 2026 6:46 pm

whatever lies you tell yourself.

MarkW
Reply to  Eldrosion
October 20, 2026 9:26 pm

And once again, anything you don’t want to be true, is dismissed as a lie.
Typical.

Reply to  MarkW
October 21, 2026 5:10 am

No doubt Eldrosion loved Biden’s policy of open borders.

Reply to  MarkW
October 21, 2026 5:09 am

Those Europeans dying from the heat– they probably don’t even try to buy an AC because they know they can’t afford the electricity thanks to ruinables.

Reply to  Eldrosion
October 21, 2026 4:40 am

WE’LL just keep warming? LMAO.

Your “climate control knob” exists only in the fantasy world of “climate models.”

Reply to  Eldrosion
October 21, 2026 11:45 am

We’re in a LOW CO2 world. Additions at this stage are 100% beneficial.

And your linked “study” is another model circle jerk that ASSUMES atmospheric CO2”drives” the Earth’s climate.

Let us know when you have the explanation for GLACIATION with ~10 times today’s atmospheric CO2, and can tell us how the relative PITTANCE in the atmosphere now is supposed to “drive” supposedly “dangerous” warming.

Reply to  AGW is Not Science
October 21, 2026 1:50 pm

The authors reconstructed Pliocene SSTs using geological proxies from 32 marine sites. The temperature estimates weren’t simply assumed from atmospheric CO2 concentrations.

“can tell us how the relative PITTANCE in the atmosphere now is supposed to “drive” supposedly “dangerous” warming.”

I’ll let Dr. Spencer do that:

“In the context of global warming, more CO2 added to the atmosphere from humanity’s burning of fossil fuels slightly reduces the Earth’s ability to cool to outer space through infrared energy loss, contributing to the Earth’s so-called ‘greenhouse effect’. This “heat radiation”, by the way, is also one of the energy loss mechanisms for a pot of water on the stove.
In global warming theory, this increase in the greenhouse gas content of the atmosphere causes an energy imbalance, which then causes warming. The warming then increases the rate of infrared energy loss until energy equilibrium is once again restored — but now at a higher temperature. This is the basic mechanism behind the theory of manmade global warming.”

https://www.drroyspencer.com/2010/04/the-illusion-of-a-sensitive-climate-system-a-stovetop-demonstration/

MarkW
Reply to  Eldrosion
October 21, 2026 12:17 pm

The problem is, we didn’t have a high CO2 world 3 million years ago.

Reply to  Eldrosion
October 21, 2026 5:07 am

The “climate sensitivity” is logarithmic with CO2 emissions- so any increase is likely to be minimal. Keep in mind there are trade offs to everything. Is going net zero worldwide worth ATTEMPTING to prevent a few more degrees of heat?

Reply to  Joseph Zorzin
October 21, 2026 5:40 am

You would think that so-called climate scientists would recognize that the logarithmic response coupled with CO2 sink growth (i.e. greening) is a feedback loop. The CO2 response goes down while the CO2 sink keeps growing. VOILA! A control limit on temperature increase caused by CO2. A NATURAL VARIATION.

It all goes back to the criticism by Freeman Dyson about the climate models. THEY ARE NOT HOLISTIC AT ALL. The assumption that CO2 grows while everything else in the biosphere stays the same is just ludicrous.

It’s just one more garbage assumption in the whole edifice of garbage assumptions by climate science so they can use temperature as a metric for climate!

Reply to  Joseph Zorzin
October 21, 2026 8:07 am

We’ve already warmed about 1.5°C above preindustrial levels, and the planet continues to warm, and at a faster rate now.

And the warming experienced so far reflects the transient climate response to increased CO2 concentrations, not the full equilibrium response.

Thus, the climate will continue to adjust as slower feedbacks play out, meaning additional warming is still expected even if CO2 concentrations stabilize.

Reply to  Eldrosion
October 21, 2026 8:58 am

Excellent- glad to hear it’ll warm some more. 🙂

Reply to  Joseph Zorzin
October 21, 2026 10:10 am

I’m not 🙁

MarkW
Reply to  Eldrosion
October 21, 2026 12:22 pm

Why not, the warming we have experienced has been 100% beneficial.

Reply to  Eldrosion
October 21, 2026 9:17 am

“Thus, the climate will continue to adjust as slower feedbacks play out, meaning additional warming is still expected even if CO2 concentrations stabilize.”

ROFL!! Those slower feedbacks can just as easily *slow* the warming or make it disappear.

if CO2 effect is logarithmically decreasing while greening of the earth continues apace at a rate *greater* then the sinks will grow faster than the effect. I.e. cooling.

You really don’t know how to analyze anything, do you?

Reply to  Tim Gorman
October 21, 2026 10:36 am

I suspect the feedbacks are not well understood- so Eldrosion’s claim they will cause continued warming is a stretch as you noted. They might but is that settled science? By the way, Tim, my memory ain’t what it used to be. What is the 3 letter code for that log relationship (climate sensitivity)?

Reply to  Joseph Zorzin
October 21, 2026 4:28 pm

Are you thinking ECS (Equilibrium Climate Sensitivity)?

Reply to  Jim Gorman
October 21, 2026 4:33 pm

Right- thanks. Never can remember that.

Sparta Nova 4
Reply to  Jim Gorman
October 22, 2026 7:00 am

It is quite a humorous turn of phrase, ECS, applied to coupled energy systems that are never, never in equilibrium.

Reply to  Tim Gorman
October 21, 2026 11:18 am

“Those slower feedbacks can just as easily *slow* the warming or make it disappear.”

Paleoclimate evidence (see the paper linked above) suggests otherwise.

SST proxies from approximately 3.205 million years ago (Pliocene interglacial) indicate temperatures 3.2–3.4°C warmer than preindustrial conditions, during a period when atmospheric CO2 concentrations were ~400 ppm.

Given that land generally warms faster than the oceans, global mean surface warming was greater than that reconstructed sea surface temperature anomaly.

And modern atmospheric CO2 concentrations are already around 430 ppm and continue to rise.

MarkW
Reply to  Eldrosion
October 21, 2026 12:25 pm

Tell me, do you buy kool-aid by the barrel?

First off, 400 ppm is still a world starved of CO2.
60 million years ago, CO2 levels were up around 1000ppm, and the world was cooler than today.

Only a complete ignoramus would take a single sample and declare it to be definitive.

I’m guessing you have never heard that correlation does not prove causation.

Reply to  MarkW
October 21, 2026 1:37 pm

“Only a complete ignoramus would take a single sample and declare it to be definitive.”

Well, you’ve just provided a single sample yourself:

“60 million years ago, CO2 levels were up around 1000ppm, and the world was cooler than today.”

MarkW
Reply to  Eldrosion
October 21, 2026 3:38 pm

And once again, you demonstrate your complete lack of knowledge of basic science and logic.
One data point cannot prove a theory, but a single data point can refute it.

When you figure out why, perhaps you will have taken your first step towards wisdom.

Reply to  MarkW
October 21, 2026 6:12 pm

No. CO2 isn’t the only thing that affects Earth’s temperature.

The argument posits that, ceteris paribus, rising CO2 concentrations reduce the planet’s outward radiative heat loss and induce warming.

Take a look at this:

https://skepticalscience.com/co2-levels-during-the-late-ordovician.html

Reply to  Eldrosion
October 22, 2026 4:25 am

“ceteris paribus”

ROFL!! What on the earth stays the same? Even the continents are continually moving!

“The argument posits that, ceteris paribus, rising CO2 concentrations reduce the planet’s outward radiative heat loss and induce warming.”

Th is nothing but gaslighting. CO2 reduces the OLR AT THE CO2 FREQUENCY!

But the earth doesn’t just radiate at the CO2 frequency! It radiates across the entire Planck spectrum. The little bit of radiation that CO2 reflects back gets sent out as even littler bits at *all* the frequencies in the Planck spectrum. Bits that are too small to measure!

It’s all just more garbage gaslighting from climate science!

Reply to  Eldrosion
October 21, 2026 1:17 pm

I’d really love to know what the temporal resolution on 3.205 million year-old SST proxies is.

Reply to  Phil R
October 21, 2026 1:45 pm

Low resolution. But this isn’t a time-series reconstruction.

The authors were comparing average temperature estimates between two intervals: the preindustrial period and a Pliocene interglacial approximately 3.205 million years ago.

They don’t need a continuous temperature record between those periods, only reliable estimates for the long term average temperature from proxies for those two intervals.

MarkW
Reply to  Eldrosion
October 21, 2026 3:41 pm

If you want to claim that the temperature changes between those two points you can only do that by providing many data points between those two dates. For all you know, the actual temperatures could have been moving rapidly up and down for the entire time, it’s just that slow moving proxies have averaged out those rapid changes.

Reply to  Eldrosion
October 22, 2026 4:29 am

“The authors were comparing average temperature estimates “

“They don’t need a continuous temperature record between those periods, only reliable estimates for the long term average temperature”

(bolding mine, tpg)

Do you *EVER* bother to think thinks through? How do you estimate long term average temperature if you don’t have knowledge of the continuous temperature record?

All you are saying is that climate science is GUESSING. And their guess has subjective bias!

Sparse sampling results in large sampling uncertainty.

Reply to  Tim Gorman
October 22, 2026 5:31 am

Temperature fluctuations can be smoothed out through temporal averaging, helping reveal the underlying climatic state, provided the observations are sufficiently representative.

The marine proxies used in this study are geographically widespread and provide coverage across different ocean regions.

And yes, sparse sampling introduces uncertainty. The authors explicitly acknowledge that.

Reply to  Eldrosion
October 22, 2026 9:32 am

Temperature fluctuations can be smoothed out through temporal averaging, helping reveal the underlying climatic state, provided the observations are sufficiently representative.

Temperature fluctuations can certainly be smoothed over by averaging. Can you look at Tavg and KNOW what temperatures caused that value? A monthly average assumes that the temperatures were Gaussian. Are they really? Should most months be treated as skewed? The average won’t tell you.

Average temperatures can only give one component of the actual climate. Your insistence that temperatures give a view of the climate state is basically misinformation. When you claim Miami and Las Vegas have similar average temperatures, do you also mean they have similar climates?

When you give a global temperature, do you mean everywhere on the globe has that temperature? If not, then it is meaningless. You might quote the temperature and the variance in the absolute temperatures from which it is calculated, but that wouldn’t look so scary would it?

Look up yesterday’s Tmax and Tmin, most phones can access that very quickly. Tell what the (Tmax – Tmin)/2 mean temperature is, then calculate the standard deviation of that distribution, there are dozens of SD calculators on the internet, then give us what the SD is. Does that measurement uncertainty get propagated to the monthly average. Show us how that works.

MarkW
Reply to  Eldrosion
October 22, 2026 12:54 pm

Temporal averaging can also be used to hide what is actually happening.

Reply to  Eldrosion
October 21, 2026 4:24 pm

SST proxies from approximately 3.205 million years ago (Pliocene interglacial) indicate temperatures 3.2–3.4°C warmer than preindustrial conditions

One more time. You are using anomalies. Anomalies are not temperatures. Write that on the blackboard 100 times.

Climate scientists that promote anomalies as actual temperatures are doing so incorrectly.

You mention SST proxies. Show us one and find where the authors determined the baseline temperature 3.205 million years ago in order to calculate an anomaly. Show how they calculated the uncertainty in the anomaly. I have seen some papers where the measurement uncertainty of the estimated anomaly is as large as the anomaly itself.

BTW, 3.205 million years ago is a precise estimate of time. Like 3,205,000. Tell us how they determined the time down to 5,000 years. My guess would be 3,205,500 (/sarc).

Reply to  Eldrosion
October 22, 2026 4:20 am

“Paleoclimate evidence (see the paper linked above) suggests otherwise.”

ROFL! We’ve never had glacial periods, eh? Somehow warming feedbacks caused glaciers?

Reply to  Tim Gorman
October 22, 2026 5:00 am

You know glacial interglacial cycles actually provide evidence for large climate sensitivity.

Changes in Earth’s orbital configuration alter the seasonal and geographical distribution of solar radiation, particularly summer insolation at high northern latitudes.

These changes influence whether snow and ice accumulate or melt, ultimately trigging the onset or termination of Ice Ages.

Sparta Nova 4
Reply to  Eldrosion
October 22, 2026 7:04 am

You just admitted CO2 is NOT the control knob by brining orbital configuratons into the conversation.

MarkW
Reply to  Eldrosion
October 22, 2026 12:56 pm

Because the climate is sensitive to one thing proves that it is sensitive to everything.
Are you actually trying to give lessons in how to NOT DO science?

MarkW
Reply to  Eldrosion
October 21, 2026 12:20 pm

The world is rebounding from the coolest period it has seen since before the Holocene Optimum. Exactly the way it rebounded from the low temperature periods during each of the previous 4 warm periods since the end of the Holocene optimum.
Getting warmer is not evidence that CO2 caused it. Not till you can point to the causes of the previous warm periods and demonstrate that whatever caused them, is not causing this one.

I see you are still trying to push the lie that the current warming is faster than previous warmings.

BTW, every major feedback is negative. Most of them strongly so.

Reply to  Eldrosion
October 21, 2026 1:14 pm

meaning additional warming is still expected if we want to keep getting our grant money, you mean.

Reply to  Eldrosion
October 20, 2026 12:55 pm

Why don’t you tell us what the optimum temperature should be. Just assuming hotter is bad, then colder must be good. Just how cold should it be for the optimum temperature?

MarkW
Reply to  Jim Gorman
October 20, 2026 1:43 pm

History is quite clear. During warm periods, people thrive.
During cold periods, people die.
The planet is still cooler than each of the recent warm periods and much cooler than the Holocene Optimum, when the first civilizations flourished.

Reply to  Jim Gorman
October 20, 2026 2:03 pm

Heap big warmy warmy, then coldy coldy…

Reply to  Jim Gorman
October 20, 2026 2:06 pm

Why? Warming is occurring so rapidly that we may never experience the supposed benefits of this “optimal
temperature.”

We’ll eclipse right past whatever the optimum temperature threshold is, just as we’ve been warming since 1975.

MarkW
Reply to  Eldrosion
October 20, 2026 3:58 pm

Less than 2 degrees over 200 years is fast?
Your delusions are getting grander by the post.

Reply to  MarkW
October 20, 2026 6:40 pm

“Yes, global average temperatures rose by about 4°C to 5°C (7°F to 9°F) over a period of roughly 7,000 years coming out of the last ice age according to the Royal Society. [1]
Key Details of the Post-Ice Age Warming

Temperature Change: Global average temperatures increased by approximately 4°C to 5°C (with some estimates up to 5.5°C).Timeframe: This transition spanned about 7,000 years, generally starting around 17,000 to 18,000 years ago as the Last Glacial Maximum receded.Rate of Change: The natural warming rate averaged less than 1°C per 1,000 years. By comparison, human-driven global warming has caused roughly 1.3°C of warming in just the past 200 years—making modern climate change more than ten times faster. [1, 2]”

Reply to  Eldrosion
October 20, 2026 8:12 pm

global average temperatures rose by about 4°C to 5°C (7°F to 9°F) over a period of roughly 7,000 years coming out of the last ice age according to

The lack of awareness is overwhelming. You are comparing possibly spurious proxies with actual measurements. You are as mad as a cut snake.

Reply to  Mike
October 20, 2026 8:21 pm

Dr. Spencer compares proxies with temperature measurements.

https://www.drroyspencer.com/2013/07/senate-epw-hearing-climate-change-its-happened-before/

MarkW
Reply to  Eldrosion
October 20, 2026 9:32 pm

Not all proxies are created equal. There are slow proxies and there are fast proxies.
With every post, you just expose that much more of your ignorance.

Reply to  MarkW
October 20, 2026 9:45 pm

“There are slow proxies and there are fast proxies.”

Weird, I wasn’t aware proxies could get up and physically relocate themselves.

MarkW
Reply to  Eldrosion
October 21, 2026 6:21 am

When eld runs out of pre-packaged arguments, he attempts to be funny.

Read up on the differences between millenial, centanial, decadal and annual scale proxies.

Perhaps if you ask your cell master, he might give you permission.

Reply to  MarkW
October 21, 2026 6:55 am

Olderosion likes sciency-sounding words and phrases, so call it temporal resolution. A centenial-scale proxy could have temperature variations more extreme than the last century and you never could resolve it. You would have a 100-year average temp., with all the relevant information lost in the average.

Reply to  MarkW
October 21, 2026 8:00 am

“Read up on the differences between millenial, centanial, decadal and annual scale proxies.”

Roy Spencer should too, apparently since he compares proxies to instrumental thermometers.

Reply to  Eldrosion
October 21, 2026 9:12 am

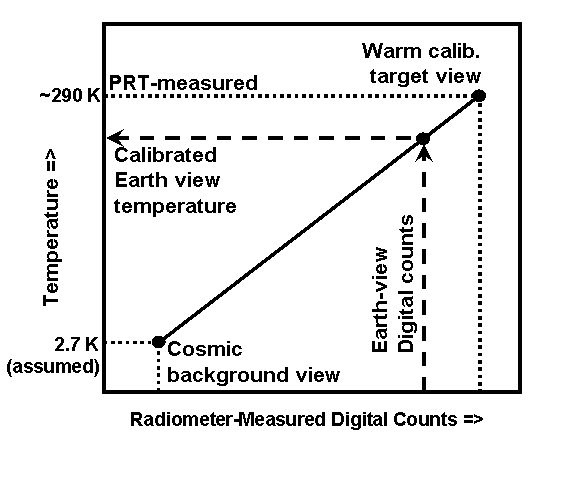
What instrumental thermometers? Satellites with a +/- 4C measurement uncertainty? With land LIG thermometers with a +/- 1C measurement uncertainty?

You *really* don’t understand calibration do you? Self-calibration is fool’s gold. You need to calibrate against a STANDARD. Comparing field measurement LIG data to field satellite data to field electronic data just spreads measurement uncertainty all over the place. You can’t eliminate systematic effects in that manner.

Reply to  Tim Gorman
October 21, 2026 9:15 am

Tim tries to deflect with his pet topic.

Reply to  Eldrosion
October 21, 2026 9:32 am

I, at least, understand the basics of metrology, the science of measuring. *I* have crereated measurement uncertainty budgets.

YOU? You just employ argumentative fallacies so you don’t have to actually refute anything.

Do *YOU* believe that calibrating the satellite network against itself is a valid method of calibration?

I know I won’t get an answer. You *never* have anything to offer that is applicable in the real world.

MarkW
Reply to  Eldrosion
October 21, 2026 12:27 pm

Pointing out one of the many problems with your data is just deflection?
Are you really this pathetic?

MarkW
Reply to  Eldrosion
October 21, 2026 12:26 pm

As I told you before, Dr. Spencer is not using long term proxies.
I guess you simply aren’t smart enough to understand the concept of resolution.

Reply to  MarkW
October 21, 2026 2:00 pm

[deleted].

Colin Belshaw
Reply to  MarkW
October 21, 2026 1:45 am

Is it ignorance? Or is it ridiculous terrified stupidity?

MarkW
Reply to  Eldrosion
October 20, 2026 9:30 pm

And once again, Eld demonstrates that it knows nothing about even basic science or statistics.

Please learn about the difference between millenial scale proxies and thermometer readings and why rates of change between them cannot be compared.

In order to compare millenial scale climate proxies to thermometer record, you have to take 1000 years worth of thermometer readings and average them together. Then you back up the beginning and end of your range, and then do another average.

Reply to  MarkW
October 21, 2026 8:13 am

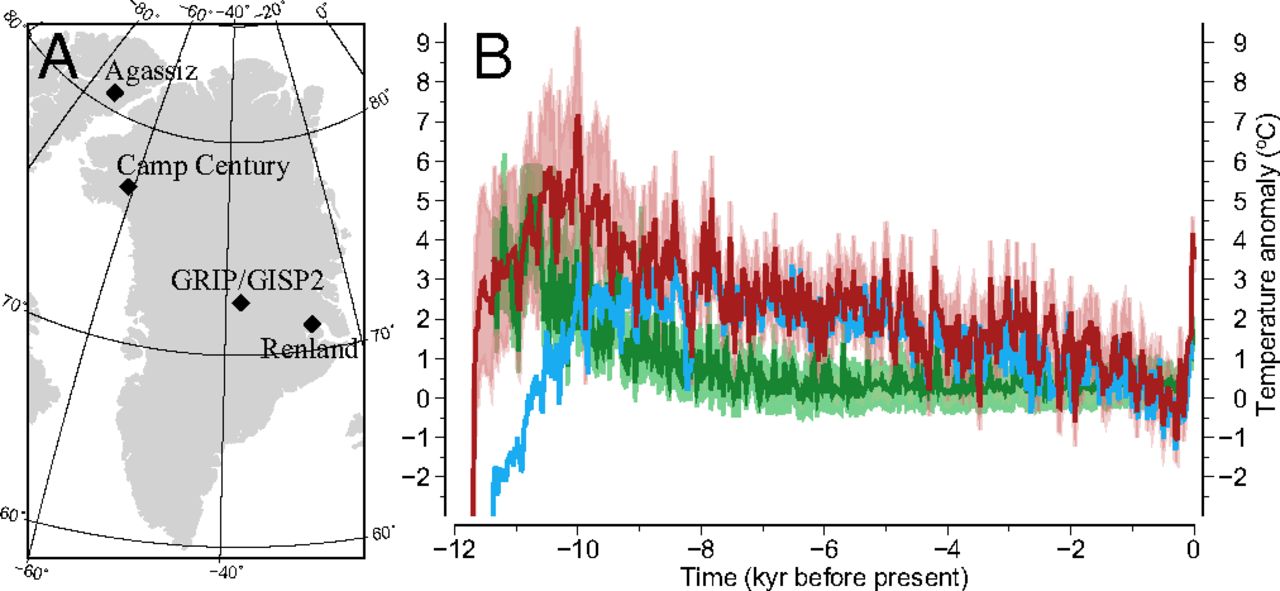
Ice core record throughout, no instrumental temperature splicing:

comment image

“We present a revised and extended high Arctic air temperature reconstruction from a single proxy that spans the past ∼12,000 y (up to 2009 CE). Our reconstruction from the Agassiz ice cap (Ellesmere Island, Canada) indicates an earlier and warmer Holocene thermal maximum with early Holocene temperatures that are 4–5 °C warmer compared with a previous reconstruction, and regularly exceed contemporary values for a period of ∼3,000 y. Our results show that air temperatures in this region are now at their warmest in the past 6,800–7,800 y, and that the recent rate of temperature change is unprecedented over the entire Holocene.”

https://www.pnas.org/doi/10.1073/pnas.1616287114

Reply to  Eldrosion
October 21, 2026 11:11 am

If you can, tell us the actual temperatures. Were they the same as now, colder, or warmer? I could care less about the anomaly. I want to know the actual temperatures in order to compare them to today.

I’ll give you a hint, anomalies ARE NOT temperatures. They should not be treated as temperatures. They are a ΔT. A change in temperature! Adding them, averaging them, and comparing them is like looking at two race cars. Would an average change in velocity tell you anything at all about the individual cars? How about averaging accelerations? What can you discern from that?

Reply to  MarkW
October 21, 2026 4:46 am

Not “just” two degrees “warmer” either – two degrees AVERAGE temperature increase, mainly down to overnight low temperatures not getting as cold, and mostly the high latitudes and poles.

Hardly a “catastrophe” – and not “faster than ever” – the Earth has experienced far faster rates of warming/more rapid change even shown in proxy records with less resolution.

Oh and of course the current “trend” is amplified by “adjustments” heavily polluted with confirmation bias.

Reply to  AGW is Not Science
October 21, 2026 8:25 am

“Oh and of course the current “trend” is amplified by “adjustments” heavily polluted with confirmation bias.”

Do you think this applies to the UAH satellite temperature record, maintained by climate skeptic Dr. Roy Spencer? Its temperature trends are actually quite similar to those reported by other global temperature datasets.

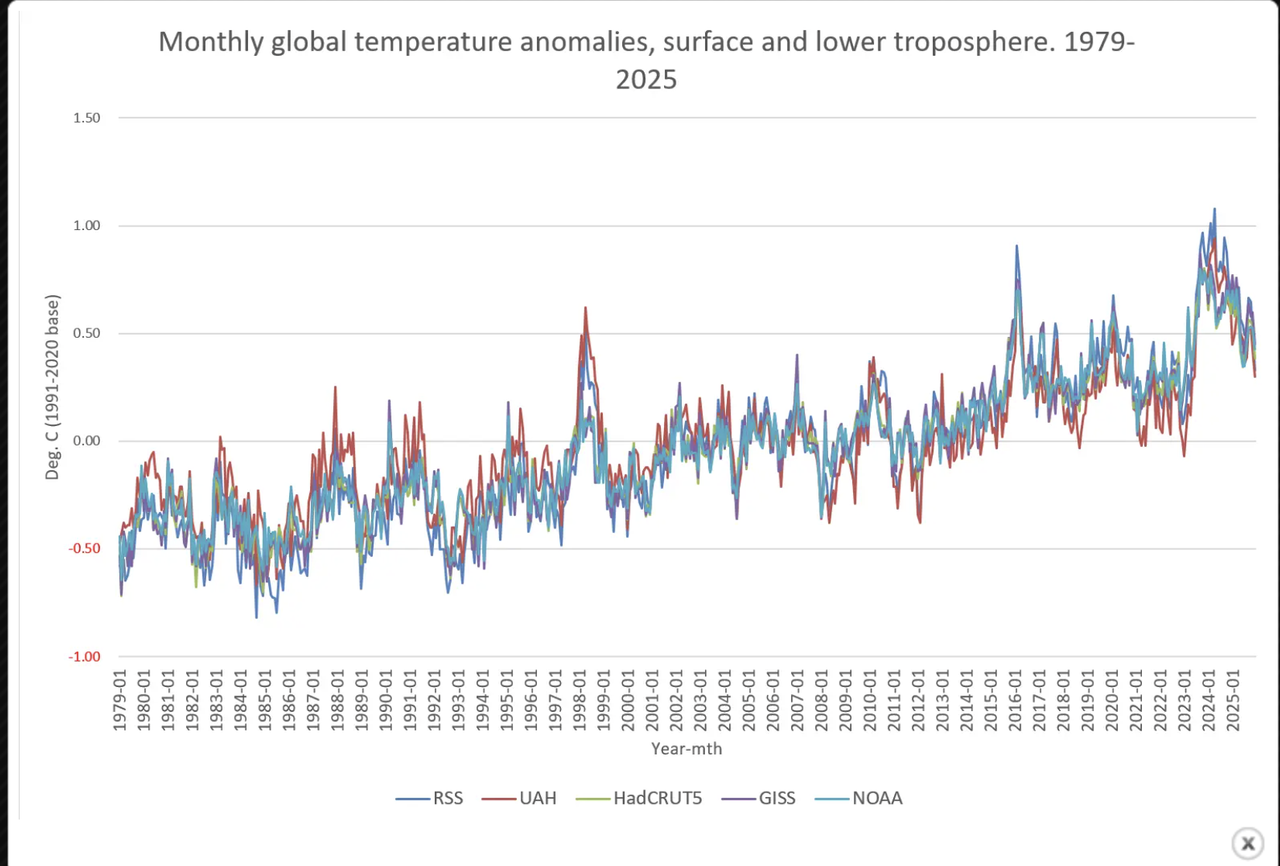
“July 30, 2026 3:31 pm

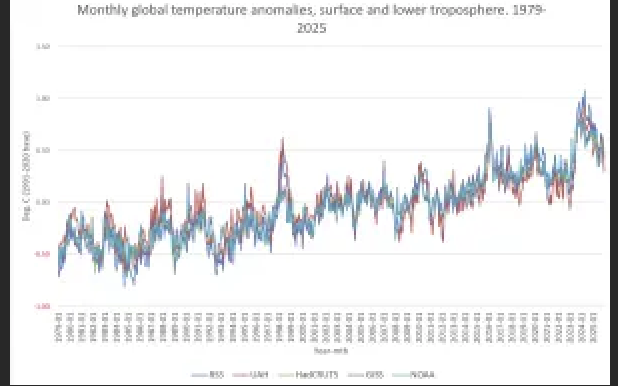
This chart shows two satellite lower troposphere sets (RSS and UAH) and three surface temperature data sets (HadCRUT, GISS and NOAA), 1979-2025, as monthly anomalies all set to the same 1991-2020 base.

All show statistically significant warming. The error margins in all their warming rates overlap.”

comment image

https://wattsupwiththat.com/2026/07/30/the-era-of-decentralized-observation/#comment-4224043

Reply to  Eldrosion
October 21, 2026 9:13 am

Sorry, this is a bad image.

Here’s a better one:

comment image

Reply to  Eldrosion
October 21, 2026 9:21 am

“ Its temperature trends are actually quite similar to those reported by other global temperature datasets.”

Once again, self-calibration doesn’t work. Two inaccurate measurements don’t create an accurate one.

With a +/- 4C measurement uncertainty for UAH what do you think the comparison is actually telling you?

Reply to  Tim Gorman
October 21, 2026 9:29 am

“With a +/- 4C measurement uncertainty “

Tim just pulls a number out of thin air.

Reply to  Eldrosion
October 21, 2026 9:38 am

Nope. I’ve been down this road. The satellites don’t even measure the path loss associated with the radiance. Doing so would require having a calibrated transmitter at each location being sampled that the satellite could calibrate against. That alone contributes as much as +/- 2C measurement uncertainty. Self-calibration using drifting hot sources adds another +/- 0.5C. Orbital drift and sampling uncertainty adds another +/- 0.5C. Degradation in the radiometers adds another +/- 0.5C. Uncertainty in the radiance to temperature conversion adds another +/- 0.5C.

+/-4C measurement uncertainty is a LOW BALL estimate.

You *do* understand the problems with trying to get to the satellites to actually calibrate them against an external standard causes the systematic uncertainty effects, don’t you?

Or do you just apply the standard garbage assumption of climate science that “all measurement uncertainty is random, Gaussian, and cancels”?

Reply to  Tim Gorman
October 21, 2026 11:28 am

‘+/-4C measurement uncertainty is a LOW BALL estimate.”

Then perhaps you should explain why multiple independently developed temperature datasets, using different methodologies, manage to reproduce remarkably similar temperature histories and long-term warming trends.

If measurement uncertainties really were as large as ±4°C, how do you account for that consistency across datasets?

Their agreement is hardly what one would expect if the temperature record were dominated by errors of that magnitude.

Reply to  Eldrosion
October 21, 2026 12:22 pm

Their agreement is hardly what one would expect if the temperature record were dominated by errors of that magnitude.

You have no clue do you. Measurements are stated as: value ±uncertainty. There are only a few methodologies, primarily arithmetic averaging, and they all use the same values from the national meteorology groups in each nation. Why would you expect vastly different average values?

Have you ever downloaded any of the databases that have weather information? None of them have any, none, nada information concerning measurement uncertainty of the different devices used over the years. It is up to the end user to develop the uncertainty levels of the values and incorporate it into their work.

When you download data from NOAA or screenshot graphs from NOAA do they give you the option of including error bars? Do they even mention that the data is not considered 100% accurate and that appropriate measures should be included in any analysis?

Path loss for UAH is a serious matter. I suspect you have never done any microwave link engineering. Water vapor causes considerable loss at higher frequencies. Microwave links must take into account humidity, fog, atmospheric scattering, and rain. The same things that can cause measurement uncertainty in the detection of oxygen radiance by UAH.

Reply to  Jim Gorman
October 21, 2026 2:53 pm

“Measurements are stated as: value ±uncertainty. “

Individual measurement uncertainty is not the same as uncertainty in global average.

“Why would you expect vastly different average values?”

Satellites, SSTs, and land temperature observations rely on different measurement techniques actually.

And yet, despite that, they show consistent long term warming estimates.

MarkW
Reply to  Eldrosion
October 21, 2026 3:45 pm

The warming started decades before CO2 started rising significantly.
There have been many times in the past when temperatures increased, (the 4 previous warm periods since the end of the Holocene for example).
Why do you believe that CO2 must be responsible for the current warming? You have no evidence to support such a supposition, with lots of evidence throwing such a belief into doubt.

Reply to  Eldrosion
October 22, 2026 4:53 am

“Individual measurement uncertainty is not the same as uncertainty in global average.”

Not this CLIMATE SCIENCE CRAP AGAIN!

Measurement uncertainty is *NOT* random and Gaussian. It does *NOT* cancel out.

Path loss represents a SYSTEMATIC measurement uncertainty. You can’t eliminate it by averaging. You can’t even eliminate random uncertainty unless you can PROVE that it is random and Gaussian.

Everything I gave you in the list of measurement uncertainties is a systematic influence. You either quantify it and correct for it or it influences the measurement value and it can’t be identified by statistical analysis of the measurement data.

Individual uncertainties in multiple measurements of different things using different instruments under different environments ADD. The total measurement uncertainty is *always* more than the individual measurement uncertainties.

“Satellites, SSTs, and land temperature observations rely on different measurement techniques actually.”

SO WHAT? They ALL have measurement uncertainties that ADD – and *ALL* of those measurement uncertainties are dismissed by climate science by assuming they are random, Gaussian, and cancel.

All you are really saying here, although you don’t understand it or realize it, is that the GREAT UNKNOWN is a major factor when comparing all of them. One more time: you can’t get accurate results from inaccurate measurements. It doesn’t matter how many different tape measures you use to measure the length of a board – the inaccuracy will be a sum of the uncertainties of all of them. They don’t generate an accurate measurement!

Reply to  Tim Gorman
October 22, 2026 6:10 am

“Measurement uncertainty is *NOT* random and Gaussian. It does *NOT* cancel out.”

Strawman?

Where exactly did I say that measurement uncertainties are necessarily random, Gaussian, or cancel through averaging? I said that individual measurement uncertainty is not the same as uncertainty in a global average. Those are two different things.

Determining the uncertainty of a derived quantity requires uncertainty propagation, which explicitly accounts for correlated uncertainties and systematic effects.

“You can’t even eliminate random uncertainty unless you can PROVE that it is random and Gaussian.”

Not necessarily. Say a thermometer has independent, zero-mean random errors: +0.5C, -0.3C, +0.2C, -0.4C. The errors sum to zero, even though the researcher might not know their individual values.

“The total measurement uncertainty is *always* more than the individual measurement uncertainties.”

You continue to insist on this false narrative. Even Pat Frank acknowledges that there are circumstances in which the uncertainty of an average can be smaller than the uncertainty of the individual measurements.

For example, suppose you have 100 independent temperature measurements, each with a standard uncertainty of ±1°C. If their measurement errors are independent and have zero mean, the standard uncertainty of their arithmetic average is: u=1/√100 = 0.1C.

Reply to  Eldrosion
October 22, 2026 7:07 am

“Strawman?”

Nope. It’s the consequence you must accept of saying that measurement uncertainty of an average is less than the individual measurement uncertainties. You can run but you can’t hide!

“Where exactly did I say that measurement uncertainties are necessarily random, Gaussian, or cancel through averaging? I said that individual measurement uncertainty is not the same as uncertainty in a global average. Those are two different things.”

They are all part of the same data set. The individual measurements are used to form the global average. THE GLOBAL AVERAGE IS NOT A MEASUREMENT, IT IS A STATISTICAL DESCRIPTOR CALCULATED FROM THE DISTRIBUTION VALUES.

The measurement uncertainty of the global average is the propagated measurement uncertainties of the individual measurements. It is *not* the average uncertainty. It is *not* the sampling uncertainty.

Why don’t you tell all of us what the measurement uncertainty interval is for the GAT? Not the SEM, that is sampling uncertainty. What is the MEASUREMENT UNCERTAINTY?

“Determining the uncertainty of a derived quantity requires uncertainty propagation, which explicitly accounts for correlated uncertainties and systematic effects.”

Just how are the temperature measurement uncertainties of different measuring instruments in different environments correlated?

You are doing the same gaslighting that climate science does. If the temperatures are correlated, e.g. seaonsally, then the measurement uncertainties must be correlated. That’s just one more garbage assumption by climate science to keep from having to actually propagate the measurement uncertainties in a standard manner.

Systematic measurement uncertainty in temperature measurements *IS* propagated. It *adds* each time you add another measurement into the data set. It is *NOT* accounted for ANYWHERE. That implies it is corrected for. You can’t correct for things you don’t know – that just adds *MORE* uncertainty into the equation!

STOP CHERRY PICKING THINGS YOU DON’T UNDERSTAND!

“For example, suppose you have 100 independent temperature measurements, each with a standard uncertainty of ±1°C. If their measurement errors are independent and have zero mean, the standard uncertainty of their arithmetic average is: u=1/√100 = 0.1C.”

This applies ONLY to measurements taken of the same thing under repeatable conditions, i.e. same instrument, same environment, and taken over a short period of time. Nor do you even understand what “zero mean” implies. It means you assume the distribution is random, GAussian, and the +/- values cancel. The EXACT same thing you deny you assume!

It’s the common justification thrown out by climate science by those who have *NO* basic understanding of metrology.

What you are describing is SAMPLING uncertainty. When you divide by √100 you are calculating an estimate of how closely you have calculated the data average. If the data is inaccurate then it doesn’t matter how closely you can calculate the average IT WILL BE INACCURATE AS WELL!

As I keep telling you, you cannot generate accurate results from inaccurate data.

Your example simply doesn’t apply for the GAT. It consists of measurement data taken from different things using different instruments under different environments at different times.

In that case the measurement uncertainties ADD. The worst case is no cancellation of random factors – a straight addition. +/- 100C. If you assume some cancellation then the best case is 1*√100 = 1 * 10 = +/- 10C.

So the interval of reasonable values that could be attributed to the mean for a temperature of 20C would range from 10C to 30C. You can’t even distinguish differences between the mean and a specific measurement (i.e. an anomaly) in the UNITS digit, let alone the hundredths digit.

There is a REASON why climate science assumes all measurement uncertainty is random, Gaussian, and cancels.

Reply to  Tim Gorman
October 22, 2026 7:41 am

There is a REASON why climate science assumes all measurement uncertainty is random, Gaussian, and cancels.

And just like bellman, this guy claims he doesn’t, then skips ahead to use cancellation to “prove” his tiny numbers.

Reply to  Tim Gorman
October 22, 2026 10:04 am

“Nope. It’s the consequence you must accept of saying that measurement uncertainty of an average is less than the individual measurement uncertainties. You can run but you can’t hide!”

Yep, that was a strawman of yours, which you’ve just confirmed. I said that the uncertainty of a global average is not the same as the uncertainty of an individual measurement. That statement does not assume that uncertainties are necessarily random, Gaussian, or cancel through averaging.

“The measurement uncertainty of the global average is the propagated measurement uncertainties of the individual measurements.”

You should redirect this criticism toward Jim Gorman.

Jim Gorman was replying to a post of mine discussing global average temperatures when he wrote:

“Measurements are stated as: value ± uncertainty.”

As if that somehow refuted my argument about global average temperatures.

“This applies ONLY to measurements taken of the same thing under repeatable conditions, i.e. same instrument, same environment, and taken over a short period of time. Nor do you even understand what “zero mean” implies. It means you assume the distribution is random, GAussian, and the +/- values cancel. The EXACT same thing you deny you assume!”

Okay, so you’ve now acknowledged circumstances in which the uncertainty of an average can be smaller than the uncertainties of the individual measurements.

That contradicts your earlier categorical claim that uncertainties always add.

My example was intended to disprove that generalization, not to establish the actual uncertainty of global average temperature.

“The worst case is no cancellation of random factors – a straight addition. +/- 100C.”

We’re calculating an average temperature, not a sum.

You have to divide by 100 when calculating the average.

Reply to  Eldrosion
October 22, 2026 10:48 am

Okay, so you’ve now acknowledged circumstances in which the uncertainty of an average can be smaller than the uncertainties of the individual measurements.

You are dancing around while ignoring the requirements that are required to be met for the uncertainty of an average to be smaller than the uncertainties of the individual measurements.

That contradicts your earlier categorical claim that uncertainties always add.

You ignored the requirement that,

“This applies ONLY to measurements taken of the same thing under repeatable conditions, i.e. same instrument, same environment, and taken over a short period of time.

Uncertainties of different input quantities ALWAYS add. You are mixing up observations of a single input quantity with different input quantities.

If I have a temperature from Miami and one from Kansas City, those are two different input quantities. The each have a value and a measurement uncertainty. The uncertainties add, perhaps in quadrature, or perhaps directly.

A Type A evaluation of an input quantity always assumes that each observation of that measurand has a value and is 100% accurate. A mean and standard deviation is derived from the observations and provide a best estimate along with the dispersion of values that can be attributed to the mean.

When various input quantities are put into a functional relationship to calculate a measurands value, the uncertainties of the input quantities ADD.

You are just throwing out examples without any idea of what the end result is. You are not providing any metrology resources that support your assertions. Try making some cogent arguments supported with measurements, otherwise your arguments are meritless.

Reply to  Eldrosion
October 22, 2026 12:50 pm

We’re calculating an average temperature, not a sum.

You have to divide by 100 when calculating the average.

Been through this before. You have no idea what a functional relationship is do you? Look through the GUM and find an example where a functional relationship is defined as an average.

I will bet you won’t find one. The GUM defines a functional relationship as a function of input quantities. f(X1, X2, …, Xn). Each Xn is a separate and unique input quantity subject to measurement and uncertainty. The uncertainty values of each input quantity are added to determine the combined uncertainty. See Section 5 in the GUM.

Tell me, do you have any metrology books at all? You sound like you have had stats 101 and that is all.

Reply to  Eldrosion
October 22, 2026 7:38 am

and have zero mean

HAHAHAHAHAHAH — another “expert”.

Reply to  Eldrosion
October 22, 2026 8:51 am

Not necessarily. Say a thermometer has independent, zero-mean random errors: +0.5C, -0.3C, +0.2C, -0.4C. The errors sum to zero, even though the researcher might not know their individual values.

Lose the term error. Error is only known if you know the true value of what you are measuring. It doesn’t apply to measurements of varying things. Uncertainty was the chosen description for the new paradigm because it is description of what you don’t know. There is no way for you to know the errors you have postulated unless you also know what the temperature should have been, i.e., the true value.

Standard practice doesn’t add uncertainty arithmetically. They are standard deviations calculated from variance. You must add the variances, that is, the squared terms.

u_total² = u_1² + u_n²

You continue to insist on this false narrative. Even Pat Frank acknowledges that there are circumstances in which the uncertainty of an average can be smaller than the uncertainty of the individual measurements.

You have quoted Dr. Frank. Please show the quote where he said this. That is a sign of respect that you should observe. You should know that quoting someone as an expert without providing the quote is an argumentative fallacy of Appeal to Authority.

For example, suppose you have 100 independent temperature measurements, each with a standard uncertainty of ±1°C. If their measurement errors are independent and have zero mean, the standard uncertainty of their arithmetic average is: u=1/√100 = 0.1C.

That is only applicable in one instance. When you have measured the same thing 100 times under repeatable conditions. Then you may claim that the uncertainty of the mean is the measurement uncertainty of that one thing. The only way to do that with atmospheric temperature is to have 100 thermometers take a reading at a given time under repeatable conditions. The fact that you are not using the same device rules out repeatable conditions.

The very first thing you need to learn is that the uncertainty of the mean q̅ is the interval where the mean may lay. That is a different thing statistically from the standard deviation (uncertainty) of the observational data qₖ.

The second thing is that the experimental uncertainty of the mean requires multiple samples, each with “n” observations. This allows one to create a “sample means” distribution, that is, the mean from each sample is plotted and then calculate the standard deviation of that distribution.

The mathematical derivation of σ/√n requires several assumptions.

  • Every 𝑋𝑖𝑗​ has the same expected value μ.
  • Every 𝑋𝑖𝑗​ has the same variance 𝜎².
  • The 𝑋𝑖𝑗 are independent.
  • The measurement process is stationary, meaning μ and σ do not change from one repetition to another.

Read GUM 4.3.2 very, very carefully until you understand it. That is the section that describes the experimental uncertainty of the mean. It uses the term Xᵢ,ⱼ for a reason. It means Xᵢ random variables, each with “j” observations, where “j = n”.

Do a search in the GUM for the word “dispersion”. See if you think measurement uncertainty is the dispersion of observations surrounding the mean or if it is the dispersion of the possible values of the mean.

MarkW
Reply to  Eldrosion
October 22, 2026 1:00 pm

And once again, eld demonstrates that he knows nothing about the subjects he pontifcates about.
The only way for averaging large numbers to reduce errors is if the error distribution is gaussian.

I’d ask you to hang your head in shame, but you have demonstrated you have none.

MarkW
Reply to  Eldrosion
October 21, 2026 12:30 pm

They are all working from the same raw data using the same calibration techniques.

Reply to  MarkW
October 21, 2026 3:24 pm

“Contrary to some reports, the satellite measurements are not calibrated in any way with the global surface-based thermometer records of temperature. They instead use their own on-board precision redundant platinum resistance thermometers (PRTs) calibrated to a laboratory reference standard before launch, embedded in high-emissivity targets that are viewed by the radiometer once each scan. The radiometers also view the cosmic background radiation (assumed to be 2.7 Kelvin) once each scan. The Earth-viewing measurements are then interpolated between the cosmic background temperature and the warm calibration target temperature.”

https://www.drroyspencer.com/latest-global-temperatures/

MarkW
Reply to  Eldrosion
October 21, 2026 3:46 pm

How do they ensure that the PRTs are accurate after the satellite is launched?

Reply to  MarkW
October 22, 2026 5:19 am

They DON’T! It’s not just the PRT’s. It’s degradation in their hot source (the high emissivity target). It’s degradation in the radiometer, it doesn’t matter if it is looking at the sky as a calibration source. That doesn’t affect the calibration curve when it is looking at other sources.

“The Earth-viewing measurements are then interpolated between the cosmic background temperature and the warm calibration target temperature.””

If that calibration target degrades then the interpolation curve is affected. If the radiometer degrades then its reading of the cosmic background is affected and, therefore, the calibration curve.

This statement doesn’t even include that the satellite network is self-calibrated by comparison between the satellites. That spreads any measurement uncertainty over the whole network.

It’s all typical climate science gaslighting and garbage assumptions.

Reply to  Eldrosion
October 22, 2026 4:42 am

“Then perhaps you should explain why multiple independently developed temperature datasets, using different methodologies, manage to reproduce remarkably similar temperature histories and long-term warming trends.”

Because the algorithms used to convert radiance to temperature have FIXED parameters that force the agreement! For instance, cloud path loss in the conversion algorithm is a FIXED parameter based on the same parameter that climate models do. HUGE systematic uncertainty influence!

No one would pay any attention to either data set if they differed significantly. That’s a unstated bias that applies to any conversion algorithm.

“If measurement uncertainties really were as large as ±4°C, how do you account for that consistency across datasets?”

+/4C is not an error statement. It is an UNCERTAINTY statement. It’s a statement of the dispersion of reasonable values that can be attributed to the measurand. The dispersion is so wide that YOU DON’T KNOW if there is actually any consistency between them.

You have the very same lack of knowledge of metrology that climate science exhibits, including its supporters here on WUWT who *all* don’t understand the difference between “true value +/- error” and “stated value +/- measurement uncertainty”.

“Their agreement is hardly what one would expect if the temperature record were dominated by errors of that magnitude.” (bodling mine, tpg)

Again, it isn’t a statement of error. It’s a statement of uncertainty. It’s a description of the dispersion of reasonable values that can be attributed to the measurand.

Write that bolded part down, frame it, and post it above your computer. I doubt if you’ll understand what it means but maybe some day it will sink in.

Reply to  Tim Gorman
October 22, 2026 4:52 am

NASA GISTEMP, NOAA, HadCRUT, and Berkeley do not derive their land-temperature observations by converting satellite radiances into temperatures.

UAH and RSS, by contrast, estimate atmospheric temperatures from microwave radiances measured by satellites.

So your explanation about shared radiance conversion parameters can’t explain the agreement between surface T records and satellite T records.

Correct my metrology terminology all you like, but that doesn’t make the central issue go away.

Reply to  Eldrosion
October 22, 2026 5:40 am

“NASA GISTEMP, NOAA, HadCRUT, and Berkeley do not derive their land-temperature observations by converting satellite radiances into temperatures.”

SO WHAT?

Do you know what the measurement uncertainty is for each of these? For the umpteenth time, multiple inaccurate measurements can’t produce an accurate result.

“So your explanation about shared radiance conversion parameters can’t explain the agreement between surface T records and satellite T records.”

Really? You don’t think using a similar parametrization for clouds doesn’t force similar results?

And you continue to miss the most salient point. If you don’t know the measurement uncertainty associated with each then how do you *KNOW* they are comparable?

“UAH and RSS, by contrast, estimate atmospheric temperatures from microwave radiances measured by satellites.”

The satellites measure the radiance from broad, thick layers of the atmosphere. Thus the temperature they provide is an AVERAGE temperature for that broad, thick layer of atmosphere.

It is *NOT* the same temperature as a thermometer six feet off the ground.

If UAH and CRN match temperatures, then that is a clue that the radiance to temperature conversion algorithm is biased to *produce* a similar temperature to the surface-based measurements.

Do you even understand this simple fact?

“Correct my metrology terminology all you like, but that doesn’t make the central issue go away.”

What central issue? Whether the earth is warming or not? If yes, by how much? If no, by how much.

The central issue remains that the measurement uncertainties for ANY of the data legislate against KNOWING what is happening!

Climate science *should* be saying “WE DON’T KNOW IF THE EARTH IS WARMING, COOLING, OR STAGNATING”

In essence, you are making the same claim climate science does. “We have a magical crystal ball stored in an undisclosed underground vault that lets us peer into the Great Unknown”.

Anthony Banton
Reply to  Tim Gorman
October 22, 2026 8:40 am

“It is *NOT* the same temperature as a thermometer six feet off the ground.”

You don’t say!

“If UAH and CRN match temperatures, then that is a clue that the radiance to temperature conversion algorithm is biased to *produce* a similar temperature to the surface-based measurements.

No:

From Roy Spencer’s website:

https://www.drroyspencer.com/2010/01/how-the-uah-global-temperatures-are-produced/

HOW THE DATA ARE CALIBRATED TO TEMPERATURES
Now for the important part: How are these instrument digitized voltages calibrated in terms of temperature?

Once every Earth scan, the radiometer antenna looks at a “warm calibration target” inside the instrument whose temperature is continuously monitored with several platinum resistance thermometers (PRTs). PRTs work somewhat like a thermistor, but are more accurate and more stable. Each PRT has its own calibration curve based upon laboratory tests.

The temperature of the warm calibration target is allowed to float with the rest of the instrument, and it typically changes by several degrees during a single orbit, as the satellite travels in and out of sunlight. While this warm calibration point provides a radiometer digitized voltage measurement and the temperature that goes along with it, how do we use that information to determine what temperatures corresponds to the radiometer measurements when looking at the Earth?

A second calibration point is needed, at the cold end of the temperature scale. For that, the radiometer antenna is pointed at the cosmic background, which is assumed to radiate at 2.7 Kelvin degrees. These two calibration points are then used to interpolate to the Earth-viewing measurements, which then provides the calibrated “brightness temperatures”. This is illustrated in the following graph:

comment image

Reply to  Anthony Banton
October 22, 2026 9:17 am

From Roy Spencer’s website:

Funny how it has ~290K rather than ~290.1. Also,

The temperature of the warm calibration target is allowed to float with the rest of the instrument, and it typically changes by several degrees during a single orbit, as the satellite travels in and out of sunlight.

I don’t suppose this introduces any uncertainty at all.

You haven’t addressed the path loss systematic uncertainty at all. Neither does the diagram. Do you think atmospheric scattering and water vapor don’t contribute uncertainty. Search the UAH site and see how they account for that.

MarkW
Reply to  Eldrosion
October 21, 2026 12:29 pm

Once again, eld dismisses real data with any excuse that his little mind can think of.

Reply to  Eldrosion
October 20, 2026 4:06 pm

Why? Warming is occurring so rapidly that we may never experience the supposed benefits of this “optimal

temperature.”

Can’t answer the question so you make up some word salad?

If you have no idea what the optimum temperature is, why do you suppose it will be too hot?

The only other answer you can have is colder than it is today when you assume the current warming is too much.

Reply to  Eldrosion
October 20, 2026 4:32 pm

For someone who seems to be so focused on “quantitative analysis” and peer-reviewed B.S., you sure resort to unfounded, evidence-free subjective assertions when you’re losing the argument.

We ain’t eclipsing right past anything, and if you can’t even define an “optimum temperature threshold” then you can’t claim we’re zooming right past it.

Reply to  Eldrosion
October 21, 2026 2:47 am

YOU PUNTED!

How do you know we’ll eclipse right past the optimum if you don’t know what the optimum is?

Reply to  Tim Gorman
October 21, 2026 3:45 am

It’s like the story of that supreme court judge (don’t know the name and too lazy to look it up) when discussing pornography: “I can’t define it, but I know it when I see it.” He’ll know what the optimum is when we zoom past it.

juanslayton
Reply to  Phil R
October 21, 2026 4:23 am

I think that was Justice Potter.

Reply to  juanslayton
October 21, 2026 5:00 am

Thanks. Olderosion wasn’t worth the time to look up. 🙂

Reply to  Tim Gorman
October 21, 2026 7:58 am

Because you can look at data:

comment image

Reply to  Eldrosion
October 21, 2026 8:50 am

Looks suspiciously like the fraudulent 2020 voter data.

Reply to  Phil R
October 21, 2026 9:14 am

Thanks for reminding the lurkers that I’m arguing with cranks, Phil. Should do wonders for my credibility.

Sparta Nova 4
Reply to  Eldrosion
October 22, 2026 1:06 pm

Your credibility, self-destroyed, is so far gone it is likely it can never be revived.

Reply to  Sparta Nova 4
October 22, 2026 1:46 pm

Splendid. The catnip worked!

MarkW
Reply to  Eldrosion
October 21, 2026 12:32 pm

Splicing thermometer data onto imaginary data.

Sparta Nova 4
Reply to  Eldrosion
October 22, 2026 7:14 am

Anomalies are not data. They are numerical calculations.

Reply to  Eldrosion
October 21, 2026 9:00 am

So, Gore was right- the oceans will soon be boiling? And the whole planet will burn up? Oh, and the sea will rise and all the big cities on the coasts will be destroyed? OMG! 🙂

Reply to  Eldrosion
October 22, 2026 10:17 am

You never answered my question about an optimal temperature except for reiterating that the current temperature is bad. That must mean cooling from the current temperature is good.

What exactly cooler temperature should we be rooting for? Will that cooler temperature be good for all life on the planet?

Reply to  Jim Gorman
October 21, 2026 5:11 am

And, the older you get, the less you like the cold.

Reply to  Joseph Zorzin
October 22, 2026 1:42 pm

You are correct about that. Warmer winters and nights have helped with that. The older I get the more I hate going out in the cold to collect eggs and feed the cows and pigs. I have water heaters so I don’t have to chop ice!

MarkW
Reply to  Eldrosion
October 20, 2026 1:41 pm

Your statement is based on fantasy and delusion.

Reply to  Eldrosion
October 20, 2026 2:02 pm

The data does not support your “statement.”

MarkW
Reply to  Phil R
October 20, 2026 3:58 pm

But his statement does support the party.

Reply to  MarkW
October 21, 2026 4:49 am

Da, comrade.

Reply to  Eldrosion
October 21, 2026 2:45 am

What the data shows is the reason behind the growth in grain harvests in CONUS as well as globally.

You would rather see starvation?

CONUS corn harvests per acre have doubled since 1980. Same for soybeans. Wheat has only grown by 80%. While seed advances is part of this as well as Ag farming methods and procedures it is ALSO due to better growing weather!

Can *YOU* tell the difference between 90F and 94F when outside? Can you tell the difference between 35F and 38F when outside?

Apparently grain can!

And grain LIKES the change!

MarkW
Reply to  Tim Gorman
October 21, 2026 6:24 am

Plants grow faster when it’s warmer, also, adding a few days to the growing season means that more acres can be planted.

Reply to  MarkW
October 21, 2026 12:43 pm

Less killing frosts too, thanks to most of the “warming” being “doesn’t get as cold at night.”

Reply to  AGW is Not Science
October 22, 2026 6:25 am

The one issue I see is that a later first frost date can sometimes affect being able to get soybean harvests in if the ground is too wet. You have to wait for the ground to dry (slow) or freeze. It typically doesn’t affect bushels/acre but would affect the timing.

Reply to  Eldrosion
October 20, 2026 12:11 pm

I worked outdoors as a forester for exactly 50 years. I suggest, overall, the weather is improved. A few more very hot days, otherwise nicer weather- longer growing seasons- people in the colder parts of the planet aren’t going to whine about too much hot weather. Isn’t it amazing all the folks in the northern parts of America and Canada can’t wait in retirement to move to the Sun belt? Especially really hot areas like AZ and FL.

Reply to  Joseph Zorzin
October 20, 2026 12:27 pm

https://tamino.wordpress.com/2026/06/28/not-just-another-summer/

comment image

Some people aren’t nearly so fortunate when it comes to warmer weather. Europe’s summer heatwave this year was associated with thousands of excess deaths. People were even drowning while seeking relief from the heat.

A longer growing season might sound nice, but that doesn’t mean warmer weather is universally beneficial.

Your personal experience as a forester doesn’t negate the broader evidence of heat related harm.

Reply to  Eldrosion
October 20, 2026 1:05 pm

8 days of hot weather is bad? I’ll bet you never worked outside in construction, farming, road repair, or other manual labor job have you? The number of hot days here in Kansas are not dramatically different than when I grew up doing that work. We haven’t broken a record yet.

MarkW
Reply to  Eldrosion
October 20, 2026 1:43 pm

11 “hot” days. Be still my beating heart.

Reply to  MarkW
October 20, 2026 2:02 pm

Yes, and those 11 hot days in Europe in 2003 were associated with a devastating wave of death and human suffering.

See: Bodies unclaimed in France’s heat

Repeat after me:

LOSS-OF-LIFE!

LOSS-OF-LIFE!

LOSS-OF-LIFE!

Reply to  Eldrosion
October 20, 2026 2:05 pm

Repeat after me:

AIR-CONDTIONING!

AIR-CONDTIONING!

AIR-CONDTIONING!

C_Miner
Reply to  Phil R
October 20, 2026 4:15 pm

Dependable electricity is needed for that. Which is why new-dark-ages Europe is trying to ban personal use of it.

Reply to  C_Miner
October 20, 2026 6:50 pm

Dark Ages… plus increasingly dangerous heat waves.
Geez…

MarkW
Reply to  Eldrosion
October 20, 2026 9:34 pm

And as usual, when the real data doesn’t support his fantasies, eld just makes it up.
If you bother to look at records that are older than 50 years, you will find that there is nothing unusual about any of the current heat waves.

Reply to  Phil R
October 20, 2026 7:14 pm

“AIR-CONDTIONING!”

was not needed in Europe until recently.

MarkW
Reply to  Eldrosion
October 20, 2026 9:35 pm

Are you paid to make climanistas sound stupid?
Paris is famous for heat waves about every 10 to 15 years going back well over a century.

Reply to  MarkW
October 20, 2026 9:44 pm

Google is your friend:

“Air conditioning was rare in Europe because the climate was historically mild, and buildings used thick walls, shutters, and natural ventilation to stay cool. Today, only about 20% of European homes have air conditioning, compared to roughly 90% in the United States. [1, 2, 3]

Why Air Conditioning Was Not Needed
Mild Climate: Northern and central regions experienced only short, manageable warm spells each summer.Passive Architecture: Traditional homes used thick stone walls, exterior shutters, high ceilings, and shaded courtyards to block heat.Cultural Habits: Europeans traditionally relied on opening windows at night and closing them during the day rather than running mechanical systems. [1, 2, 3, 4, 5]

Why Europe is Changing Now
Intense Heat Waves: Climate change has made extreme summer heat waves longer, earlier, and more deadly across the continent. [1, 2]Modern Building Traps: Newer glass-heavy high-rises and poorly insulated or historic zinc-roofed apartments act like ovens and trap heat. [1]Rising Adoption: Sales of portable units and split-system heat pumps are climbing, with ownership reaching around 56% in Italy and rising sharply in places like the UK and Germany despite high electricity costs and carbon concerns. [1, 2, 3, 4, 5]”

MarkW
Reply to  Eldrosion
October 21, 2026 6:26 am

And once again, eld demonstrated just how shallow his thinking is.
To support his claim that there were never heat spikes in Europe prior to the modern era, he pulls up an article that talks about average temperatures.
What a maroon.

Reply to  MarkW
October 21, 2026 7:58 am

An article? This is a Google AI summary.

And you’re now deflecting.

MarkW
Reply to  Eldrosion
October 21, 2026 12:34 pm

I’m guessing eld is actually stupid enough to believe that the AI has gone back to original research material.

Reply to  MarkW
October 22, 2026 1:44 pm

I have CoPilot set up with a constant instruction to always provide the resources from which it draws information. Sometimes we have to fight about the interpretation of the information. Stimulating.

Ruhaan Pilani
Reply to  MarkW
October 21, 2026 7:20 pm

Here in California, we regularly break temperature records during summers. It isn’t a heatwave for us. It’s a heatseason, with electricity prices skyrocketing way beyond average in summer months. This hasn’t been happening forever. multi-century old heat records are being broken, not year-old one.s

MarkW
Reply to  Ruhaan Pilani
October 22, 2026 1:05 pm

Are you forgetting to account for UHI?

Reply to  Eldrosion
October 21, 2026 3:51 am

Dumbass. Air conditioning is never “”needed.” Cultures learned how to survive in hot, dry deserts for thousands of years without air conditioning. Europeans could, too. Just put a fan on a bowl of ice and sit in front of it. Air conditioning makes modern living more comfortable and really only saves lives on the margins. Gas, oil and coal heat save significantly more lives than A.C.

Mario Barbafiera
Reply to  Eldrosion
October 20, 2026 3:48 pm

El Ninos?

Reply to  Mario Barbafiera
October 20, 2026 6:33 pm
MarkW
Reply to  Eldrosion
October 20, 2026 4:00 pm

Those hot days were well within the range of normal for that region and CO2 had nothing to do with it.
Regardless, the solution is to allow air conditioning, something your co-religionists have fought at every turn.

Reply to  MarkW
October 20, 2026 6:32 pm

“Those hot days were well within the range of normal for that region.”

5.4 standard deviations above average.

Quite warm — to call that an outlier would be an understatement.

https://www.met.reading.ac.uk/~vidale/papers/SchaerEtAl2004.pdf

“CO2 had nothing to do with it.”

Sure, it doesn’t…

MarkW
Reply to  Eldrosion
October 20, 2026 9:36 pm

That’s only true if you use the last decade or so as your sample period. Go back several hundred and you get a completely different result.

Reply to  MarkW
October 20, 2026 9:42 pm
Reply to  Eldrosion
October 21, 2026 11:16 am

5.4 standard deviations above average.

Really? Why don’t you give us the mean and standard deviation of the temperatures you calculated that from. Show us or give a link to the data you used.

Reply to  Eldrosion
October 21, 2026 3:57 pm

No wonder you couldn’t give an answer. The first thing I see is that they are using Gaussian distributions in Figure 1 when the distribution of the data is obviously not normal.

Do you ever wonder why some of us say that climate science believes errors are random, Gaussian, and cancels?

The study even says,

Such extreme values (which indeed have the characteristics of outliers) pose serious challenges to any analysis, as the statistical distribution so far away from the mean is not described by the data.

(underlined by me)

The fact that 2003 is an outlier should indicate to you that something other than normal CO2, weather, etc. caused this.

You do realize that 2003 is 23 years in the past right? Even before USCRN came on line. a

Reply to  Jim Gorman
October 21, 2026 7:28 pm

“The fact that 2003 is an outlier should indicate to you that something other than normal CO2, weather, etc. caused this.”

Yes, their paper suggests that changes in temperature variability, potentially amplified by drought and soil moisture feedbacks, could also play an important role. Shift mean temperature alone is insufficient, you are right.

“You do realize that 2003 is 23 years in the past right? Even before USCRN came on line.”

What does US Climate Reference Network have to do with European heat waves?

Reply to  Eldrosion
October 21, 2026 5:03 am

Loss-of-cheap electricity! That could cheaply run AC.

Reply to  Eldrosion
October 21, 2026 5:02 am

You can buy a cheap air conditioner for $100 at Walmart. Nobody should die from too much heat. Of course with the far higher electricity cost in Europe due to ruinables, running it won’t be as cheap as in North America.

Anthony Banton
Reply to  Joseph Zorzin
October 21, 2026 8:42 am

“You can buy a cheap air conditioner for $100 at Walmart”

Which would be absolutely useless in the UK, in our brick houes, soaking up the sun by day and losing litte heat overnight in summer.
I have just committed to spending over £4k on a 7KW system that would be nesessary considering my due south facing attitude. This for just for 2 rooms comprising 58 m^2.

Reply to  Anthony Banton
October 21, 2026 9:05 am

Now don’t say you can’t insulate your house somewhat if not totally like a new home built in America- starting with your windows and doors and attic. I presume there must be some way to insulate the walls- though of course it’ll be expensive. If less money was spent on ruinables and grid upgrades- more would be available for insulating homes.

Anthony Banton
Reply to  Joseph Zorzin
October 22, 2026 10:03 am

I have loft and wall insulation and double-glazed windows throughout.
But they keep heat in and brick acts like a storage radiator in hot weather whch no amount of insulation keeps out, especially as the long lounge and bedroom wall faces directly south.

Reply to  Eldrosion
October 21, 2026 12:45 pm

“Broader evidence” like the number of hot days in a single area? 🤣😂😆

Reply to  AGW is Not Science
October 21, 2026 2:42 pm

No, broader evidence as in observations of increasing heat extremes across most land regions globally.

The IPCC AR6 Working Group I, Chapter 11, concluded that increases in the frequency and intensity of hot extremes since 1950 are virtually certain on the global scale, with more than 80% of assessed regions exhibiting similar changes.

So we’re not talking about the number of hot days in one particular location.
https://www.ipcc.ch/report/ar6/wg1/chapter/chapter-11/

MarkW
Reply to  Eldrosion
October 21, 2026 3:48 pm

Except for the fact that these heat “extremes” are not extreme. The records show that they have happened before, many times.

Reply to  MarkW
October 22, 2026 7:08 am

For erosion, history started somewhere around the time he turned 13.

Reply to  Joseph Zorzin
October 20, 2026 5:26 pm

B I N G O !

1. More rain is not a problem.
2. Warmer weather is not a problem.
3. More arable land is not a problem.
4. Longer growing seasons is not a problem.
5. CO2 greening of the earth is not a problem.
6. There isn’t any Climate Crisis.

Reply to  Steve Case
October 21, 2026 1:15 pm

Wailing about the number of “heat related deaths” while ignoring the nine times as many “cold related deaths” that aren’t happening thanks to the WARMER, and BETTER climate.

Mr.
Reply to  Eldrosion
October 20, 2026 1:39 pm

What’s the “scientific” metric that determines what “comfortable, warm weather” is?

(is it based on what “the average person” thinks on an “average day”? 🙂 )

MarkW
Reply to  Eldrosion
October 20, 2026 1:40 pm

If the total warming is small, and most of it is occuring in winter and at night, where’s this great heat that trouble your feeble mind?

Reply to  Eldrosion
October 20, 2026 2:01 pm

I may get censored for this but that is a flat-out lie. First, you don’t know that but are making a definitive statement on truth with no evidence. second,”hot” and “comfortable” are relative and subjective terms. Hot to an Eskim… er, Native Indigenous Alaskan may be absolutely frigid to a Native Indigenous Hawaiian Islander.

Reply to  Phil R
October 20, 2026 2:09 pm

You’re right you may get censored.

Reply to  Eldrosion
October 20, 2026 4:35 pm

Haven’t so far. Guess my assessment was pretty accurate.

Reply to  Phil R
October 20, 2026 6:42 pm

I posted evidence here, Phil. Let’s see if you can find it.

Reply to  Eldrosion
October 21, 2026 8:08 am

It’s not whether I can find it (HINT: I can). It’s whether you can interpret it correctly (HINT: you can’t).

Reply to  Phil R
October 21, 2026 8:11 am

If you say so, Phil.

MarkW
Reply to  Eldrosion
October 21, 2026 12:35 pm

No need to say so, all we need to do is read your posts.

Sweet Old Bob
Reply to  Phil R
October 20, 2026 2:45 pm

” Hot to an Eskim… er, Native Indigenous Alaskan may be absolutely frigid to a Native Indigenous Hawaiian Islander.”

Yes!

Reached 50 F once while I lived there .

Locals were wearing winter parkas …

😉

Sparta Nova 4
Reply to  Sweet Old Bob
October 21, 2026 6:25 am

A few years back I was deployed to Kauai.
Temperature of 76 F and people were wearing down parkas.
An astonishing demonstration of human acclimation.

Bruce Cobb
Reply to  Eldrosion
October 20, 2026 12:00 pm

Miss the point much?

MarkW
Reply to  Bruce Cobb
October 20, 2026 1:44 pm

That’s not missing, that’s blatant dodging.

Reply to  Eldrosion
October 20, 2026 12:43 pm

And really cold winters, too. The 1930s in the CONUS weren’t actually all that hot:

Lots of people will disagree with you on that one.

Look real closely at 1980. See that step in temperatures? Do you have an idea what might have caused that? I’ll wait to see if you have an idea.

Reply to  Jim Gorman
October 20, 2026 2:07 pm

a warm winter occurring against the backdrop of a long term warming trend.

Reply to  Eldrosion
October 20, 2026 3:51 pm

You don’t know when MMTS stations started do you?
https://r.bing.com/rp/KNV36Olt8iPjvcwMIsg4iysSZLc.svg

Maximum-Minimum Temperature System (MMTS) station went online in 1984, as part of the nationwide rollout of electronic temperature sensors with beehive shelters.

Is it possible the reading changed due to different devices and housings?

Reply to  Jim Gorman
October 20, 2026 7:29 pm

Transition to MMTS introduced artificial cooling in TMAX and artificial warming in TMIN.

These opposing biases largely cancel when calculating mean temperature.

Furthermore:

“Adjustments applied to USHCN Version 2 data largely account for the impact of instrument and siting changes, although a small overall residual negative (“cool”) bias appears to remain in the adjusted maximum temperature series. Nevertheless, the adjusted USHCN temperatures are extremely well aligned with recent measurements from instruments whose exposure characteristics meet the highest standards for climate monitoring.”

https://www.ncei.noaa.gov/pub/data/ushcn/papers/menne-etal2010.pdf

Sparta Nova 4
Reply to  Eldrosion
October 21, 2026 6:31 am

Largely cancel
In other words the posted “mean temperatures” are not accurately representing the environment.

Mean temperature.

(Tmax+Tmin)/2 is not the mean. It is the midpoint between the upper and lower data values (aka boundaries or limits).

It is a flawed metric due to unstated assumptions.

First assumption is the piecewise linear extrapolations embedded in the concept do not represent the full 24-hour cycle.

Second assumption is the temperature at t+24 hours is exactly the same as the temperature at t=0 hours.

Reply to  Sparta Nova 4
October 21, 2026 7:24 am

It’s even worse than that. Temperature is *NOT* a metric for climate. Using Tmid makes it worse since it doesn’t distinguish impact of the temperature variation.

The daytime sinusoid and the nighttime exponential decay is *NOT* linear.

If climate science would join the rest of science in at least using cooling/heating degree days they would have an extensive value they could actually add and subtract.

Climate science is EXACTLY like Teyve in “Fiddler on the Roof”. Tradition is a practical mechanism for maintaining continuity. Teyve found out that doesn’t work very well. Climate science hasn’t figured that out yet.

Sparta Nova 4
Reply to  Tim Gorman
October 21, 2026 9:07 am

Tim, I purposefully avoided all those valid points.

My point is the math being used is flawed by 2 assumptions as stated. This adds to your points.

Correction on first assumption.
First assumption is the piecewise linear extrapolations embedded in the concept accurately represents the full 24-hour cycle.

I apologize for that error.

Reply to  Sparta Nova 4
October 21, 2026 8:02 am

You should direct your concerns to Anthony Watts. He posts the mean temperature departure for USCRN in the right-hand sidebar of this website.

https://wattsupwiththat.com/u-s-surface-temperature/

Sparta Nova 4
Reply to  Eldrosion
October 21, 2026 9:07 am

You should take a long walk off a short pier.

Reply to  Eldrosion
October 21, 2026 9:14 am

He posts that data so it can be used, including for criticism on the methodology and practices used to generate it. All you are advocating for here is self-censorship. Wouldn’t that be nice – just make it all disappear!

Reply to  Tim Gorman
October 21, 2026 9:17 am

He posts it because he supports the data and considers it reliable:

“The graph shows the Average Surface Temperature Anomaly for the contiguous United States since 2005. The data comes from the U.S. Climate Reference Network (USCRN) which is a properly sited (away from human influences and infrastructure) and state-of-the-art weather network consisting of 114 stations in the USA. 
These station locations were chosen to avoid warm biases from Urban Heat Islands (UHI) effects…”

Reply to  Eldrosion
October 21, 2026 9:33 am

ROFL! I’m pretty sure Anthony doesn’t consider *any* temperature data from the government today to be “reliable”. Not even CRN.

Reply to  Tim Gorman
October 21, 2026 9:37 am
Reply to  Eldrosion
October 21, 2026 9:44 am

From the link:

“These station locations were chosen to avoid warm biases from Urban Heat Islands (UHI) effects as well as microsite effects as documented in the 2022 report Corrupted Climate Stations: The Official U.S. Surface Temperature Record Remains Fatally Flawed.”

The sites were chosen correctly initially. I’ve already posted that in another message. The routine maintenance documentation never mentions *keeping* those sites clean of microclimate systematic effects.

The problem is that its been 20 years or more and at least some of the sites have *NOT* been kept “clean” from microclimate systematic effects.

Reply to  Tim Gorman
October 21, 2026 11:20 am

“The problem is that its been 20 years or more and at least some of the sites have *NOT* been kept “clean” from microclimate systematic effects.”

Citation needed.

MarkW
Reply to  Eldrosion
October 21, 2026 12:40 pm

We already have evidence that in the past, proper maintenance was not done for almost all of the network.
If you think they were properly maintained, find the evidence to support your conclusion.

In most studies, one is required to include in the data, evidence that your instruments were properly installed and maintained. Absence of such evidence, in any other field, would be sufficient to cause the automatic rejection of your paper.

Reply to  MarkW
October 21, 2026 2:36 pm

You’re discussing a different network than CRN.

MarkW
Reply to  Eldrosion
October 21, 2026 3:49 pm

The issue is the same for all the networks.

Reply to  MarkW
October 22, 2026 6:20 am

NONE of the networks that I have looked at have *any* requirements for routine maintenance of the microclimate. It’s simply beyond imagination that it has been done over the past 20 years at each and every CRN station.

Here’s a short comparison for 7am, 10/22 this morning. Topeka Forbes AFB = 53F, Manhattan airport = 57F, Manhattan CRN station = 50F

My Davis Vantage Vue station in a rural location shows 47F. Dead calm this morning so wind shouldn’t be an issue.

Now, which one is correct? These are all in a 50 mile radius. Kind of makes you wonder how infilling and homogenization works, doesn’t it?

I simply don’t have the time to do an extensive analysis but this one data point is indicative of *something*. I suspect the airport sites are probably more well maintained than the CRN site that is in a native prairie grass preserve. But it would need some extensive analysis to try and find out what the variances are for the data at each location.

Reply to  Tim Gorman
October 22, 2026 6:31 am

> I simply don’t have the time to do an extensive analysis but

There is this one weird trick that could give you a lot more time.

Reply to  Eldrosion
October 22, 2026 5:58 am

“Citation needed.”

I’ve given you the citations. You have to go read them. I can’t do it for you.

The fact that microclimate maintenance is in NONE of the maintenance documents is telling.

You want us to believe that over a 20 year span that routine maintenance that is *NOT* specified to be done in the controlling documents, HAS BEEN DONE.

If that is what you are claiming, then it is up to you to provide the citations showing that it has been done!

If you look up the CRN station for Manhattan, KS you will see that it is only 20m from a dirt road and 15m from the closest structure. Those are probably not major influences but they *can” influence temperature measurements in the hundredths digit!

Ask Anthony if he believes the CRN stations provide resolution to the hundredths digit of temperature.

Sparta Nova 4
Reply to  Tim Gorman
October 22, 2026 7:22 am

All Eldrosion is doing is trying to control the discussion.
He deflects with red herrings when he sees a benefit to his sophistry then demands narrow specifics, again when he sees a benefit to his sophiistry.

MarkW
Reply to  Tim Gorman
October 22, 2026 1:09 pm

It is up to the person providing and using the data to prove that it is valid. It is never the responsibility of others to prove is your data invalid.

Which has been done. Time and again.

MarkW
Reply to  Eldrosion
October 20, 2026 4:02 pm

A warming trend that started almost 100 years before any significant increase in CO2 levels.
A warming trend that interrupted a cooling trend that has been continuing for the last 5000 years.

J Boles
Reply to  Eldrosion
October 20, 2026 1:11 pm

Well then you ought to stop using fossil fuels every minute of every day, you flaming HYPOCRITE. Stop using FF and no more heating or lights or travel (walking is okay).

MarkW
Reply to  J Boles
October 20, 2026 4:03 pm

That’s one constant with those on the left, the hardships they dream of, are always for other people.

Reply to  J Boles
October 21, 2026 1:20 pm

No more internet use either. 🫢

Reply to  J Boles
October 22, 2026 6:24 am

Never gets old:

https://thenib.com/mister-gotcha/

Ten years. Time flies like an arrow. Contrarians like to go bananas.

Sweet Old Bob
Reply to  Eldrosion
October 20, 2026 3:36 pm

” The 1930s in the CONUS weren’t actually all that hot”

Really ?

Where in Kansas has it hit 121 F lately ?

It did in 1936 ….

Reply to  Sweet Old Bob
October 20, 2026 6:36 pm

Summer 1936 was quite hot across the central U.S. Plains, but conditions elsewhere were unremarkable.

comment image

https://en.wikipedia.org/wiki/1936_North_American_heat_wave

MarkW
Reply to  Eldrosion
October 20, 2026 9:38 pm

Wikipedia, might as well cite Dr. Sues.

Reply to  MarkW
October 20, 2026 9:58 pm

It might be outdated.

Those above-average values likely aren’t above average anymore, given the warmer baseline today.

Sweet Old Bob
Reply to  Eldrosion
October 21, 2026 5:32 am

So …. where in Kansas has it reached 121 F in the last 20 years ?

NOWHERE !

Scissor
Reply to  Eldrosion
October 20, 2026 4:23 pm

1978 was worse.

Reply to  Eldrosion
October 20, 2026 5:39 pm

You know, if you’re interested in how hot it got, then you should look at the time of year that it gets hot, and that would not be the winters. June July and August would fill that bill. Hot off the press, here’s what NOAA’s Climate At a Glance says:

comment image

Reply to  Steve Case
October 20, 2026 6:37 pm

JJA TMIN:

comment image

Reply to  Eldrosion
October 21, 2026 12:37 am

A [Ctrl-F] search on “average” comes up 12/19 from your posts (so far) and you’re right the warmer winters run up the average temperature. The IPCC tells us:

IPCC AR4 Chapter Ten page 750

       “Almost everywhere, daily minimum temperatures are projected
       to increase faster than daily maximum temperatures, leading to
       a decrease in diurnal temperature range. Decreases in frost days
       are projected to occur almost everywhere in the middle and high
       latitudes, with a comparable increase in growing season length.”

In deed, the issue has always been high temperature right from the beginning in Dr. James Hansen’s 1988 testimony, Al Gore’s movie, and every news media article from ABC, CBS, CNN, NBC, NPR, PBS. New York Times, Washington Post . . . etc. (It’s a long list) for the last 38 years, goes on and on about hotter weather “the planet has a fever” illustrated with dry cracked river beds.

You are pointing out that warmer winters run up the average temperatures. Averages are misleading:

       The average of 49 and 51 is 50 and
       the average of 1 and 99 is also 50.

If that’s confusing to you:

       “Beware of averages. The average person has one breast and one testicle.”
                                                                                             Dixie Lee Ray 1991

Reply to  Steve Case
October 21, 2026 8:23 pm

“In deed, the issue has always been high temperature right from the beginning in Dr. James Hansen’s 1988 testimony, Al Gore’s movie, and every news media article from ABC, CBS, CNN, NBC, NPR, PBS. New York Times, Washington Post . . . etc. (“

The human body needs opportunities to cool down and recover from daytime heat exposure. When nighttime temperatures remain elevated, particularly during summer and in combination with high humidity, the body has a harder time shedding accumulated heat and recovering.

So the fact that minimum temperatures are increasing faster than maximum temperatures is hardly a reason to dismiss the consequences of rising nighttime temperatures.

Reply to  Eldrosion
October 22, 2026 7:15 am

It’s called CLOTHES. When you are warm you shed clothing. When you need to cool at night, YOU SHED CLOTHES.

Do you even know what a main boundary condition for Tmin is?

Reply to  Eldrosion
October 22, 2026 11:10 am

The human body needs opportunities to cool down and recover from daytime heat exposure. When nighttime temperatures remain elevated, particularly during summer and in combination with high humidity, the body has a harder time shedding accumulated heat and recovering.

You made that up didn’t you.

Reply to  Eldrosion
October 21, 2026 5:08 am

to paraphrase Inigo Montoya, “I don’t think your graph shows what you think it shows.” All your stupid cherry-picked graphs of winter min temps only confirm what everyone else has been pointing out. that most of the warming is in the winter temps, minimum temps and polar temps. tmax summer temps not so much. but then again you can hide a lot of negative evidence in averages.

Reply to  Phil R
October 21, 2026 6:12 am

Tmax has a natural boundary condition – T^4 grows faster than T. Minimum temps not so much. The issue becomes *why* are minimum temps going up – something climate science refuses to address. Cause and effect. It does no good to focus on effect while ignoring the cause.

The normal assumption would be that higher minimums would actually result in greater heat loss to space but climate science tells us that OLR is decreasing meaning there is retained heat. It’s the justification for the greenhouse theory.

What they neglect to point out is that it is decreasing AT CO2 FREQUENCY. Any reflected heat from CO2 gets re-emitted by the earth but it is spread across the entire broad spectrum of the earth’s Planck radiation. And because of measurement uncertainty and resolution it’s impossible to identify an increase at any specific frequency let alone in the entire spectrum.

So, once again, we are back to measurement uncertainty limiting our ability to KNOW for certain what is going on. Climate science *should* be telling the public “WE DON’T KNOW” rather than “the earth is burning up”.

Reply to  Tim Gorman
October 21, 2026 8:11 am

Can’t generate a lot of money and hysteria with “WE DON’T KNOW.”

Reply to  Phil R
October 22, 2026 5:54 am

> cherry-picked

You keep using that word, Phil.

It might not mean what you make it mean.

For a guy who plays dumb about so many things, you seem to be quite confident that 2C isn’t a lot.

Reply to  Willard
October 22, 2026 10:44 am

You seem to be quite confident that 2C, a number with no scientific basis and that was pulled out of some guy’s a$$ just because they needed a number to scare people with, is a lot.

Anthony Banton
Reply to  Tim Gorman
October 22, 2026 10:21 am

Like I’ve been known to say Tim:
You can be remarkably obtuse and muddled over your science.
Especially with meteorology (not that that is unusual here).

“The issue becomes *why* are minimum temps going up – something climate science refuses to address.”

It’s basic meteorology…..

comment image

“The normal assumption would be that higher minimums would actually result in greater heat loss to space but climate science tells us that OLR is decreasing meaning there is retained heat. It’s the justification for the greenhouse theory.”

No, the lower night minima are as a general rule from nights where a strong low-level nocturnal inversion has formed and mixing through the LYR under it causes the higher temp than if there were no inversion.

“Tmax has a natural boundary condition – T^4 grows faster than T.”

Yes, and it also means that Tmax has a more rigid BC, as when temps rise towards a daily max then the air cools more readily.
ALso max temps get distributed vertically by themals (diagram)

“it is spread across the entire broad spectrum of the earth’s Planck radiation. “

You have that correct – just that in order to radiate on those other spectra the air needs to cool from it’s global average of ~ 15C.
And that is a retardation in itself, involving movement (vertical and lateral).

Reply to  Anthony Banton
October 22, 2026 1:19 pm

Have you ever wondered why the soil surface temperature is always higher until the early morning hours? I suspect cooling air and water vapor condensing have something to do with it rather than a temperature inversion caused by GHG’s.
comment image

Some big gradients in the soil.
comment image

I’ll bet water vapor has something to do with keeping enthalpy high overnight even with decreasing surface temperature.
comment image

Here is an interesting graph illustrating why additional warmth is important for crops in a the temperate zones. I wonder how the Climatological Growing Season has gotten worse with the forecasts of pending crop failures!
comment image

antigtiff
Reply to  Eldrosion
October 20, 2026 6:28 pm

Note that from 1940 to 1980 the red line would be slightly negative while CO2 went up 15%. The world still awaits an explanation……waiting…..

Anthony Banton
Reply to  antigtiff
October 21, 2026 6:21 am

OK: I’ll end your wait.

First the CONUS is not the world. Yes, there are regional differences across the globe and the CONUS is just 1.6% of the world’s surface area.

The US is prone to more Arctic air-masses due the Rockies deflecting the PJS south and draging cold air over the eastern half in particular.

The US had a thing called the “Dust Bowl” which occured due to the persistence of an El Nino state and a +ve AMO. But disasterously via the farming practices of the mid-west. This caused a feedback of persistent HP and drought/heat.

The radiative forcing of CO2/WV back then was small (~1 W/m^2) and was largely offset by the -ve forcings of atmos. aerosols.

That ~ 1 W/m^2 in 1940 grew to ~ 2 W/m^2 by 1980 but despite that increasing the -ve RF of aerosols (to -1.5 W/m^2) kept the overall GHG (including H2O/WV) forcing more or less the same.

After that aerosols where brought under control by clean-air acts while industrial output post WW2 ramped up and CO2 concentration grew.

Such that there is now a GHG (incl H2O/WV) RF of ~ 4 W/m^2 and a total Net RF of ~ 3.
So the GHG forcing is now is 4x higher now than during the 1940-1980 period and the overall net forcing 6x higher. (NB: Net incl other GHGs eg CH4)

comment image

comment image

comment image

Reply to  Anthony Banton
October 21, 2026 7:12 am

You conveniently left out the fact that all that dust during the 30’s SHOULD have cause lower temperature by blocking the sun’s insolation!

You’ve just run into the bugaboo of climate science. How do you take into account, ON A HOLISTIC BASIS, all of the inputs and outputs of the biosphere?

You’ve listed out a few convenient facts. They are *NOT* all-inclusive. The 30’s were a hot period GLOBALLY, not just in CONUS. The Dust Bowl in Kansas wouldn’t have had much impact in China (prevailing winds don’t you know) but the 30’s were hot in China as well.

Anthony Banton
Reply to  Tim Gorman
October 21, 2026 8:58 am

“You conveniently left out the fact that all that dust during the 30’s SHOULD have cause lower temperature by blocking the sun’s insolation!”

The mere fact that it didn’t tells you you’re wrong. But anyways ..

Err no, Tim:

It was low level soil particles which act as an absorber of solar SW and LWIR come to that, and so increased warming.
It was not like Saharan dust ….

Microscopic Physics of Soil Dust

“Unlike white or reflective aerosols (like sulfur dioxide from volcanic eruptions, which genuinely cool the Earth by reflecting sunlight), the dust kicked up during the Dust Bowl consisted of darker, topsoil particulates. While these particles did block some sunlight from reaching the ground, they also absorbed solar radiation and trapped outgoing thermal energy in the lower atmosphere, contributing localized warming rather than pure cooling.”.

Try applying common-sense on occasion, or at least doing a basic Google!

Sparta Nova 4
Reply to  Anthony Banton
October 21, 2026 9:10 am

Can I have some ranch with that word salad.

Anthony Banton
Reply to  Sparta Nova 4
October 21, 2026 2:12 pm

Thanks for the admission that your science comprehension is at the level of a primary school kid, and/or by dint of preserving a certain cognitive bias – you did not even try.
You’re welcome.

Sparta Nova 4
Reply to  Anthony Banton
October 22, 2026 7:27 am

Splendid. The catnip worked!

Your assessment is flawed and inaccurate.
I am not obliged to prove anything to you and even if I chose to state my credentials you would use sophistry to try to discredit me.

Not worth the powder.

Perhaps I should throw out some catnip?

Ruhaan Pilani
Reply to  Sparta Nova 4
October 21, 2026 7:26 pm

or we could give you an easier to digest salad

white dust reflect light make cooler

dark dirt absorb light make warmer

not sure how much more I could simplify for you

Reply to  Anthony Banton
October 21, 2026 9:27 am

“The mere fact that it didn’t tells you you’re wrong”

Wrong about what?

China didn’t get the dust, the eastern US did. So how did it warm China?

“contributing localized warming”

It wasn’t localized warming that happened. It was GLOBAL.

So how do you explain that. BTW, dust absorbing sunlight ALSO increases radiation to space. Have you ever heard the term “Nuclear Winter”? What do you think the theory is that generated the name?

How about the extinction of the dinosaurs? Did that huge impact on the earth throw a lot of dirt and rock into the atmosphere? Did it cause a cooling or a warming. Did the dinosaurs die from heat stroke? Of from cold and starvation?

Anthony Banton
Reply to  Tim Gorman
October 21, 2026 2:01 pm

“Wrong about what?”

If, as you say the dust should have caused a lower temperature, then why didn’t it ?
As the only way not being lower is by dint of ASR.
So your question is nonsensical

Answer > because it didn’t block any insolation (in the sense that it was absorbed by the elevated soil particles in the lower trop) and hence warmed it.

”China didn’t get the dust, the eastern US did. So how did it warm China?”

Do concentrate, we are taking about the US.

“BTW, dust absorbing sunlight ALSO increases radiation to space. Have you ever heard the term “Nuclear Winter”? What do you think the theory is that generated the name?”

Yes, it indeed it does, but first it warms end then then emits the thermal energy created via LWIR, which warms the Trop – WV and other GHGs do. That is called the GHE.

That last para is just plain bizarre. Dinasaurs FFS ?!

Reply to  Anthony Banton
October 22, 2026 5:09 am

“If, as you say the dust should have caused a lower temperature, then why didn’t it ?”

That’s what I am asking *YOU*!

“Answer > because it didn’t block any insolation (in the sense that it was absorbed by the elevated soil particles in the lower trop) and hence warmed it.”

Then what killed the dinosaurs?

“Do concentrate, we are taking about the US.”

No, we aren’t. We are talking about the Earth’s biosphere. if you get the same result from two different environments then it is necessary to evaluate the factors that caused the same result. You continue to fail to do that.

“Yes, it indeed it does, but first it warms end then then emits the thermal energy created via LWIR, which warms the Trop – WV and other GHGs do. That is called the GHE.”

What energy is created? You are analyzing an entire system. The only energy input is from the sun. It really doesn’t matter to the system if PartA of the syatem absorbs the energy or PartB of the system absorbs the energy. The system will eventually return to EnergyIn = EnergyOut or you will see the system fail. I.e. if dust in the atmosphere results in long term retention of energy, EnergyIn>EnergyOut, then over the millenia we wouldn’t have seen glaciers, we would be living on a molten ball.

You are exhibiting the same blindness that climate science exhibits. Energy transport is a TIME function. You are looking at a small piece of natural variation and trying to project it into the future. It simply doesn’t work that way.

“That last para is just plain bizarre. Dinasaurs FFS ?!”

Of course you want to ignore this. If you don’t then you have to be able to explain why dust in the atmosphere causes different results at different times! Which you are unable to explain.

Reply to  Tim Gorman
October 22, 2026 5:53 am

> Then

Is that a “yes” I hear you say right before that “but”, Tim?

Don’t tell me that dinosaurs are your other specific interest…

Anthony Banton
Reply to  Tim Gorman
October 22, 2026 9:40 am

“Of course you want to ignore this. If you don’t then you have to be able to explain why dust in the atmosphere causes different results at different times! Which you are unable to explain.”

Not all – I just cannot be bothered with your continual obtuse musing, posed as “Got Yas”.
But hey, I caught this one and so here I am.

Atmospheric dust causes differing climate effects depending on its composition, location, altitude, and where it settles…..

The Dinasaurs FI are thought to have died out after the Meteor struck due a THICK layer of dust that penetrated right into the Stratosphere and persisted due long-lasting vegetation fires and a massive concentration (sun blotted out ~ 2yrs and not completly diminishing for 8-15 yrs
Caused severe cooling.

Normal volcanic aerosols also inject into the Stratosphere and a low concentration and produce modest cooling until gone (weeks/months)

Dustbowl soil particles (dark coloured) was low level and both incoming SW and outgoing LW heated it (just like dry surface soil) and was highly variable in concentration (surface gustiness), so not limiting surface ASR. The suspended soil particles would then have had the effect of further warming the low level air …. which was capped by the HP subsidence heated inversion and only give dry thermals.

Reply to  Anthony Banton
October 21, 2026 8:32 am

Your graph is messed up. I don’t know if you created it or copied it from somewhere, but it is entirely wrong.

Aerosol reduction allows more insolation to reach the surface of the earth. By showing aerosols as “cooling” you are actually ignoring the additional forcing from insolation as aerosols disappear. Much of the “additional watts/m²” derives from additional insolation, not increased CO2.

Look at it this way, CO2 is not on fire. It cannot “force” energy that it doesn’t create, it can only reflect what the surface emits, at best.

It also ignores the fact that cloudiness has decreased since the turn of the century. That allows even more insolation to reach the earth.

Sparta Nova 4
Reply to  Jim Gorman
October 21, 2026 9:11 am

Jim,

Please give a concise, scientific definition of the word “insolation” as it applies to your post.

Sparta Nova 4
Reply to  Jim Gorman
October 21, 2026 11:30 am

Never mind. I was conflating insolation with insulation. My bad.

Anthony Banton
Reply to  Jim Gorman
October 21, 2026 2:10 pm

“Aerosol reduction allows more insolation to reach the surface of the earth. By showing aerosols as “cooling” you are actually ignoring the additional forcing from insolation as aerosols disappear”

Jim::
The the Net Forcing results from subtracting (ie it’s a -ve forcing > blocks insolation) from the GHG forcing.

”ignoring the additional forcing from insolation as aerosols disappear”

Err, no – the Net forcing reflects the increased forcing as aerosols diminish … as then the subtraction is smaller.

OK: that’s enough from me as this has been an exercise in answering obvious obtuseness from you. That you do not understand that is even more staggering

Reply to  Anthony Banton
October 22, 2026 5:12 am

“OK: that’s enough from me as this has been an exercise in answering obvious obtuseness from you”

You still haven’t explained how increased insolation arriving at the surface of the earth results in cooling!

So you are deflecting. Typical.

Reply to  Tim Gorman
October 22, 2026 5:50 am

C’mon, Tim. That’s Sky Dragon cranks stuff. Should be kept at Roy’s.

Unless you’re too much of a coward to tell Roy what you think of him?

Reply to  Anthony Banton
October 22, 2026 9:54 am

Nice word salad. In the end, both the loss of aerosols and clouds result in higher surface temperatures and higher radiation into the atmosphere. Your inability to address this directly is exactly what warmists do to wave away the fact something other than GHG’s warm the earth.

Reply to  Anthony Banton
October 21, 2026 8:49 am

The United States isn’t the world, but it spans North America with a good variety of geography and topography which makes it a good sub-set of a land mass. World-wide, the US has the best sampling of weather data of any significant land surface. If the US does not show warming, a strong explanation is needed as to why it is an outlier compared to the rest of the world as a whole. Taken from (Richard Verney, WUWT, July 2017)

Anthony Banton
Reply to  Steve Case
October 21, 2026 10:21 am

“The United States isn’t the world, but it spans North America with a good variety of geography and topography which makes it a good sub-set of a land mass.”

I explained why it is subject to more arctic sourced air in that post,but here more details …

“Higher mountain ranges block part of the atmosphere and lead to an effective reduction of the vertical extent of the troposphere. This results in a decrease in the vorticity at the upstream side of the mountain range and an increase in vorticity at the downstream side.
Hence, upstream (downstream) of a mountain range, assuming a westerly flow, it has an additional cyclonic (anti-cyclonic) component, and we can observe a deflection of the flow, i.e., northward directly above the mountain range and southward downstream of it. This southward deflection is then the origin of stationary Rossby waves that propagate east. This can be observed, e.g., at the Rocky Mountains, and has a large impact on the jet stream.

https://www.imktro.kit.edu/download/Masterarbeit_Christian_Sch%c3%b6der_komprimiert.pdf

https://geo.libretexts.org/Bookshelves/Meteorology_and_Climate_Science/Practical_Meteorology_(Stull)/13%3A_Extratropical_Cyclones/13.02%3A_Section_3-

Reply to  Anthony Banton
October 21, 2026 12:17 pm

So what? There are mountains in Europe and Asia. But you reminded me of this great You Tube.

https://www.youtube.com/watch?v=5eDTzV6a9F4

Dr. Holdren said:

“…a growing body of evidence suggests that the kind of extreme 
cold being experienced by much of the United States as we speak 
is a pattern that we can expect to see with increasing frequency as global warming continues…I believe the odds are that we can expect, as a result of global warming, to see more of this pattern of extreme cold in the mid-latitudes and some extreme warm in the far north.”

Yes, he really said, “Global Warming causes extreme cold” As the
great Rush Limbaugh used to say, “You can’t make this stuff up.“

Anthony Banton
Reply to  Steve Case
October 21, 2026 2:20 pm

“There are mountains in Europe and Asia. But you reminded me of this great You Tube.”

There are but they do not lie N-S across the path of the PJS as it steams in from off the Pacific ocean
And actually those mountain ranges are what largely cause SSW events (Sudden Stratospheric Warming) and create a +ve AO which also often results in cold Arctic plunges over the US and Western Europe to boot.
If you want to know how then do please ask.
Yes, I know metrology Steve, being a retired UKMO meteorologist.

MarkW
Reply to  Anthony Banton
October 21, 2026 3:52 pm

That would be the UKMO that has become famous for cooking the books?

Reply to  Anthony Banton
October 21, 2026 6:58 pm

Urals are North – South

Reply to  Steve Case
October 22, 2026 5:56 am

I was going to mention that but then thought, what’s the point.

Reply to  Phil R
October 22, 2026 10:29 am

If he drops by to comment, I expect he’ll point out that the Rockies are higher.

Reply to  Steve Case
October 22, 2026 5:41 am

> As the great Rush Limbaugh

There are two? The only one I know was quite an asshat.

Reply to  Willard
October 22, 2026 10:31 am

Too bad Rush passed away, he would have given you maybe up to a minute of uninterrupted time to express your opinion and then much like Charlie Kirk rebut & refute you point by point. Besides that he had a rare talent of knowing what I think and put into words.

Reply to  Steve Case
October 22, 2026 10:38 am

I only made one point, Steve, so it might be hard to refute me point by point. And that point is rather hard to refute: I do think Rush was an asshat. One of my favorite bits is when he said Sherron was Black:

https://www.deseret.com/2006/2/18/19938957/limbaugh-notes-confusion-on-the-race-of-ohio-hopeful/

There are other bits I like about him, if you insist.

Reply to  Eldrosion
October 21, 2026 2:35 am

I see almost no change since 1980 to today. Linear regression is *NOT* very good at showing what is happening in a non-linear set of data.

Sparta Nova 4
Reply to  Tim Gorman
October 21, 2026 6:38 am

Since it is not data, but computed numbers of computed numbers of computed numbers, I suspect a Fourier Analysis would yield no insights into the frequencies involved in the variabilities.

Sparta Nova 4
Reply to  Eldrosion
October 22, 2026 6:53 am

As expected. The Trans-Climate Alarmist posts his activisms.

Laughing.

October 20, 2026 11:01 am

5a.

TFK_bams09 et al
Originating from Sun:
Net/net to surface 161 = 161 upwelling per LoT 1 = 17 + 80 + ((356 – 333) = 23 + 40) ) = 63 + 0.9 = balanced
Originating from impossible, “What if?” S-B BB calculation based on 16 C GMST no one agrees on:
Impossible 396 = impossible 333 “back” + impossible duplicate & extra 63 = misbalanced.
RGHE = bogus & CAGW = scam.

5b.

Water vapor, clouds, ice, snow create 30% albedo which makes the Earth cooler not warmer. W/o GHE there is no water and Earth goes lunarific, a barren rock ball, 400 K lit side, 100 K dark refuting a warming GHE.
“TFK_bams09” GHE heat balance graphic and ubiquitous clones don’t balance plus violate LoT.
Kinetic heat transfer processes of contiguous atmospheric molecules render a surface black body and it’s “extra” upwelling GHE energy impossible.
GHE is bogus and CAGW a scam so alarmists must resort to fear mongering lies, lawsuits, censorship and violence.

You’re welcome.

MarkW
Reply to  Nicholas Schroeder
October 20, 2026 1:45 pm

For wasting everyone’s time? No thanks.

Sparta Nova 4
Reply to  MarkW
October 21, 2026 6:39 am

MarkW,

Yes. It is repetitious and offers no insights. All true.

However, given how AI does its pattern recognition, repetition might have value.
Just a thought to chew on.

Sparta Nova 4
Reply to  Sparta Nova 4
October 21, 2026 9:12 am

No new insights.

I apologize for my hasty and bad wording.

strativarius
October 20, 2026 11:30 am

Why You Should No Longer Fear Global Warming

I never did buy in to that utter nonsense. Many simple souls have. And it has sent them round the bend.

rah
October 20, 2026 11:40 am

I never did fear either global warming or climate change though there has been more than one occasion when I have been considerably concerned about the weather.

I have no college degree, but I can still read and learn and have no doubt spent far more time living in the rough in nature than the vast majority of academics who push the idea of human caused catastrophic climate change.

That the geologic evidence indicates that for the majority of time there has been life on earth there have been no polar icecaps.

That the greatest bursts in the numbers and the diversity of life on earth has come during times warmer than the present.

That we live in an ongoing ice age and are in fact a product of this current ice age.

That all species of life on earth effect their environments and thus in many cases the climate in one way or another.

That the known drivers of significant climate change that brings on the bursts of life and the mass extinction events are far beyond our control and our ability to fully understand them at this time in our development. And thus I question the wisdom and motivations of those who claim they do.

Reply to  rah
October 20, 2026 11:48 am

Sometimes not having a college degree can be a blessing. More and more it is being shown that academia is not all it’s cracked up to be.

Ruhaan Pilani
Reply to  Phil R
October 21, 2026 7:29 pm

ignorance is always a blessing, innit?

strativarius
Reply to  Ruhaan Pilani
October 22, 2026 3:15 am

Just ask Michael E Mann…

Reply to  Ruhaan Pilani
October 22, 2026 5:24 am

What an arrogant, condescending, ignorant comment, but wouldn’t expect anything less. You and so many others automatically assume anyone without a college degree is ignorant, but those with degrees are somehow keepers of the divine truth, not to be questioned by the filthy masses.

Sparta Nova 4
Reply to  Phil R
October 22, 2026 7:35 am

More to the point, Phil, those flame warriors automatically assume anyone disagreeing with them is ignorant and/or stupid.

After all, they believe they know the absolute, universal truth.
It’s their religion.

Reply to  Sparta Nova 4
October 22, 2026 8:10 am

And elevating themselves by stepping on others is a very religious activity.

Reply to  Sparta Nova 4
October 22, 2026 9:34 am

Hallelujah!

Sparta Nova 4
Reply to  Jim Gorman
October 22, 2026 1:18 pm

Send more money!

Had a lab tech that would do a revival preacher imitation.
He always ended with, Hallelujah and send more money!”

Thanks for evoking a fond memory.
Cheers!

Reply to  Sparta Nova 4
October 22, 2026 1:33 pm

Your mention of a revival preacher just kicked off Neil Diamond’s Brother Love’s Traveling Salvation Show. Reach out your hand!

MarkW
Reply to  Ruhaan Pilani
October 22, 2026 1:15 pm

Funny, you actually believe that degrees in advanced women’s studies makes one smarter?

hdhoese
Reply to  rah
October 20, 2026 1:18 pm

Where I live is a forced ‘recycling’ and trash program which I exploited by collecting magazines. One I saved is the September 2013 National Geographic issue with a cover “celebrating 125 years of history and how they are changing our shorelines” and the famous statue with about a third of its height under water. The first article highlights Hurricane Sandy which a NASA computer model had predicted four days earlier. Ironically their last article is “Failure is an Option” as essential highlighting the Peary expedition. One wonders if they now consider our greatly expanded use of computer models as also essential. There has only been maybe a half dozen decades of caution about them along with the statistics they used much longer. 

It would be interesting to document how they covered each of the real threats in their history. They showed the 125 years as an available book. A few valuable articles were even in this issue but I didn’t find “self-inflicted.”

Sparta Nova 4
Reply to  rah
October 21, 2026 6:41 am

You speak like a natural philosopher, one who before “science” was defined sought to catalog and understand flora and fauna and geology, etc.

rah
Reply to  Sparta Nova 4
October 21, 2026 3:20 pm

Though you give me far too much credit I thank you for that compliment.

Sparta Nova 4
Reply to  rah
October 22, 2026 7:38 am

Anyone curious as to how things work and seeks to better understand reality is, in my book, a first rate natural philosopher.

Many of those natural philosophers of old did not have academic pedigrees and were self-taught driven by curiosity and a desire to learn. They were also quite humble.

October 20, 2026 1:39 pm

Anthony, good luck on your presentation.

There is some other things you might mention for people to consider.

Climate sciences’ predilection with temperature as a proxy for climate. It is not a good proxy for energy. Humidity plays a large role in actual climate and temperature alone does not deal with it at all. I usually use Las Vegas and Miami as examples. They have similar temperatures but vastly different climates due to humidity. Energy is what makes the world go around, and temperature misses all the latent heat being moved. Newer automated land stations have the information for determining enthalpy and it should be the new variable.

Averaging temperatures, an intensive property is a crutch that has outlived its usefulness. Again, enthalpy is extensive and can be added and averaged properly. Automated land stations have given us the ability to use enthalpy for over 30 years. It is time to move on.

It took me about 30 minutes to have CoPilot write a script for downloading CRN data and add enthalpy into the csv file that I then move into Excel. CoPilot/Python just doesn’t produce graphs I like.

Which brings me to the last suggestion. Insolation and 2-meter temperatures are not a one-to-one relation. Oceans and land are in the middle and really modify the whole thermodynamic process. Matching temperature with insolation is a fool’s errand without using time because of the storage issue especially in the ocean.

C_Miner
October 20, 2026 4:33 pm

Anthony, all I can say to this is NOOOO…… (with a couple of sobs on the end). You’re presenting in the city where I live during my first planned out-of-country vacation in years. I’m sad that I’ll miss it.

Directly to the point of your talk, the Calgary weather station of record is at the airport. The airport for Calgary is in the north-east of the city and city of Calgary resources https://www.calgary.ca/environment/resources/urban-heat-map.html show it to be 8 degrees hotter than fields the surrounding countryside on a hot summer day (so fully in the UHI zone for 30-40 years). Historical resources in Google Earth history showing the city’s expansion show the airport area as being surrounded by streets and buildings only since the 90s. Despite that, there were over double as many record single day high temperatures in the 1910s, 20s, and 30s than in the 1990s, 2000s, and 2020s. https://www.extremeweatherwatch.com/cities/calgary/record-high-by-day at the bottom of the page.

A little local flavour could really make the “really?” “Yes, really.” pop for the local audience. Best of luck! I hope that it will be recorded so I can buy a viewing upon my return.

Bob
October 20, 2026 4:50 pm

Very nice Anthony, this is exactly what we need.

Edward Katz
October 20, 2026 5:56 pm

Hopefully the Canadian government will pay close attention to the data presented a quit feeding its citizens fairy tales about reaching Net Zero, a goal that it’s nowhere close to reaching in the first place. The reality is that Canadians are among the least likely nationalities to make big lifestyle changes to meet any climate goals since it has become obvious that such efforts will achieve nothing except increase an already rising cost of living.

Reply to  Edward Katz
October 21, 2026 5:10 am

I would think Canadians would welcome a few degrees of warming. Longer growing seasons would seem to be a boon.

Reply to  Edward Katz
October 22, 2026 3:50 am

They would achieve something else…a good deal of premature deaths in winter (as I think about trying to heat homes in Canada with “heat pumps” in particular if they try to power them with wind and solar “power”).

October 21, 2026 2:29 am

A thermometer near asphalt, buildings, or artificial heat sources can experience local influences that complicate the measurement of broader climate trends. Researchers apply adjustments and use multiple observational systems to address these issues, but the methods and remaining uncertainties deserve continued scrutiny.

There is a link on the side panel of this very site to the US Climate Reference Network (USCRN), which is described by WUWT as being,

… a properly sited (away from human influences and infrastructure) and state-of-the-art weather network consisting of 114 stations in the USA

And guess what? Over its period of operation (currently Jan 2005 to Sep 2026), USCRN has been warming every bit as fast, indeed slightly faster, than ClimDiv, the equivalent US weather network to which temperature adjustments are applied! Almost 22-years of comparable data and the ‘pristine’ sites are warming faster than those that require adjustment.
Until it became increasingly apparent (and increasingly highlighted in the comments here) that USCRN data were warming as fast, indeed faster, than the adjusted data, WUWT regularly referenced USCRN as evidence that warming was the result of poor weather station siting.

Now though, following the warmest summer on record for the US (including USCRN), not only have these references to USCRN stopped, the link to the data at WUWT stopped updating in May (missing out on all that summer heat!)

Hopefully this mystery will be fully explained in Calgary. Meanwhile, the chart below shows USCRN versus ClimDiv, with trend lines (data available here).

Screenshot-2026-10-21-102656
Derg
Reply to  TheFinalNail
October 21, 2026 2:38 am

We agreed earlier that the planet is greening, humans are thriving and CO2 does not impact hurricanes.

Reply to  Derg
October 21, 2026 5:10 am

This is about US temperature data, though.

Sparta Nova 4
Reply to  TheFinalNail
October 21, 2026 6:49 am

What is presented in that graph is not data. It is computations of computation of computations aka averages of averages of averages.

This is not a declaration that those computations are inaccurate or validation that they are accurate. It is pointing out that the chart does not display “US temperature data.” At best it can be claimed it displays proxies of US temperature data.

Reply to  Sparta Nova 4
October 22, 2026 12:28 am

What is presented in that graph is not data. It is computations of computation of computations aka averages of averages of averages.

This is another thing that only ever seems to become a problem on this site when they don’t go in a particular way. Where were all you “averages ‘skeptics” when Monckton was here a few years ago putting out his monthly ‘no warming since‘ nonsense, based on… averages?

Of course it is valid to find the middle value of a set of values. It’s done all the time and no one bats an eyelid until it says something they don’t want to see. Ever heard of ‘average body temperature’?

Reply to  TheFinalNail
October 22, 2026 7:29 am

Averages hide variance. Variance is a metric for uncertainty. When you lose variance data then you no longer know exactly what you have.

“Where were all you “averages ‘skeptics” when Monckton was here a few years ago putting out his monthly ‘no warming since‘ nonsense, based on… averages?”

Monckton was using EXACTLY the same data those on the other side of the argument were using! To show that their conclusions from the data didn’t match what the data was showing.

And you are whining about that?

“Of course it is valid to find the middle value of a set of values. It’s done all the time and no one bats an eyelid until it says something they don’t want to see. Ever heard of ‘average body temperature’?”

Statisticians like to use the mean because it is a statistical descriptor of the center of gravity of a distribution. As such, it doesn’t vary as greatly when data is added/subtracted as does the median or mode. IT MAKES THINGS SIMPLER.

What is never mentioned is the *unstated* assumption that everything is Gaussian. For a non-Gaussian distribution, the mode and median are far better descriptors. And you can still do statistical analysis with them. It’s just a little more complicated.

The ones that don’t want to see are the ones that assume that temperature measurements from different locations, taken with different instruments, at different times, under different environments ALWAYS FORM A GAUSSIAN DISTRIBUTION.

Has anyone ever heard of the 5-number statistical descriptor? It was developed for a reason.

As for average body temperature ask a doctor when it is assumed that someone has a fever. It’s 100.4F. That’s an uncertainty interval of almost 2F. The *actual* definition of “average body temp” is 98.6F +/- 2F.

Why do those trying to defend climate science ALWAYS ignore measurement uncertainty?

MarkW
Reply to  Tim Gorman
October 22, 2026 1:19 pm

If one person at this site takes one position, and someone else takes another, our trolls take that as proof that none of us know what we are talking about.

They seem to believe that everybody singing from the same book is evidence that they are the only ones who know the truth.

Sparta Nova 4
Reply to  TheFinalNail
October 22, 2026 7:39 am

No. It is flawed. If one were trying to find the middle value of a set, one would use the MEDIAN.

Reply to  TheFinalNail
October 22, 2026 8:02 am

Where were all you “averages ‘skeptics” when Monckton was here a few years ago putting out his monthly ‘no warming since‘ nonsense, based on… averages?

Another CAGW ranter who never grasped CMoB’s method…

MarkW
Reply to  TheFinalNail
October 22, 2026 1:21 pm

To bad Lord Monckton wasn’t using averages. Not that you know enough science to know the difference.

Reply to  TheFinalNail
October 21, 2026 2:58 am

The measurement uncertainty budget for CRN stations has an entry for microclimate as a component – but the budget specifically states that it is not estimated, the entry is blank.

Who knows what microclimate changes around CRN stations have caused to the CRN record if one of the major causes of uncertainty isn’t even estimated on a station-by-station basis?

Reply to  Tim Gorman
October 21, 2026 5:26 am

Can you provide a link for this claim, please?

NOAA state that changes to the local microclimates and surrounding environments of USCRN stations are strictly monitored and minimised.

Also, funny how, even if what you claim is true, it has only become an issue since USCRN started showing more warming than ClimDiv.

In the second half of the record (since 2016), the monthly anomaly for USCRN has been warmer than that for ClimDiv.

Reply to  TheFinalNail
October 21, 2026 7:00 am

“Can you provide a link for this claim, please?”

search for this: “USCRN 8.10. 2b, Site surroundings, δTsite”

Here is an excerpt from the USCRN field maintenance manual:
—————————-
Preventive Maintenance Requirements

– Monthly: Instrument cleaning, inspect for physical damage, etc. 1000 ml precipitation gauge calibration verification. •

-Annually: Re-calibration and refurbishment in accordance with the Scheduled (Annual) Maintenance Checklist (see Appendix C).

-As Needed: Emptying of the precipitation gage upon reaching a predetermined threshold or in advance of a significant predicted rainfall event (see Appendix E for Preliminary Host Notification Procedures). 
————————–

There is nothing in here about checking microclimate conditions and/or logging in any adjustment factor.

“NOAA state that changes to the local microclimates and surrounding environments of USCRN stations are strictly monitored and minimised.“

No, they aren’t. There is an initial site survey whose purpose is as follows:

——————————-
Reasonably high probability of Long Term Site Stability and surrounding area. Minimize risk of man made encroachments over time and/or the chance the site will close due to the sale of the land or other factors. Stations located on government (federal, state, local) land or at colleges (granted/deeded land with land use restrictions) often provide a higher stability factor. This criterion also includes the need for USCRN deployment and maintenance personnel to have reasonably convenient access to the site. A review of recent (last ten years) and possible future population growth patterns in the area is a part of the overall evaluation process.  
——————————-

This site survey QUANTIFIES nothing concerning measurement uncertainty due to the microclimate.

The only operational maintenance has to do with the equipment and instrument maintenance.

See above for monthly and annual maintenance – strictly equipment and instrument maintenance. Nothing about microclimate analysis and nothing about logging a correction factor due to microclimate. You can calibrate the sensor to death but it still won’t provide accurate measurements if the microclimate has a systematic uncertainty influence.

“Also, funny how, even if what you claim is true, it has only become an issue since USCRN started showing more warming than ClimDiv.”

It’s ALWYAS been a concern, especially for the past 25 years. Hubbard and Lee studied the impact of microclimate clear back in the late 1990’s and published in 2002. Their conclusion was that regional adjustments to measurements only spread measurement uncertainty around. Adjustments had to be done on a station-by-station basis and even then, they didn’t quantify how to adjust for microclimate conditions that change from month-to-month let alone over longer periods.

Stop your gaslighting. There is *nothing* that I can find that makes CRN any better than most temperature measuring stations other than the care taken in initial siting. Most of the stations have existed long enough for things like land use changes, structure changes, vegetation growth, etc to have an impact on the measurement uncertainty — WHICH IS NEVER QUANTIFIED IN THE MEASUREMENT UNCERTAINTY BUDGET!

“In the second half of the record (since 2016), the monthly anomaly for USCRN has been warmer than that for ClimDiv.

So what? If the systematic effects of the microclimate aren’t accounted for how do we know whether that is a result of land use changes, structure changes, vegetation changes, etc or not? There is no way to know if it actually represents a “climate” change.

Reply to  Tim Gorman
October 21, 2026 8:38 am

Then demonstrate that these stations have a systematic microsite bias.

Reply to  Eldrosion
October 21, 2026 9:07 am

“Then demonstrate that these stations have a systematic microsite bias.”

I don’t have to. All I have to point out is that they have an entry in their measurement uncertainty budget with NO VALUE SHOWN!

Even if it is 0 (zero), it needs to show 0 (zero).

You’ve never been responsible for the production of anything, have you?

MarkW
Reply to  Eldrosion
October 21, 2026 12:45 pm

It is up to those who want to use the data to prove that the data is valid. And that includes that the instruments used were both properly set up and properly maintained during the entire period that the instruments were being used.

Reply to  MarkW
October 22, 2026 12:59 am

It is up to those who want to use the data to prove that the data is valid.

WUWT used to use it all the time and still feature it prominently on the side panel of this site; so they are still using it.

If they now think the data set is invalid then they should say so, stating their reasons, according to you. I agree.

So far repeated requests for comment have been met with silence and we are still only up to May as far as the WUWT’s link to their USCRN page is concerned, despite September’s update being posted weeks ago.

Reply to  TheFinalNail
October 22, 2026 6:30 am

Showing it does not mean it is accurate!

The *big* problem is the measurement uncertainty – WHICH IS NEVER CALCULATED.

MarkW
Reply to  TheFinalNail
October 22, 2026 1:22 pm

Using the other side’s data to show the other side’s arguments are invalid is the not the same thing as endorsing the other side’s data.

Reply to  Tim Gorman
October 22, 2026 12:56 am

There is nothing in here about checking microclimate conditions and/or logging in any adjustment factor.

USCRN state that they evaluate the exposure of climate instruments based on their site surroundings to quantify potential artificial heating effects: [pdf]

2.4. Program Objectives and Characteristics

As required by the climate science community and codified by the NAS-NRC, WMO, and NOAA’s NCDC USCRN Functional Requirements Document, the USCRN, as a primary climate monitoring network, has the following attributes:

c. stringent siting standards and an objective, quantitative

assessment, which is annually verified and maintained for

the long-term for each site as an essential part of the

overall metadata pertaining to each site and station;

d. rigorous periodic maintenance and calibration program

with thorough documentation, which is systematically

collected and archived at least once per year;

Now, if you have evidence that they have not done this across their 114 sites, then you might be on to something. However, I strongly suspect that no such evidence exists (I can’t find any, and I would assume that WUWT and fellow travellers would be all over it if there was any, but so far … tumble weeds.)

Reply to  TheFinalNail
October 22, 2026 6:37 am

Nice try! BUT IT IS *NOT* MENTIONED in any of the routine maintenance documents at all.

You apparently would have us believe that the site maintainers, AT ALL LOCATIONS, go over and above the required maintenance.

” stringent siting standards and an objective, quantitative assessment, which is annually verified and maintained for the long-term for each site as an essential part of the overall metadata pertaining to each site and station;”

Show us the routine maintenance document that has this as a required action.

” rigorous periodic maintenance and calibration program with thorough documentation, which is systematicallycollected and archived at least once per year;”

Which is under the Equipment and Instrument section, not under any “site” section.

“Now, if you have evidence that they have not done this across their 114 sites, then you might be on to something.”

All I have to show that microclimate influence is *NOT* included in routine maintenance documentation and that *NO* entries exist for site measurement uncertainty values.

*YOU*, on the other hand, need to show where the site maintenance *is* shown in the routine maintenance documents and SHOW WHERE THE SITE MEASURMENT UNCERTAINTY IS DOCUMENTED FOR EACH STATION!

I’ve shown that it isn’t given in the measurement uncertainty budget required documentation. *YOU* show where it *is* documented.

“ However, I strongly suspect that no such evidence exists (I can’t find any, and I would assume that WUWT and fellow travellers would be all over it if there was any, but so far … tumble weeds.)”

How do you show something that doesn’t exist? *YOU* need to show that it *does* exist if you are going to claim that it exists.

Sparta Nova 4
Reply to  Tim Gorman
October 22, 2026 7:40 am

Tim,

Why do you allow yourself to be controlled in this waay?

Reply to  Sparta Nova 4
October 22, 2026 7:49 am

Nobody controls Tim, not even Tim.

Reply to  Willard
October 22, 2026 8:13 am

Have some catnip…

MarkW
Reply to  karlomonte
October 22, 2026 1:25 pm

They must be running out of money, the quality of the trolls is slipping.

Reply to  TheFinalNail
October 22, 2026 7:44 am

—————————-
“www.ncei.noaa.gov/pub/data/uscrn/documentation/program/X041_d0.pdf”

“2.1 Field Site Maintenance Requirements NOAA-CRN/OSD-2003-00010R0UD0 November 19, 2003 DCN 0
Field site maintenance consists of several components and requires differing levels of expertise and scheduling. Representative examples include the following:
• Facilities maintenance: Cut grass, repair Double Fence Intercomparison Reference (DFIR) slats, and maintain site integrity
• Preventive maintenance: Instrument cleaning, emptying/clearing the precipitation gauge, scheduled component replacement.
• Corrective maintenance: Equipment repair or replacement, downloading datalogger content to the Personal Data Analyzer (PDA), installing datalogger programs from PDA. ”

——————————————-

Not a single word about estimating site measurement uncertainty.

Why do those who try to defend climate science ALWAYS exhibit a lack of reading comprehension ability? They can’t follow a documentation chain. They can’t read for meaning and context.

————————————-

(hopefully this posts ok)

USCRN Scheduled Maintenance 
Checklist 

Inform Site Host of visit    
 Gather components (see USCRN Annual Site Visit Components 
Checklist) 
  
 Ship appropriate items    
 Note shipment(s) tracking numbers    
 Visually inspect site and note any abnormalities on Site Visit Accountability 
Sheet 
 
 Retrieve data from data logger   
 Retrieve program from data logger    
 Note serial numbers of current equipment on USCRN Site Info. & Instrument Coeff. 
History Record 
 Complete USCRN Site Visit Data Verification   
 Take pictures as needed (see Photographical Documentation Checklist for 
USCRN Site) 
 
 Empty rain gauge     
 Exchange appropriate sensors/components 
 Check wiring inside Geonor, secure wires and verify nothing touching 
bucket 
  
 Calibrate rain gauge    
 Add appropriate mixture to rain gauge    
 Verify height of aspirated shield is 1.5 m    
 All fans running with no noise    
 Check flow rates of aspirated shields, clean if needed   
 All mounts tight?     
 Check all wiring connections, verify tightness   
 Locks working properly, oil or replace if needed   
 Replace any broken slats on SDFIR    
 Relevel alter shield

Check antenna connections    
 Verify battery charger is set to correct temperature setting   
 Verify door switch is working properly    
 Complete USCRN Site Information & Instrument Coefficient History Record  
 Program data logger    
 Verify wiring matches wiring diagrams    
 Complete USCRN Site Visit Data Verification   
 Verify rain gauge heater works    
 Key in *0 on data logger keypad    
 Verify holes duct sealed    
 Lock datalogger box and battery box    
 Verify Transmission    
 Ship appropriate items    
 Note FedEx tracking numbers    
 Complete Site Visit Accountability Sheet   
 Enter MetaData into CRN Sites Database   
 Archive files     
  — pictures     
  — program     
  — USCRN Site Inventory Record    
  — calibrations 

———————————
No mention of estimating microclimate imfluences.

MarkW
Reply to  TheFinalNail
October 22, 2026 1:24 pm

Independent survey’s of the sites have shown that while the micro-site might have been adequate when the site was set up, they did not remain that way for long.

Sparta Nova 4
Reply to  TheFinalNail
October 21, 2026 7:01 am

You are trying to establish correlation as causation in the USCRN vs ClimDiv discussion.

Reply to  Sparta Nova 4
October 22, 2026 1:00 am

No, as I stated, I am pointing out that the ‘pristine’ USCRN sites are warming as fast, indeed slightly faster, than the adjusted ClimDiv sites. One does not cause the other.

Sparta Nova 4
Reply to  TheFinalNail
October 22, 2026 7:41 am

No. That is not the original premise of your objection.

More catnip?

Reply to  Sparta Nova 4
October 22, 2026 7:51 am

> the original premise of your objection

You said the magic word, Sparta.

So I’ll bite – what’s the premise?

Sparta Nova 4
Reply to  Willard
October 22, 2026 9:20 am

Splendid. The catnip worked.

I will no longer play this game with you.

I am not interested in pursuing an exercise in answering obvious obtuseness from you.

Reply to  Sparta Nova 4
October 22, 2026 10:18 am

Something tells me you responded to the wrong person, Sparta.

Identifying premises is rather hard. They’re usually implicit. And considering your Climateball performance so far, it might be best if you carried your own weight.

Sparta Nova 4
Reply to  Willard
October 22, 2026 1:22 pm

You are correct.
I posted to the wrong person.
I apologize for the error.

Reply to  Sparta Nova 4
October 22, 2026 1:28 pm

No worries.

Identifying that premise is still on the table, if you ever get the Round Tuit.

MarkW
Reply to  TheFinalNail
October 22, 2026 1:25 pm

What you haven’t shown is that the sites are pristine. Just declared that they must be.

Reply to  MarkW
October 22, 2026 1:29 pm

We work with what we got, Mark. Take Tony’s opiniators!

Reply to  TheFinalNail
October 21, 2026 7:51 am

Do you know what the measurement uncertainty is for a CRN station. My own back of the envelope calculation shows about ±0.8°C expanded standard uncertainty. This is not unreasonable from studies of USCRN uncertainty.

What would that look like with error bars on your graph?
Do you ever wonder why the NOAA graphs never show error bars?
Maybe NOAA would like you to believe their numbers are 100% accurate?

Reply to  Jim Gorman
October 22, 2026 1:29 am

My own back of the envelope calculation shows about ±0.8°C expanded standard uncertainty.

I wonder how you arrived at such a high figure?

USCRN sites use Platinum Resistance Thermometers (PRTs) which claim to have a measurement error of +/- 0.05C, which is 16 times lower than your “back of the envelope calculation“.

The +/-0.05C figure for the PRTs deployed by USCRN was verified in this peer reviewed paper published by the AMS:

“...ambient temperature can be measured with an RMS error of less than 0.1°C. With like shields and sensors at two elevations, temperature difference can be measured to 0.05°C”

Maybe you should get the back of your envelope published as a rebuttal?

Reply to  TheFinalNail
October 22, 2026 6:27 am

Sensor measurement uncertainty is *NOT* station measurement uncertainty. Why do you CONTINUALLY try to gaslight people on this when you’ve been corrected ad infinitum in the past!

Reply to  Tim Gorman
October 22, 2026 8:04 am

Why do you CONTINUALLY try to gaslight people on this when you’ve been corrected ad infinitum in the past!

Its all he has in the tank.

Reply to  TheFinalNail
October 21, 2026 6:21 am

Look closely at your graph. Many months with below average until about 2023. What happened in 2023/2024 to cause the temperatures increase such that the linear trend line shows a big increase?

Reply to  Jim Gorman
October 22, 2026 1:44 am

The linear trends are calculated across the whole of both data sets; so they include data both before and after 2023/24.

Derg
Reply to  Jim Gorman
October 22, 2026 11:58 am

Extra CO2 😉

MarkW
Reply to  TheFinalNail
October 21, 2026 12:43 pm

I love how you take quotes out of context in order to justify your distortions of the data.
The full quote indicates that Anthony is talking about a subset of the network.

Reply to  MarkW
October 22, 2026 1:41 am

The full quote indicates that Anthony is talking about a subset of the network.

No it isn’t; unless you count the whole of USCRN as a “subset of the network”

Did you follow the link?

Here’s the whole quote (from WUWT’s own US Surface Temperatures page) with the part I quoted emboldened. Show me where it says it’s talking about “a subset” of USCRN rather than the whole USCRN network.

The graph shows the Average Surface Temperature Anomaly for the contiguous United States since 2005. The data comes from the U.S. Climate Reference Network (USCRN) which is a properly sited (away from human influences and infrastructure) and state-of-the-art weather network consisting of 114 stations in the USA.

These station locations were chosen to avoid warm biases from Urban Heat Islands (UHI) effects as well as microsite effects as documented in the 2022 report Corrupted Climate Stations: The Official U.S. Surface Temperature Record Remains Fatally Flawed. Unfortunately, NOAA never reports this data in their monthly or yearly “state of the climate report.” And, mainstream media either is entirely unaware of the existence of this data set or has chosen not to report on this U.S. temperature record.  

October 21, 2026 3:58 am

No longer fear?! I have NEVER feared an IMPROVING climate.

You’re still speaking their language too much, Anthony. It’s not that global warming is a “problem” AT ALL, because it’s not. The science doesn’t reveal it to be “less of a problem,” it confirms that IT NEVER WAS A PROBLEM.

The Little Ice Age was not utopia, IT was a horrid climate. Anyone who thinks warmer COMPARED TO THAT is a “crisis” or even a “problem” simply lacks perspective or context. Millions upon millions STARVED TO DEATH during The Little Ice Age because of its short crop seasons, killing frosts during those short crop seasons, and resulting crop failures and/or general inability to grow sufficient food.

And that was when the human population was less than ONE billion.

We can now consistently feed EIGHT billion, which wouldn’t be the case if we continued to experience the “preindustrial” aka Little Ice Age climate.

The message should not be “not as big a problem as you have been told,” it should be “They are literally telling you to panic when they should be telling you to celebrate.”

Sparta Nova 4
Reply to  AGW is Not Science
October 21, 2026 7:03 am

Anyone who has read anything about Washington’s Continental Army winter encampment at Valley Forge knows what you posted is historically supported.

Sparta Nova 4
October 21, 2026 8:58 am

STORY TIP:
stevekj owes me an apology

The original issue arose in an early blog.
https://wattsupwiththat.com/2026/10/15/claim-fiji-pre-cop-climate-conference-was-not-a-flop-because-participants-agreed-to-demand-more-money/

Roughly 2/3rds down the page.
I replied to specific points under discussion in what is clearly a political conversation.

He subsequently accused me publicly as being a hypocrite.
https://wattsupwiththat.com/2026/10/20/u-s-epas-energy-exceptionalism-co2-freedom/

Roughly halfway down the page.
I responded to his accusation fully.

October 21, 2026 10:37 am

In the above article, Anthony Watts stated:
“We’ve been warned about enormous numbers of climate refugees, disappearing islands, catastrophic changes in ocean chemistry, and a variety of deadlines after which supposedly irreversible disaster would become unavoidable.”

So, Anthony, please don’t fail to mention in your talk how climatologists en masse were self-deluded in the late 1960’s to early 1970’s by data they thought indicated a coming “ice age” (more accurately a coming glacial interval), despite paleoclimatology data from the previous million or so years indicating the glacial-interglacial cycle period was on the order of 100,000 years and the well-known fact that Earth exited the last glacial period only some 12,000–13,000 years ago.

It is a sad fact that this past, documented bad call has not tempered the hubris of certain “climate scientists” that now predict catastrophe/disaster due to “newfound” global warming, especially those that predict such occurring from only a 1.5 deg-C rise in average global temperature from “pre-industrial” times. /sarc

Reply to  ToldYouSo
October 22, 2026 5:39 am
Reply to  Willard
October 22, 2026 8:29 am

Willard, that you would actually believe such revisionist history is laughable.

How about some hard evidence (covers of major media publications from the times) to show what really was happening at the time . . . I’m posting the link to the search result images rather than the 50 or so actual images in accordance with WUWT request to do such:
https://www.google.com/search?sca_esv=68b356426eb2b258&sxsrf=APpeQntMGYZGcCPGL_y1jzNIBXyXiFTx2w:1792680829883&udm=2&fbs=ABfTbFVyMZGZf1hfvX9uKjN_-G8c4u0nXx4bEIpwm1lnNH832QGGMdFXpDyzkQgEdtB8w9w-GD6PIjvNPpUnrx3WoOVIqtB7m0uJCnmO69VZCGvjkJswfxpqShzBmeU9vLtlIzpB5qp_I4BbqEr0GaxOvSmJ498B6z8aPqL8CC6d_D-OMiOA1rp8cpiApSc4bqzrEFRQ0aGBJCBOrMEv10CvQfXRc0n9Aw&q=Science+news+cover+The+Coming+Ice+Age&sa=X&ved=2ahUKEwjk873A8M2XAxXlfjIDHaDqJUgQtKgLegQIGxAB&biw=1333&bih=776&dpr=1.8#sv=CAMSUxoyKhBlLTRadjhkbkh3NUZpSlJNMg40WnY4ZG5IdzVGaUpSTToOamh4WE9zM3JqWGFZdU0gBCoXCgFzEhBlLTRadjhkbkh3NUZpSlJNGAEwAVACGAcgjZGvsQFKCBACGAEgAigB

Beyond these various magazine covers and their associated articles on scientist predictions for a “coming ice age”, there is this famous (infamous?) video released in 1978 narrated by actor Leonard Nimoy titled In Search of the Coming Ice Age that (now) embarrassingly states at the 0m59s time hack: “Climate experts believe the next ice age is on its way. According to recent evidence, it could come sooner than anyone expected.”
https://www.youtube.com/watch?v=RQRqr9_jw5I

The Web never forgets, and its recorded history is not easily revised.

Reply to  ToldYouSo
October 22, 2026 10:27 am

These anecdotes are duly noted, ToldYou. But they’re teh Goddard’s, right?

Not sure why you call magazine covers “hard evidence” and lichurchur reviews “revisionist history”, but you do you.

Reply to  Willard
October 22, 2026 12:57 pm

“Not sure why you call magazine covers ‘hard evidence’ . . .”

Why am I not at all surprised by that admission?

However, I’ll accept that you totally misunderstood that I was referring to evidence of scientist claims at the time (i.e., the coming “ice age”) and not to objective scientific evidence to support such claims . . . that requires passing Reading Comprehension 102.

Reply to  ToldYouSo
October 22, 2026 1:19 pm

> evidence of scientist claims at the time

Yet you exclude what these scientists said in their papers and restrict yourself to magazines, ToldYouSo.

That’s rather…odd.

Nemoy’s documentary drew heavily on Kukla’s crap, whom at the time was already quite a contrarian.

In the early 1970s, Kukla became a proponent of the idea that earth was veering toward another ice age—a view shared by prominent scientists at the time, when the planet was in fact cooling. Temperatures soon reversed course, as did most researchers. Kukla did not, and stuck with his global cooling hypothesis to the end.

https://news.climate.columbia.edu/2014/06/06/george-kukla-contrarian-climate-scientist/

Since you missed it, I might need to make that connection a little clearer on my page.

Anything else?

Sparta Nova 4
October 21, 2026 11:43 am

Story Tip:

And it continues, non-stop.

United Nations report highlights significant increase in U.S. climate pollutionhttps://www.npr.org/2026/10/21/nx-s1-6003553/america-oil-gas-coal-climate-change-trump-carbon-emissions

References UNEP
Emissions Gap Report 2026https://www.unep.org/en/publications/report/emissions-gap-report-2026