
.
European Institute for Climate and Energy EIKE
17th International EIKE Climate and Energy Conference (IKEK-17) in Halle, Central Germany on June 27th, 2026
The Committee for a Constructive Tomorrow CFACT is a US-based nonprofit organization founded in 1985 that advocates for free-market solutions to environmental issues.
The organization rejects the scientific consensus on climate change. President Craig Rucker explains why U.S. citizens are becoming increasingly critical of climate rescue policies.
I like EIKE.
Climate realism Andy Burnham style.
We’ve all seen the BBC/media narrative on this year’s wildfires. They even enlisted the halfwit son of the halfwit king to tell us plebs…
Wildfires ‘stark reminder’ of extreme climate challenge, says William
”These events are a stark reminder of the challenges posed by an increasingly extreme climate and the importance of protecting both people and nature.” – BBC
William did warn us:
The Duke of Cambridge revealed that he lies awake at night worrying that world leaders and politicians are failing to do enough to stop climate change. He said: “I get outraged by the inaction. “That’s probably a bit of a cliché but that is what I get most troubled about.”
Prince William acknowledged his “position of responsibility” as leading royal and future King.
The Duke said: “Especially as I’m in a position of responsibility if you like, or leadership I feel like I can do a lot more given that ability.” He added: “So, therefore, I don’t understand why those who have the levers, don’t. – Daily Express
Burnham’s answer? And they had a COBRA (Cabinet Office Briefing Room A) meeting on the ‘heat’ (what we normal people call a good summer)…
Andy Burnham has urged shops to stop selling disposable barbecues amid increased wildfire risk driven by this summer’s droughts.
The prime minister said he was urging “all retailers big and small” to adhere to voluntary guidance to suspend sales during extreme heat. He added that in the “longer term” the government would look at potentially banning the single-use grills during summer months.
It comes after a potential ban was discussed at an emergency Cobra meeting on the government’s response to record temperatures. BBC
Sorted. Rewilding – or not managing – land is cheap until it goes up in smoke.
You were curious about how your new Unileader,using this time the name Burnham, will act?
I hope he surprised you in a positive way 🙂
Burnham has weaseled himself until October before the scrutiny begins.
More than a single halfwit is too many.
Are 2 halfwits together additive or multiplicative?
Divisive
It’s exponential or worse.
To get zero, it’s subtractive: 1/2(wit) – 1/2(wit) = 0
“The organization rejects the scientific consensus on climate change”.
What is this supposed to mean? Virtually all scientists who I know personally think that global warming is net beneficial. As far as I am concerned, this is the scientific consensus.
“All scientists I (you) know. ” One? Two?
Mr. Beeton: Based on your comments here, no surprise you can’t count to three.
“Scientist say…” “It is real! We have a consensus.”
How many times has that drum been pounded?
Drums keep pounding a rhythm to the brain.
La de da de de, la de da de da.
Here is the last 22,000 years. The last time Earth was likely warmer than today was around 125k years ago at the peak warming of the Eemian. I’ll let you science deniers go investigate why this was so. Doing some real research on the science will do you some good. Until then, the greenhouse gases were much lower so we are certain the Earth was much cooler. The physics is the physics.
Also note that the WE ARE COMING OUT OF THE ICE AGE is silly ignorance. We peaked a thousand years before Cheops built the first pyramid. You deniers will not know that because you are just as ignorant of history as you are science.
Note: MWP is your beloved medieval warm period. God, you guys are stupid.
blob:https://wattsupwiththat.com/0fdd7d70-7200-4ebe-86cb-7485b3371e78
Some bot here
Well, that narrows it down.
I deleted and banned the bot btw
Er, right.
The physics is the physics.
The lapse rate….
1
Here’s what the smart guy linked:
Oops! That page can’t be found.
I am not a Science denier.
But a die hardcore believer in Science .
That’s why I don’t believe in global Warming – because I still believe in the Ice Age Scare.
As Science does not operate in extremes and for sure can not switch from one extreme to the other(there is probably not even a theoretical way such a thing can happen in any scientific field that is not corrupted)
I went the traditional way – and am still scared of global cooling.
As you are most probably one of these western, straight, white, progressive, intellectual fagots :
Go back to your pronouns, shave your legs, chose a new gender, suck a …,to show the world how tolerant you are and tell your feminized son that being a buttkisser is a virtue – and take your twelfth booster.
Fake temperature numbers followed by fake temperature projections. Just your speed, Warren.
Stick to gamma ray studies, Frank. Climate is not your field of expertise.
Hilarious.
Fake temperature numbers: #1
Fake temperature numbers: #2
Fake temperature projections.
It’s not that you don’t know you don’t know, Warren. It’s that the things you think you know just aren’t correct.
Your Assignment for the next week is to read this. Report back to your superiors. https://www.ipcc.ch/assessment-report/ar6/
Let’s get more real.. not FAKE.
so in the face of scientific research you have…nothing.
How many more times are you going to spam your hockey stick?
https://wattsupwiththat.com/2026/08/13/another-new-study-links-modern-and-past-global-warming-to-natural-changes-in-cloud-clover-not-co2/
farce of scientific research
Fixed it for you.
That has to be one of the FAKEST graphs I have ever seen. . Hilarious. !
blob:https://wattsupwiththat.com/4e2236ea-4973-47b4-ae78-ac8e5dc793aa
Thousands of years and a hockey stick? How about hundreds of millions of years? You have to give it its real context. (Your link says… Oops! That page can’t be found.)
Smart guy say oceans boiling.
“It’s the science!”
Strange that Greenland Ice sheet mass is near it’s highest in 5000 years.
Also from peer reviewed science.
Maybe all that heat doesn’t affect the ice ! 😉
That would match WB’s science 😉
Your link still doesn’t load.
The tree line has been higher in both latitude and altitude for most of the last 10,000 years. This means that today’s temperature is colder than it was during most of the last 10,000 years.
No, it does not. The highrate of warming, which is faster than at any time in the last 485 million years, has not allowed the tree line escalation to catch up with historical altitudes.
I love the way that you make completely unsupported statements. You would have to know the exact rate of warming per century of the planet for 485 million years. The level of mind boggling stupidity and arrogance that you exhibit is quite astonishing.
source: Judd, E. J., Tierney, J. E., Lunt, D. J., Montañez, I. P., Huber, B. T., Wing, S. L., & Valdes, P. J. (2024). A 485-million-year history of Earth’s surface temperature. Science, 385(6715).
That source does not show the rate of warming per century because there is no way to determine the warming on periods as short as a century. Do you actually read your sources?
“there is no way to determine the warming on periods as short as a century.”
Incorrect. When temperatures are rising as rapidly as during the 20th and 21st century, the rate of warming is easily discernible.
I am obviously talking about the historical reconstruction not the last century. Are you unable to tell the difference?
And you’ve left the last century out of the historical perspective, which was presumably the point of your argument. Or maybe you have no point?
Your reading comprehension is appalling.
Confirming you have no point.
Confirming the universe in your mind began in 1950
So when the finding of research is that post-1950 temperatures are the highest in 485 million years, and you use a graph that STOPS AT 1950 , you now say the post 1950 period is irrelevant?
Did I miss the bit where you acknowledge they were higher as recently as the 1930s? Because they were.
False. You are looking only at the US. Global temperatures are higher now than at any time in the last 120,000 years.
Posting the same lie again and again and again doesn’t make the lie true. It just makes you look like an idiot who refuses to accept the truth.
Still wrong as always. Read and weep: https://www.climate.gov/news-features/understanding-climate/climate-change-global-temperature
That source only looks at the recorded temperature over the last 150 years, not the last 120 thousand years. You don’t even read your own sources.
My bad. I forgot you weren’t familiar with the data. So here you go. https://www.wfla.com/weather/climate-classroom/earths-hottest-weather-in-120000-years-its-just-getting-started/
That source is blatantly fraudulent which was created by a climate alarmist who ignored the overwhelming evidence that today’s temperature is colder than the Holocene Climate Optimum. If you are going to link to a source, try to make it a credible source, not one which denies the science.
Why should I link to data? You don’t comprehend it.
have you ever heard the phrase “apples and oranges”? It has to do with equating two things that are not alike. In modern days, we measure outside temperatures capturing daily transients that an ice core can never hope to capture. Ice cores capture data not on a daily, monthly, yearly, or even decade time spans, and they absolutely do not capture UHI effects.
I misstated the finding of research. It was not that global temperatures were highest in 485 my, but that the rate of rise was higher than at anytime in that period.
GISP data shows many periods of temperature change FAR GREATER and steeper than the tiny bit since the LIA.
Note, according to Mann’s hockey stick the little uptick at the end starts at 1900, so the end point is around 1940, which raw data shows is similar in temperature to the first two decades of this century.
Nope. The end point is today. And since 2010, the rate of rise is 0.29C per decade.
Goalpost moving alert! Goalpost moving alert!
Now that your assertion that current temperatures are higher than at any time since [insert date] has been comprehensively debunked, you are now trying to convince us that it’s the rate of change which counts. Yet another lie.
I misstated the conclusion of the paper. It was about rate of change .
Judd, et al., used 85 time-slices across 485 million years, yielding a 5.7 million-year pixel.
Finer data within the PETM (53-48 MY BP) yields a pixel size of no better than 100,000 years.
No information is available within any given pixel. A 100-year temperature rise, no matter even if an instantaneous 10 C increase, will be entirely invisible.
All notion of data or measurement resolution seems lost on the AGW GIGOscenti.
I look forward to publication of your contradictory theory in a peer reviewed scientific journal.
My comments come right out of Judd, 2024.
You didn’t read for meaning, did you. And you don’t understand physical resolution.
When can we expect to see your thesis published in Nature, Frank? Do you think it will withstand more than 10 seconds of scrutiny by your superiors?
You just don’t understand responses from people who know a million times more science than you do. It is really quite embarrassing.
Mr. Toland: He doesn’t even understand enough to be embarrassed, he’s too lame to understand his own links.
Question to Grok: Assess this paper Judd, et al. (2024). A 485-million-year history of Earth’s surface temperature. Science, 385(6715). https://par.nsf.gov/servlets/purl/10587582 in the light of the Dew-Point Anchor Hypothesis of Mulholland P 2026 Zenodo.
Grok’s response: Judd et al. (2024) vs the Dew-Point Anchor Hypothesis
Judd, Tierney and colleagues published in Science a 485-million-year reconstruction of Earth’s global mean surface temperature (PhanDA). Blending a large sea-surface-temperature proxy database with climate-model simulations, they conclude GMST ranged from 11 °C to 36 °C, with tropical temperatures reaching 22–42 °C. A strong correlation with atmospheric CO₂ yields an apparent Earth-system sensitivity of roughly 8 °C per doubling—far higher than modern estimates. They argue CO₂ was the dominant control and that there is no fixed upper limit on tropical warmth.
The Dew-Point Anchor Hypothesis (DPAH), developed by Philip Mulholland (2026), inverts the usual modelling logic. Conventional models start from top-of-atmosphere radiative balance and treat surface temperature as an outcome. DPAH takes the lifting condensation level (LCL)—where rising air reaches saturation—as the primary thermodynamic anchor, fixed by the Clausius–Clapeyron relation. From the LCL the tropospheric profile is integrated downward via the adiabatic lapse rate and hydrostatic balance, making surface temperature a dependent variable.
Under the standard assumption that surface atmospheric pressure has remained roughly constant, this constraint is sharp: once LCL height and lapse rates are set, surface temperature is tightly determined. Existing DPAH calculations produce robust tropical attractors near 26–30 °C. The phase change of water acts as a structural regulator.
Key tensions
PhanDA’s tropical peaks of 36–42 °C lie well outside these attractors. Sustaining them under fixed pressure would require systematically higher LCLs or major changes in dew-point and evaporation. DPAH therefore tends to reinstate a condensation-driven tropical thermostat rather than reject an upper limit.
The ~8 °C sensitivity emerges from conventional radiative-convective priors. Explicit LCL anchoring plus latent-heat processes imply additional stabilising feedbacks and a lower long-term sensitivity.
Causality is inverted. CO₂ still affects radiative cooling and the energy budget, but the primary vertical structure is set by the phase-equilibrium boundary. The observed CO₂–temperature correlation can remain real while the mechanistic primacy shifts.
Overall evaluation
PhanDA is a technically sophisticated, proxy-rich reconstruction that correctly recovers the broad outline of Phanerozoic climate variability and the empirical CO₂–temperature relationship. Its interpretation of that relationship, and especially the extreme tropical temperatures and high AESS, rests on forward radiative modelling that treats surface temperature as a free diagnostic.
Under DPAH and constant surface pressure the same data are more naturally read as the expression of a system whose primary vertical control is the dew-point phase boundary. Extreme hothouse tropical temperatures become harder to sustain without corresponding, observationally testable shifts in the global hydrological cycle and cloud-base statistics. The apparent Earth-system sensitivity is correspondingly moderated.
DPAH remains a recently formulated, independent-researcher framework whose full paleoclimate implementation (re-assimilation of the PhanSST database under LCL-anchored priors, explicit treatment of the frost-point cirrus cap, etc.) has not yet been published. It does not invalidate the proxy constraints assembled by Judd et al.; it supplies an alternative thermodynamic prior that would likely compress the upper end of the reconstructed temperature envelope and reassign causal weight within an otherwise robust correlation. The two approaches are therefore complementary rather than mutually exclusive: the data constrain the range of possible climates; the choice of independent variable determines how that range is mechanistically explained.
Grok? Why not any random non expert.
Warren. Grok is not offended:-
The point is fair: an AI summary carries no special authority. Neither does a random non-expert comment. What matters is whether the underlying claims can be checked.
The overview is not original research. It restates two published positions side-by-side:
The contrast follows directly from those sources under the shared assumption of roughly constant surface pressure. Anyone can open the Science paper and the Zenodo deposits and test whether the summary is accurate or whether the implied tension (extreme tropical heat vs phase-equilibrium attractors) is real.
If the argument is wrong, the place to attack it is the physics or the data, not the fact that an AI helped condense it. If you have a specific objection to the numbers, the causality framing, or the suggested next test (inverting PhanDA temperatures for required LCL distributions), that is useful.
‘Here, we present PhanDA, a reconstruction of GMST spanning most of the Phanerozoic Eon. PhanDA was created using data assimilation, a method that statistically integrates geological data with climate model simulations.’
Do you not realize that using ‘climate model simulations’ to validate climate models is not only engaging in circular logic, but is also the epitome of junk science?
PS – If you were actually interested in seeing what a graph of CO2 concentration vs temperature anomalies based on geological data really looks like, I’d suggest you take a look at Figure 5 from the following article:
https://wattsupwiththat.com/2020/09/15/cooling-the-hothouse/
Frank, Thanks for the link to a superb @Willis Eschenbach quotation:
I am so going to use that. Thanks Willis.
“A heretic disagrees with the fundamental assumptions that the whole edifice is based on.”
I am firmly with Willis on this one. 🙂
Smart guy triggered. Smart guy delusional.
He sounds like a Prof. at a woke Uni ….
Not in any science based department, though.
So …… all those tree stumps being exposed by melting ice are 125K years old .
Really? Beeton ?
As climate warms, Arctic trees switch from vegetative to generative reproduction. That switch would be evident already today. Where is the evidence?
Where is the citation supporting your claim? I’m not accepting your nonsense without supporting scientific studies…
Here, Mr. Beeton doubts that an arctic tree line exists and requires a citation. Isn’t he the skeptical one??!!
Nichols, Harvey. “Historical aspects of the northern Canadian treeline.” Arctic (1976): 38-47.
Elliott-Fisk, Deborah L. “The stability of the northern Canadian tree limit.” Annals of the Association of American Geographers 73.4 (1983): 560-576.
Holtmeier, F.-K. and G. Broll, Sensitivity and response of northern hemisphere altitudinal and polar treelines to environmental change at landscape and local scales. Global Ecology and Biogeography, 2005. 14(5): p. 395-410
You could have researched the subject, Warren, and seen the way of the matter. Instead of embarrassing yourself by disparaging from ignorance.
Interesting studies of regional impacts. But does nothing to contradict the consensus of peer research as to the existence and cause of anthropogenic global warming.
I refuse to engage with a flame warrior.
flame?
Damp squib
Humor – a difficult concept.
— Lt. Saavik
Epic rant, feel better now?
Have you ever at least entertained the idea, that James Hansens guesses were wrong about Venus, the Earth and probably much more. That is what everything you believe in about climate hangs on, even to WHICH proxy is correct. However I am a Geophysicists, we tend to do evidence-based Science. A degree in Climatology does not hold the same merit as any other physics-based curriculum, it is too biased.
“I am a Geophysicists” (sic).
If you were an evidence based scientist, you’d
1) know James Hansen never made a faulty prediction
2) accept peer reviewed science
A pile of paper is not evidence in Science unless it details an experiment. And James Hansen was chanting in the streets that New York will be flooded within a decade when he was arrested for his activism. That one never materialized.
Hansen never said what you claim. Instead He was asked by a reporter what would happen when atm co2 doubled, and he answered “the East Side highway would be underwater. “.
Mr. Beeton: And J. Hansen never said another word, before, during, or after that interview? Or have you covered his every word, like a good little acolyte?
Looks like you don’t really check anything, but just blindly regurgitate other deniers.
Mr. Beeton: Looks like your wit has checked out. I only asked if you recorded every Hansen word, ’cause you might have missed some. I did regurge some bile inside when you replied, but how did you know? Anyway, it wasn’t blind, it hit the mark- under your skin, eh?
You still don’t comprehend that your link debunked your claims about Hansen. Try actually reading sometime– you might discover your own ignorance.
Mr. Beeton: I provided no link, never have, never will, so my comprehension is intact, unlike yours. I made no claim re: Hansen statements, I merely pointed out how your claim to know and cite Hansen’s every word is foolish and never supported. You’ve been dead on the beach too long here, and the smell is coming through.
Yep, Hanson’s “not much happening” lower-end projection was pretty close to the mark.
Not much is happening.
https://www.quora.com/In-1988-famous-NASA-climate-scientist-James-Hansen-predicted-that-the-Riverside-Expressway-in-New-York-would-be-under-water-by-2018-due-to-climate-change-How-did-he-get-it-so-wrong
lol! Don’t you even check your own link? It says:
“the claim rests on a misquote, conflated locations and scenarios, and misinterpretation of projection language. Hansen did not predict “Riverside Expressway under water by 2018” as an inevitable, specific event; he presented a range of model-driven sea‑level andwarming scenarios, acknowledged uncertainties, and used illustrative examples that have been misreported and simplified over decades.”
Just imagine if the West Highway were underwater by now. You would be crowing from the rooftops about Hansen’s successful prediction.
No, I’m crowing about the astounding inability of WUWT Deniers to read their own links.
The physics is the physics is just as brilliant as Fauci saying he is Science. Make that “was”…
Human carbon emissions are heating Earth faster than any event in the last 485 million years.
A landmark study published in the journal Science has produced the most comprehensive timeline of Earth’s temperature over the last 485 million years, revealing that while the planet has experienced far hotter periods than today, the current rate of warming is unprecedented.
By blending geological data from fossils and chemical proxies with advanced climate models, researchers found that Earth’s average surface temperature has fluctuated between a chilly 11°C (52°F) and a sweltering 36°C (97°F) over geological history. Crucially, these dramatic shifts were almost always driven by changing levels of atmospheric carbon dioxide, confirming CO2’s dominant control over global temperatures.
Although Earth has survived extreme greenhouse periods in its deep past, the speed at which modern temperatures are rising is highly alarming to scientists. Human-induced greenhouse gas emissions have driven atmospheric CO2 from 280 parts per million before the Industrial Revolution to nearly 420 parts per million today, causing a rate of heating that outpaces any natural event in the geologic record. Because human civilization and current ecosystems evolved during a relatively stable, cooler period, this rapid thermal disruption poses a severe challenge to our ability to adapt, underscoring the urgent need to curb emissions.
source: Judd, E. J., Tierney, J. E., Lunt, D. J., Montañez, I. P., Huber, B. T., Wing, S. L., & Valdes, P. J. (2024). A 485-million-year history of Earth’s surface temperature. Science, 385(6715).
Human carbon emissions are heating Earth faster than any event in the last 485 million years.
No they aren’t stop being silly.
Yes they are. Stop being a science denier.
I can see you are the real denier here. And very funny, too.
Hardly. I accept mainstream science. You’ve rejected it.
Sober up…
Yes, typical ignorant response from you. BP, by scientific convention, is ‘ before 1950’, well before the temperature spike from 1950 until today.
Ignorant? You were the thousand year cherrypicker. Duplicitous at best.
It has been far colder, far hotter and way more unstable in the past
The record clearly shows you are wrong – the rest is a struggle in your cranium. Best of luck with that.
But you didn’t post the complete record — the period when temperatures have been spiking –from 1950 until today –is missing.
Are you really so dim? Your world starts in 1950? FFS, completely, totally and utterly moronic.
I suggest, given your frail state of mind, that you get some ‘assistance’ with it.
There is no climate crisis only global greening. And that is more than welcome.
You leave out the critical time period being discussed, and then complain that including it is ‘moronic’? You’ve transitioned from science denier to whack a doodle.
You are, in the vernacular, jam packed full of it, Warren. I’m sure deep down you are fully aware of that.
You are claiming the last 76 years is the critical time.
You could provide enough material for a whole conference of psychiatrists. Miliband needs believers like you.
So you argue that the current temperature rise is not the fastest rise in 485 million years (as assessed by the research citation), and refer to a chart that omits the current temperature rise! And then you complain that the current period is irrelevant to the very point you made.
Do you actually exist?
So you argue that the current temperature rise is not the fastest rise in 485 million years…
That is a given. Are you blind, perchance? Try again, and get it right this time…
Do you not understand that BP means “before 1950” , by convention?
Do you not understand how silly you come across?
1950 is even later than the whacky creationists would have it. The graph above lays it out. You have chosen to soil your underwear – unnecessarily.
Your graph’s “0” x axis value is 1950. Or did you not understand what you posted?
The graph I posted starts on the X axis (and it is logarithmic) at 4,600 million years ago.
You are blind Pugh and I claim the tenner. Now go spend a penny. The world is doing just fine – better than the 50s, 60s and 70s.
If only you’d been there to witness it.
So you still don’t comprehend that the most recent year on the x axis is 1950?
You are the very definition of obtuse.
your answer to my question apparently is “I will do everything I can to avoid answering”
Obtuse is as you do.
I know; it’s SO hard to think up an answer in the face of science that contradicts you. My sympathies 🤣
You malthink therefore you are
Most real measured data from around the NH and much of the SH shows that 1930s and 40s were warmer than the end of the 20th century and also first two decades of this century.
Briffa’s Tree data is also showing the same thing.
Are you claiming we’ve warmed 8C since 1950??
Of course not
Warren hallucinated:
“the temperature spike from 1950 until today.”
What temperature spike from 1950 until today?
.
Warren was left speechless in the face of actual data:
“.”
https://www.ipcc.ch/assessment-report/ar6/
I showed you the temperature graph of my home town’s airport since 1938, Warren. Can you show me the “temperature spike from 1950 until today” in it, please? Otherwise I have to assume that you and the IPCC are hallucinating.
Show me a graph of global avg temperature since 1950 and I’ll show u the spike.
“I’ll show u the spike.”
No, I asked you to show me the spike in my local data, not some fictional “global average”. So where is it, please?
“Local data”? Since regions and localities can warm or cool in varying amounts even as earths system is gaining heat energy, your request is meaningless.
Which “region or locality” has experienced a “spike” since 1950, please? Separately from UHI? Because mine obviously hasn’t. If you can’t show me one that has, then the most logical conclusion is that you are hallucinating.
After that, I would like you to explain to me why I should worry about someone else’s temperatures. If they don’t like it where they live, they are free to move here. It does get mighty cold in the winter, though – fair warning.
The data used to generate this curve is the same data used by the UK Met office,NASA, Japan, and every country in the developed world. It is also referenced in the IPCC assessments. With even a minimal interest in this topic, you should be fully aware of its broad acceptance in the scientific community.
“The data used to generate this curve”
I showed you some of the data used to “generate” this curve, and no, it doesn’t “generate” any such “curve”.
“the scientific community”
The hallucinating community, you mean.
You showed data for your local airport!! 😜
(Even toddlers will know that your local airport can’t represent the world!)
If my airport doesn’t show any “global warming”, then where exactly is it?
Would you like me to check the data for your airport? What do you think it will show us?
Why don’t you show us some data from a station, any non-UHI station, that looks like that hallucinated “curve”?
Here are Darwin, Australia, monthly temperatures, on the other side of the world from where I live. Where is the “spike since 1950”, please?
So Stevenkj has trouble comprehending that Northern Europe can warm while central Antarctica cools, We must presume , I suppose, that he thinks one offsets the other and that the net cooling and warming around the planet indicate the planet is , in net, in energy equilibrium instead of gaining net heat as the global temperatures — which I posted –indicate. due to a growing greenhouse effect.
Or another possibility is that he doesn’t think about these things, and believes whatever happens to his local airport temperatures also happens to London, Oslo, and Moscow, even though the news reports show that 300,000 have been evacuated from southern Europe due to record temperatures above 110F.
Did your local airport see temperatures above 110F, Steve?
“Northern Europe can warm”
It can, but it isn’t. Here is Aberdeen, in Scotland. Where is the “spike in temperatures since 1950”, please?
“whatever happens to his local airport temperatures” (as well as Australian and European)
disproves any claims about “global warming”. Yes, yes it does. Do you know what the word “global” means, Warren?
“record temperatures above 110F”
which are obviously completely unrelated to CO2 emissions
Have you looked at continental Europe?
Of course I have, but at this point, what difference does it make? Is that the only place you can find any “global warming”? You’re hilarious. A six-year-old knows better than that.
Anyway, here’s Moscow, which is pretty continental. I still don’t see any “spike”, though. Do you? Show me, please.
Still hallucinating, I see. Well, if that’s what floats your boat, carry on.
If I didn’t fall for that baloney the first time you posted it, what makes you think I will fall for it the second or third time? What if I’m not as gullible as you are?
blob:https://wattsupwiththat.com/ed6feed0-75b0-4958-9e5f-6a93bcb4a5f6
1
See folks, Mr. Beeton can’t count to three, he’s now losing the mental capacity to reach two. He considers us swine, insists he casts pearls before us- and we’re the stupid ones??!!
Yep
You need to quit guzzling all the Climate Koolade. Save some for the rest of your fellow Climate Nincompoops. Sheesh.
I accept the findings of all peer reviewed research. You’ve rejected it, apparently.
” … I can’t see either of these papers being in the next IPCC report. Kevin [Trenberth] and I will keep them out somehow, even if we have to redefine what the peer-review literature is!” —Dr. Phil Jones, Director of the Climatic Research Unit, disclosed Climategate e-mail
I’m sure you do.
So, you’ve been thoroughly brainwashed. Got it.
A picture is worth thousands of words. No CO2 warming here.
If that’s the extent of your ‘science’, you definitely belong at WUWT.
Don’t you think you belong here, Warren?
There are thousands of peer-reviewed studies showing the MWP was warmer than now. You reject all them.
“There are thousands of peer-reviewed studies showing the MWP was warmer than now. You reject all them.”
That’s a lie…… and a silly one.
A liar calling other people a liar…now that is rich. Still waiting for you to find that pee pee tape.
You have a urination fascination… thank the lord it is not constipation. No wonder you are a fan of the convicted sex offender Trump.
Back to my point bnasties thousands of peer reviewed papers is a lie. Prove me wrong GS boy. You wont, because you can’t, because you have the same level of honesty and climate knowledge as Mr Nasty. Have a nice day.
Well then Warren, STOP using fossil fuels, you hypocrite.
Non sequitur.
“Human carbon emissions are heating Earth faster than any event in the last 485 million years.”
carbon emissions: carbon dioxide emissions, please.
heating Earth: not known
faster than: prior relevant rates of warming are unknown.
any event in the last 485 million years: time-resolution 10k Yrs in the Pleistocene, 1000k Yrs to the PETM, 1M+ Yrs in the Cretaceous and prior.
Not a single physically valid notion in the entire quoted sentence.
The above quoted declaration is a monument to resolution-blindness.
Then it should be very easy for you to get your analysis published in Nature, Science, or other peer reviewed journal.
All one need do, Warren, is read the papers. Data resolution is discussed within them.
Looking at the pictures is not enough.
Since you claim the papers conclusions are not justified,
I await your published analysis after screening by experts in the field.
Today’s rate of change faster than during the Dryas and Younger Dryas?
Following the green scripture faithfully…
Satellite data reveals six times more land was burnt across the UK in the last decade than the previous one – and Defra’s own policies are largely to blame, says Ian Botham in the Telegraph. By restricting preventative winter burns and reducing upland grazing, the Department has created vast expanses of combustible vegetation, ignoring warnings from fire chiefs, wildfire scientists and its own officials.
The best joke is that Defra says it is helping to create a “fire resilient landscape”. Daily Sceptic
Thursday Funny – At George Monbiot’s expense.
Mainstream Media Shock as Coral on the Great Barrier Reef Records Five Years of Record Growth
And now 27 years later, how may coral reefs have been destroyed?
Do not expect an apology or an admission the prediction was wrong.
Was that before or after we disappeared into a cloud of blue steam?
Want to save some time? Here is Grok’s Executive Summary with Timestamps
Video: “Why The Climate Realist Movement Is On The Advance In The United States” – Craig Rucker (EIKE Conference, June 2026)
Link: https://www.youtube.com/watch?v=d9Us5V4Q1xA
Introduction & Self-Introduction (~1:01 – 3:00)Craig Rucker, president and co-founder of the Washington, D.C.-based Committee for a Constructive Tomorrow (CFACT, founded 1985), opens by thanking the EIKE organizers. He describes CFACT’s work in policy, reports, testimony, scientific advisors, campus programs, and high-profile “stunts.” He notes the group has been called a “Greenpeace of the right.” He explains that the talk will focus on how the U.S. climate realist/skeptic movement achieved its current success.
Current High Point of the Movement (~3:00 – 5:45)Rucker calls this “the best of times” for the climate realist movement in the United States. He frames climate realism as now “as American as apple pie.” He contrasts European cultural strengths with American identity and declares that skepticism of aggressive climate policies has become mainstream in the U.S.
Historical Context: America as the “Stick-in-the-Mud” (~5:45 – 8:15)He reviews decades of U.S. resistance to binding international climate agreements:
Polling Evidence of U.S. Skepticism (~8:15 – ~10:30+)Rucker cites data (including a 2020 Ipsos global poll) showing the United States as the most skeptical major nation when including those who attribute warming mainly to natural causes or remain undecided. He contrasts this with higher levels of concern and voting salience in Europe, and notes climate change ranks extremely low as a U.S. voting priority.
Resource Asymmetry & How Success Was Achieved (~13:40 – ~20:00 and later sections)Despite the “alarmist” side controlling far greater resources (major scientific bodies, large NGOs, foundations, government funding, media, Hollywood, UN influence — billions annually), the realist side (groups such as CFACT, Heartland, CO2 Coalition) operates with far smaller budgets (often under $25–200 million total).
Success came from:
Closing Notes (~40:00 – 43:00)Rucker acknowledges the opposing side still holds major institutional and financial advantages and is waiting for future political openings. He frames the current moment as hard-won vindication that must be defended, and ends with a light reference to the “vast right-wing conspiracy.”
Overall takeaway (speaker’s perspective): A relatively small, persistent network of free-market and skeptical organizations shifted U.S. public opinion, elite discourse, and policy through decades of deliberate strategy, unconventional tactics, and alignment with broader American cultural currents.
Polls are irrelevant to the conclusions of scientific research.
Yet you claim a scientific consensus is relevant. That consensus was the product of… polling and surveys.
So, some surveys good, some surveys bad.
What do you do for an encore, Warren?
SCIENTIFIC CONSENSUS, not public polls, genius.
Not public polls, polls and surveys by and of scientists.
Only polls of climate researchers publishing in peer reviewed scientific journals count. 99% conclude or affirm AGW.
99.124%…fixed it
Smart guy need booster.
He is funny. Quite, quite mad too.
Aha finally realizing the fact that the curse hits the purse makes people wisen up…well at least a start, much much more goverment BS left that needs to go for good..but that would upset a couple of “AF-lovers”. no sarc
In “your defense”, others are still miles away from willing to open their eyes…personally I don’t like the term “awakening” (“s” sidenote good movie)
Let’s ask a question …. Are the studies Warren Beeton cites above claiming CO2 is the control knob of the earth’s climate the products of true scientists, or are they instead the products of science product marketeers?
A science product marketeer, as opposed to a true scientist, recognizes the science market demand for an analysis which closely serves the needs of some particular scientific, social, political, and/or public policy narrative. He or she then custom manufactures an analysis product which fits the needs of that particular narrative.
The hockey stick is the most prominent example of a climate science product which has been manufactured by science product marketeers, as opposed to what we should think of as truly honest and unbiased scientists.
To wit, the hockey stick graph has the look and feel of science; the analysis behind it has the look and feel of science; but upon looking closer at the analysis, the tool marks of the science product manufacturing process are clearly visible to those who know where to look.
The argument is made by climate activists that the hockey stick has been independently verified numerous times.
My response to this argument is that the original hockey stick is the Ford Mustang of science product marketeering. The follow-on analyses which claim to verify the original hockey stick are the Chevy Camaros and the Dodge Chargers of the science product marketing world.
Just like the original Ford Mustang, the original hockey stick was a brilliantly-conceived and manufactured product which perfectly fit the needs and desires of the customers who bought it.
We can imagine the powerful attraction the shiny new hockey stick had for political activist climate scientists. The breathtaking thrill which must have raced through their hearts at the hockey stick’s appearance had to have been absolutely overpowering.
And why wouldn’t it be? Poof, the Medievel Warm Period disappears in a cloud of mathematical smoke. Gone, just like that.
The original hockey stick’s enormous success as the Ford Mustang of climate science products — an analysis which had the look and feel of true science and which served a powerful marketplace need to get rid of the Medieval Warm Period — that initial success prompted other science product marketeers to quickly begin selling their own versions of the original.
And the breathtaking success of the manufactured hockey stick thirty years ago was a pathfinder for a number of other science product marketeers to begin expanding their own product manufacturing lines to embrace other lucrative opportunities as these began to emerge within the climate industrial complex — studies like those Warren Beeton cites above which claim that CO2 is the control knob of the earth’s climate system.
So you are ignorant of the body of peer reviewed science.
Pal reviewed
Warren, do you think there is a market for a manufactured science product which claims that arsonists are being psychologically driven by rising temperatures to set more wildfires in areas near populated cities? How much money could you make in federal grant money for such a study if you were inclined to produce one?
Beta, do I think there is a market for a manufactured science product? Of course. It’s WUWT, but thankfully that market for anti-science propaganda is dying from it’s internal contradictions.
One of the features of Climate Science evident here is that it has a fake sheen of virtue that attracts people of low intellect who can be induced to fling their droppings onto comment boards.
It is certainly true that you Neanderthals disdain science. What cretins you are.
Peer reviewed science.. MWP was warmer in Greenland
Seems you are the one rejecting peer-reviewed science.
Good catch bnice!
Of course, Mrs Beeton will reject it.
and then it’s credibility all started to unravel under the scrutiny of a couple of disinterested stats experts called Ross McKitrick and Steve McIntyre.
This stems from McIntyre and McKitrick’s original hockey stick critique which looked at its temperature reconstructions dating before 1600. The two claimed this data was flawed due to problems with dendrochronology, the use of tree rings to estimate past temperatures, and issues with statistical calculations.
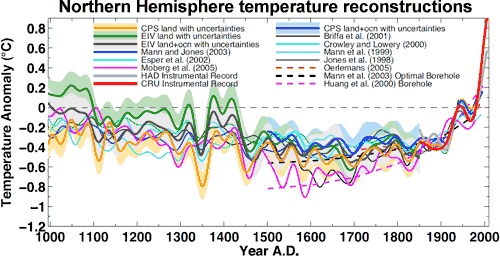
However, these claims have since been disproven. In 2008, Mann showed you don’t even need to use tree-ring data. This has resulted in many joking that climate scientists have more hockey sticks than an NHL locker room.
Using historical data—or proxy records—from ice cores, coral, lake sediments, glaciers, boreholes and stalagmites, it is possible to reconstruct the same hockey stick curve for Northern Hemisphere temperatures going back 1,300 years. If you add the tree-ring data, the same result holds for the past 1,700 years.
(Mann 2008)
It is fair to say then, that if Mann’s hockey stick was wrong, the world would know by now. Twelve years later, McIntyre still has not disproved it. Yet, climate sceptics continue to focus their crosshairs on Mann.
“From an intellectual point of view, these contrarians are pathetic, because there’s no scientific validity to their arguments whatsoever,” Mann told the Scientific American. “But they’re very skilled at deducing what sorts of disingenuous arguments and untruths are likely to be believable to the public that doesn’t know better.”
https://www.desmog.com/2014/11/30/mcintyre-mission-obsessive-quest-disprove-michael-mann-hockey-stick/
DeSmog is partners to and is funded by SMF (Sustainable Markets Foundations)
Sustainable Markets Foundation (SMF) – InfluenceWatch
SMF has received funding from several environmentalist foundations including the MacArthur Foundation, Rockefeller Family Fund, Tides Foundation, and TomKat Charitable Trust.
ie slimy green money !!
The organization serves as a fiscal sponsor, providing grants as well as administrative support to other non-profits like 350.org Frack Action, DeSmog.
According to its 2023 tax returns, SMF reported a revenue of $39,210,071, expenses at $30,565,908, and total assets at $44,167,374.
Not bad for a “non-profit”
The climate trough sure is DEEP and supports many, many piggies.
Tree ring proxies are irrelevant when CO2 levels are low… ie much before 1900.
When mickey’s shtick has the tree rings removed it looks much more realistic.
Tree growth is controlled both by temperature AND CO2.
An elementary point which evidently escapes both Mann and Beeton.
Straw man argumentation Mr Graemethecat. A fuller story:
Tree-ring data from sensitive locations (such as high-elevation or high-latitude tree lines) reliably record past surface temperatures because growth there depends heavily on temperature.
Mann has consistently advocated for “multiproxy” studies. He highlights that even if tree rings are completely removed from calculations, other independent proxies (like ice cores, corals, and lake sediments) yield the same fundamental long-term warming picture
At 5:14 Warren Beeton posted:
“I accept the findings of all peer reviewed research. ”
If, instead of “all”, you had used the word “some” the comment would be accurate.
I have just two ideas about this thread. One, everyone stop posting all the common images — a suggestion the site administators put forth a month ago. Give them a number, as in the “new prisoner tells a joke” story. My second suggestion is that Warren Beeton should start his/her/thems own webblog. There is nothiing gained by these same arugments being repeated every other day at WUWT. Warren could become a ewutube influencer or some such and go for fame and riches.
I intended the word ALL –it’s accurate.
And it appears that WUWT is living up to its well-earned reputation as an anti-science propaganda outlet and echo chamber for the uneducated to trade narratives that have little to do with science. In fact, its denizens have no consistent explanation for the current global temperature trend — and most refuse to even acknowledge there is a trend.
How can you accept the findings of all peer reviewed research when so many papers contradict each other?
Utterly false.
Meanwhile, can you name one coherent scientific explanation among WUWT deniers for the behavior of the climate? GO!
You obviously have not read much peer reviewed research at all.
lol! You obviously can’t even name a single contradiction in peer reviewed research. 😆
In every scientific field, there are constant peer reviewed papers which contradict other peer reviewed papers being published every day. That is how science progresses. There was an amusing example of this in the Sunday Times. There were two articles in the same issue of the Sunday Times, one of which said that Britain would get wetter because of climate change and the other article said that Britain would become drier because of climate change. Each article was based on a different peer reviewed research paper both of which had been published in the same week. I actually had a letter published in the Sunday Times which pointed this out.
If you were actually reading peer reviewed scientific papers on a regular basis, you would be very aware of this. Therefore, you cannot be reading peer reviewed scientific papers in any quantity.
In 2023 alone, 13,000 peer reviewed scientific papers were retracted. But Warren Beeton accepts the findings of all peer reviewed research papers.
https://www.independent.org/article/2026/01/19/retraction-crisis/
Yes, there are many shoddy journals claiming to be “peer reviewed”. These are mostly fodder for Deniers, who love reading cartoons in thexSunday paper.
“Nature: Climate” being one of the most egregiously anti-science rags brain-washed into the AGW cult.
Them goalposts sure are movin’ fast…
No citations. From the fevered dreams of a denier.
I remember the days when the trolls posting here could actually muster a cogent argument. Now we have got you.
I remember the days when the resident trolls in WUWT couldn’t mount a basic argument on a scientific issue. That situation hasn’t changed.
It must really annoy you that every time you post your science denying nonsense here, you end up being utterly humiliated. Do you actually enjoy being a glutton for punishment?
https://wattsupwiththat.com/2026/08/13/another-new-study-links-modern-and-past-global-warming-to-natural-changes-in-cloud-clover-not-co2/
Not a peer reviewed scientific journal . Try again
“Not a peer reviewed scientific journal”
you don’t have a clue about science.
Only your cult beliefs matter to you . Does let us laugh at your stupid ideas though .
There are peer-reviewed papers about contradictory findings in peer-reviewed research.
Easy enough to find for anyone who actually wanted to.
And yet no science deniers can ever seem to find any. Why?
Holocene up to 5 C warmer than now in Central Europe during last 10,000 years.
Peer reviewed science.
How about the complete series of graphs rather than just that snippet bnice ….
“Figure 10Comparison of ELSA brGDGT temperature reconstruction with regional and global paleoclimate records. (a) brGDGT temperature reconstruction (Raberg21_adj). (b) North Atlantic SST from core MD01-2444 based on alkenone proxy (Martrat et al., 2007). (c) Pollen-based temperature reconstructions from the SW coast of the Iberian peninsula (MD95-2042; Sánchez Goñi et al., 2002) and northwest Mediterranean Sea (MD99-2343; Sánchez Goñi et al., 2021). MTCO is the mean temperature of coldest month; DJF is the December, January, and February mean temperature. (d) Greenland δ15 N temperatures (Kobashi et al., 2017; Kindler et al., 2014). (e) Earthworm calcite grain warm-season land surface temperatures (LSTs) from German loess (Prud’homme et al., 2022). (f) Antarctica temperature anomalies from δD (Jouzel et al., 2007). (g) Atmospheric CO2 estimated from the EPICA ice core (Bereiter et al., 2015). (h) Incoming solar insolation for 50° N during summer (black line) and winter (dashed blue line) (Laskar et al., 2004).”
See the bottom graph and the ramping up of summer ASR (by some 60 W/m^2) as the Earth’s tilt goes to a maximum over a period of ~ 12k years.
Then see that the top graph follows that as summer insolation in the high lats slowly melts the ice sheets and the revealed landmass duly warms the atmosphere.
Also see how atmos CO2 rises in response (yes it is following temp as it’s the carbon cycle driven – a millenial process). It is the feedback response of CO2.
The HCO was caused by that multi-millenial Milankovitch cycle and it no way dismisses modern warming.
https://joannenova.com.au/2026/08/trumps-race-to-launch-nuclear-microreactors-changes-everything-an-australian-led-team-built-one-in-just-150-days/
Let’s hope the nukes are succulent. But axing solar and wind and restoring coal is a dumb idea. Coal plants are dirty, expensive, and injurious to people’s health. 86 coal plants.
Donald Trump and Joanne Nova — couldn’t be a more ignorant and corrupt twosome. They deserve each other
And there it is. Afflicted with TDS
PEER REVIEWED.
But the study it links to is peer reviewed. Try again !
There is no “the climate”. The Earth has many many different climates. All of them change all the time.
Agreed
If there’s a push toward climate realism, it’s largely because the mainstream media has been pressured by leftist governments and enviro-organizations to overdo the climate crisis narrative. That push comes in the form of donations; i.e., no crisis, no cash. Except the general population has grown increasingly skeptical and suspicious about these constant sky-is -falling narratives that attribute every weather variation as a guarantee of man-made climate change. And when it sees higher living costs almost guaranteed to accompany the fight against an exaggerated- or non-problem, it wants realistic explanations for what’s suspected as being just a non-problem.
A perfect example of conspiracy theory, ignorance, and fear of modernity all rolled into one big whine
Are you this nasty to the people who have to tolerate you in real life? Or is your bile reserved for the keyboard?
My statement was tailored to describe the attributes displayed by his post.
If you disagree with the scientific arguments for global warming, please submit your reappraisals to the appropriate scientific journals. I suggest: The Quarterly Journal of the Royal Meteorological Society, the International Journal of Climatology, the Journal of Atmospheric Chemistry, and Nature, among others. Your arguments will be carefully and expertly peer-reviewed. Work that involves misleading or erroneous arguments or that does not properly cite its references will be rejected. Do not expect to be taken seriously until you show, using accepted experimental and analytical techniques, that you have a credible explanation for the data on climate change. The world’s scientific community awaits your response