Century-scale patterns of solar activity suggest the onset of the next Little Ice Age cooling period is here.
Newly published research utilizing historical solar magnetic field phase analysis documents the impact of solar activity on Earth’s temperature.
Cold “Little Ice Age” periods can be reliably linked to Grand Solar Minima (GSM).
For example, during the Maunder Minimum (late 1600s to early 1700s), solar irradiance is thought to have declined by about 3 W/m², and consequently the Northern Hemisphere cooled by approximately 1°C.
Using pattern analysis, it may be assumed that the onset of the next GSM has arrived, and global cooling will be realized over the next few decades.
“During a GSM a reduction of solar irradiance is expected by about 3 W/m² from the modern level that causes a decrease of the average terrestrial temperature by about 1.0C.”
“In summary, it can be concluded that the modern grand solar minimum (2020-2053) predicted 10 years ago by Zharkova et al, 2015 has arrived and will progress as expected until the mid of century. There is the cold weather with huge frosts and snows recorded in January- February 2026 in the whole Northern hemisphere from the West to the East and from the North to the equator. The little ice age associated with the modern grand solar minimum is here…”

Image Source: Zharkova, 2026
I’ve often suspected that the typical ice age pattern would be bringing on a cooling period and wondered how the climate warriors would adjust their panics. But I don’t put much more stock in this cooling prediction than I did for the 1970s one, or the current warming panics.
At least they’ll have other words to mouth for a few decades, AND something new to keep distracting them from their real problems.
Not so sure about the approaching “Grand Solar Minimum”


So far cycle 25 is more energetic that cycle 24 was
Cycle 24 from Spaceweather(dot)com
Current Cycle 25 from WIKI
Forget the “You are Here” flag on the cycle 24 chart. That’s from when the snag was taken back in Feb 2016 though well after the cycle peak. 😉
So far the progression looks like a clone of cycles 12 and 13 which if follows could make the potential cycle 26 similar to cycle 24.
Not seeing a “Grand Minima” at least not to my reckoning.
Thanks for posting this! I was going to comment but didn’t have time to track down the current data. I knew cycle 25 was stronger than projected so the grand minimum can’t be claimed until we see cycle 26 peaks.
I hope Zharkova is correct being an avid powder skier. This ski season in the western US was one of the worst ever.
You shouldn’t put much stock into it until the evidence indicates it’s happening.
Usoskin et al 2014, Evidence for distinct modes of solar activity defined a grand minima as decadal sunspot activity around 20 SN (v1), or 33 SN (v2).
For Zharkova to be right about a GS Min by 2053, sunspots must be very low in the next 2 cycles.
Tbe artcle reports, “This envelope curve defines the grand solar cycles separated by grand solar minima (GSMs), similar to those observed in the past: Maunder, Wolf, Oort and other grand minima. There are the two modern GSMs approaching: GSM1 (2020-2053) and GSM2 (2375-2410).”
I’m looking forward to seeing some cooling simply to refute the CO2 Climate Control knob claim; but GSM2 fits the Bond cycle timing better for LIA level minima.
“I’m looking forward to seeing some cooling simply to refute the CO2 Climate Control knob claim;”
That is the ONLY reason for hoping to see some cooling.
Exactly only more so. Warmer is better. Cooling is disastrous. Refuting kooks and fraudsters is not a good reason to welcome global tragedy.
That’s why he said it’s the ONLY reason.
Zharkova’s approach is sound, but accuracy is limited by the length of the synoptic dataset. Still, the 330-380 year envelope (midpoint 335 years) of her summary curve is consistent with the 356-year 2nd subharmonic of the Jose cycle (178 years), the 10th harmonic of 3560 years and the 13th harmonic of 4627 years as described in my paper: A 3560-Year Jovian Solar and Climate Cycle.
So, are we headed into a solar minimum and cooling? It’s possible. It’s also possible that we’re just in a global pause until ~2040.
Based on the 3560-year repetition in climate, all of the Greenland ice cores I’ve analyzed predict a Greenland cooling period starting around 2000 AD with the next optimum around 2200AD. While most of the major solar and climate cycles are harmonically related to 3560 years, as described in my paper, not all cycles are, so it’s probably not wise to read too much into these next three graphics.
The same behavior is observed in solar activity reconstructions. The 7120-year shift in the bottom panels may be more accurate with Bond and Bray cycles.
As the oceans integrate solar activity, climate lags changes in solar activity, which been in a decline for a while. My sunspot-based model suggests that global cooling started around 2016. Time will tell.
Typo. Should read (midpoint 355 years). not 335.
My original comment corrected below due to forgetting to include graph.
FWIW, there is this attached interesting chart that I found 10 or so years ago with an unattributed source (it may have been CRU itself, as cited as being the data source) and I that have been unable to locate recently by online Google search of “images”. Note that the indicated 65-year-cycle curve is associated with the approximate average cycle period (+/-) for the PDO and the AMO, and the indicated 230-year-cycle is reasonably a “beat frequency” resulting from the close-but-not-identical frequencies of the PDO versus the AMO.
The fact that this chart indicates the onset of a long term period of cooling beginning 2010-2020 versus the above article’s prediction of the onset of GSM-induced cooling beginning around now is, IMHO, mutually consistent given the uncertainties in predicting the plotted 230-year cycle period based on less than a full single-period width (i.e., 230 years) of historical data to compute such a frequency.
As per the TV movies series (Game of Thrones): “Winter is coming!”
If only we had some data from after 2010 that would allow us to test how a good a predictor that curve is.
Exactly what I was thinking! The descent towards solar minimum doesn’t seem to be having a noticeable effect…. unless of course it’s an inversely proportional relationship 😅
Did you not read in the above article that:
“Using pattern analysis, it may be assumed that the onset of the next GSM has arrived, and global cooling will be realized over the next few decades.” ? (my bold emphasis added for your benefit)
Up to now, there is no claim—let alone evidence—of a “descent toward solar minimum” having a “noticeable effect” on global temperatures.
A decade and a half ago David Archibald and others had articles on this site stating, variously, that solar activity had already started to cool the planet or would do so soon.
Since those solar-based cooling predictions were made, global warming has proceeded at ~ +0.3C per decade.
Yes, there are many failed ideas, but that doesn’t automatically invalidate all future theories. My research has lead me to the following conclusions.
The empirical evidence that it’s the sun is overwhelming. That’s why people keep trying to figure it out.
Sunspots are a proxy for solar activity, not solar activity. While the encoding of solar activity into sunspots is complicated, activity can be decoded with a simple 99-year moving average. This isn’t a guess, I’ve figured out why, and it can only be explained using the Jovian planets. This is why I’ve focused on them and ignored Venus-Earth-Jupiter theories.
I don’t know if the Jovian planets modulate solar activity, or if their obits are simply a reflection of solar-internal resonances.
There are far too many cycles for harmonic models to be used. For example, the 2-cycle harmonic model you posted may match, but that proves nothing.
Here’s a counter example using Jupiter-Saturn conjunctions. The basic period is ~20 years, but due to non-circular orbits, and the influence of Uranus and Neptune, the conjunctions have both a 60- and 937-year patterns.
The Jovian planets have an effect on the Barycenter, which the sun orbits. There is no single explanation as many phenomena factor in.
In fact, all planets in the solar system have an effect on its barycenter.
Here, in descending order, is the ranking of the relative gravitational pulls exerted on the Sun based on each planet being at its perihelion distance (strongest pull) and as normalized to Earth’s attraction being assigned a value of 1:
Jupiter = 12.5
Venus = 1.53
Saturn = 1.13
Earth = 1
Mercury = 0.56
Mars = 0.05
Uranus = 0.04
Neptune = 0.02.
Note that Venus exerts a greater gravitational force on the Sun than does the Jovian planet Saturn.
And Mercury exerts a far greater gravitational force on the Sun than do the Jovian planets Uranus and Neptune.
“The great tragedy of Science—the slaying of a beautiful hypothesis by an ugly fact.”
— biologist Thomas Henry Huxley, 1870
What this misses is that planets exchange angular momentum during conjunctions, so Uranus interacts with Saturn which interacts with Jupiter, etc. Orbital relationships change over time.
As I said before, I don’t know if the Jovian planets modulate solar activity, or their orbits simply reflect solar-internal resonances.
The sun has mass and an energy source, why wouldn’t it have active vibrational modes?
No. In fact, the planets are ALWAYS exchanging angular momentum due to tidal effects arising from their mutual gravitational fields. (“gravitational pulls” on each other). This is true primarily for planet-Sun interactions, and secondarily due to planet-planet interactions, both as governed by mass/(distance^2) scaling. This is not debated as a fact among scientists familiar with astrodynamics.
The Sun does have several active, inherent vibrational modes that are independent of planetary influence.
In comparison, a pound of U-238 (in fact, all isotopes of uranium) has mass and an energy source (that of radioactive decay), yet does not exhibit any “active vibration mode”.
That downturn after 2005 or so is a meaningless consequence of extending a polynomial fit beyond the end of measured data. It has little to do with weather.
Geoff S
I agree with you that the overlay of a 65-year cycle and a 230-year cycle has “little to do with weather”, since both NOAA and NASA (as well as most scientists) define weather averaged over 30 or more consecutive years to be climate, the subject of my comment.
On the other hand, you apparently failed to recognize that I pointed out the predicted start of cooling AFTER 2005 was uncertain specifically because the 230-year curve (comprising a fundamental basis of the prediction curve) was based on less than one full cycle of historic data.
Solar flares and sunspots don’t warm the Earth.
Use the sun’s UV radiation instead of solar flares and sunspots in your models.
Not just UV.
This won’t save us from the climate cultists.
Any variation in temperature, up or down, will be an evil portent of doom, with all the usual remedies and scapegoats.
Quite, in fact I can see the headlines in the Guardian come 2030.
” Climate Change mitigation policies working as Britain experienced its coldest January since 1964″
It is always due to man made climate change no matter the direction of travel.
If it cools, of course it will be due to Climate Change! They don’t call it GW anymore. Already have movies where an Ice Age is brought on by CO2. They’ll just claim the Atlantic circulation has slowed down and its worserer than ever!
The notion of human control of climate goes back to the days when sacrificing a virgin or burning particular herbs were thought to control the climate.
Al Gore has made comments that he sees a coming cooling.
Like we can believe the author of an Inconvenient Lie.
One thing is clear. If it does get colder, the use of crude oil to produce synthetic fibers such as 3M™ Thinsulate™ insulation will increase.
Hopefully NOT !!
I would prefer to have SC 25 on the graph, up to latest data.
Does someone have that available ?
Don’t anyone dare ask about the possible cause of that precipitous drop in sunspot numbers between first quarter of 2025 and its recovery to the predicted value curve ending the beginning of last half of 2025 (a significant reduction down to about 80 Sunspot Number versus the predicted value of about 130 Sunspot Number, equivalent to a 38% drop and recovery over about 3 months!
And something similar happening in 2024, but with opposite direction of variation.
Methinks humans know little about the true scientific importance of sunspot numbers although they are carefully counted and tracked!
https://www.spaceweatherlive.com/en/solar-activity/solar-cycle/historical-solar-cycles.html
Thanks Phil.
That appears to be an excellent website for that type of data.
Is the WUWT consensus that it is run by objective scientists?
Here is through February:
https://www.solarham.com/progression.htm
Firstly I would note that you have not specified precisely which parameter(s) of “data” you wish to process.
Secondly, although I will do my best to suppress it, it will be very hard for me to dampen my “snark level” enough to completely avoid including comments along the line of “It’s a pity you don’t have access to something like … checks notes, oh yes … an ‘Internet search engine’, isn’t it”.
.
For sunspot data I use the SILSO (V2) monthly dataset.
URL 1 : https://www.sidc.be/SILSO/datafiles
If you open up the “Total sunspot number” box you can chose from daily (back to 1/1/1818), monthly (back to January 1759) and yearly (back to 1700) granularities.
For the “solar background magnetic field” referred to in the Zharkova (2026) paper of the ATL article I use the “Heliospheric Current Sheet (HCS) Tilt Angle” data from the Wilcox Solar Observatory (WSO).
URL 2 : http://wso.stanford.edu/Tilts.html
NB : Zharkova does a PCA of the WSO’s “daily synoptic magnetic maps of SBMT” in the ATL paper, but it is unclear to me where (or even if) the “raw” (and, I’m guessing, voluminous ?) input data can be accessed by mere mortals such as myself on the WSO website … and note that I definitely don’t have the mathematical “chops” to do a PCA even if I could work out what to download.
Updating an old spreadsheet gave me the attached graph. If you would “prefer to have” something else you now have links to datasets which should allow you to generate precisely whatever it is you currently “have in mind”.
The synoptic data is available, but it is a huge dataset spread across many files. Here are a couple of plots I created from it. In the first one I attempted to predict sunspot number from the toroidal fields.
Setting aside the merits of the paper, the first thing the climate worriers will do is point to the sources of funding:
CiteEnergy Inc – I can’t find any information on CiteEnergy, so, unless anyone has info, red flag no.1
First Corporate Consultants – critics will point to the Mordaunt families connection with both Heartland and Reform. Like it or not, that’s red flag no.2
I can see this paper being buried or dismissed by both climate alarmists and their cohorts in the Misleadia
The “science of climate change” is a journal that is on the radar of nobody except cranks and crackpots. Serious scientists even skeptical ones will not even notice it.
FYI: Science of Climate Change is new journal that publishes peer-reviewed articles. I seen have papers published by Prof.’s Happer and Lindzen and by physical chemist Roy Clark. Go check out the homepage at: https://scienceofclimatechange.org
So you are really into it then?
Translation, they don’t support the mythical consensus so they must be trash.
Chuckle. Ignore the substance but attack the source. Rather typical of the “serious” nature of climate alarm “science”.
There are no “serious” climate alarmist scientists.
So you comment is, as usual, meaningless.
Misledia… I like that and plan on stealing it for future use.
You’re very welcome – feel free
I stole ‘illegal gimmiegrant’ from someone else over a year ago, and have used it frequently. ‘Legacy misledia’ will now replace ‘main stream propagandists’ in comments. Thank you for making it ‘legal’ instead of plagiarism. (I don’t generally have room for citing references in Comment blocks)
Modern research has concluded that early reconstructions of Total Solar Irradiance during the maulder minimum were incorrect.
So what caused the Little Ice Age?
The theories are unknown Milankovitch cycles or soot particles in the atmosphere from volcanoes.
Soot particles in the atmosphere? Wasn’t that only after 1850? 😉
The Little Ice Age was a period of cooling spanning roughly 400 to 500 years.
There is no Milkanovitch cycle—those long term variations in the ephemeris of Earth’s orbital parameters relative to the Sun—that could possibly have a half-period as short as 500 years.
You can safely rule out one or more “unknown Milankovitch cycles”.
The period encompassing the Little Ice Age is conventionally defined as lasting from the early 14th century (c. 1300) through the mid-19th century (c. 1850). This was not a calendar span that had any unusually high amount of volcanic activity.
Furthermore, FWIW from Google’s AI bot:
“Soot and fine ash particles suspended in the lower atmosphere (troposphere) typically wash out within hours to a few weeks. However, fine sulfur aerosols (often referred to as volcanic smog) injected into the upper atmosphere (stratosphere) can linger for one to three years.”
(my bold emphasis added)
You can safely rule out “soot particles”, especially those from volcanoes.
The Mg II Index varies by 6% to 14% from a solar cycle maximum down to a solar minimum. If variations in solar UV radiation affect climate, this could be an explanation.
If my research is correct, UV accounts for about 3-5% of solar energy reaching the earth. 3% of 1360 is about 40 W/m². A 10% change in that could result in ±4 W/m². That is a significant amount. It is in the range of cloud changes and measurement uncertainty of insolation.
If dew and water vapor absorb UV radiation, it has a major impact on the climate.
It could be UV radiation that evaporates the dew during the morning hours.
You can add the variations in UV radiation to your research.
https://www.iup.uni-bremen.de/UVSAT/data/
Ahhh . . . but left unsaid is to what extent any given amount of magnesium in the Sun, let alone its core-to-wing spectral emission ratio, actually affects its radiated power output.
Lacking that, it qualifies as a “red herring”.
Google is your friend:
“AI Overview
The Little Ice Age (roughly 1300–1850 CE) was primarily triggered by a cluster of massive volcanic eruptions that cooled the Earth, and sustained by a natural ocean-ice feedback loop and periods of decreased solar activity.
The phenomenon was driven by a combination of interlocking factors:
From the “El Reg” website … AKA “Vulture Central” … and their latest BOFH episode …
.
PS ; One of the comments reacting to the last paragraph in the above extract was
after reading which I promptly thought “Hey ! I resemble that remark …”.
AI is not your friend when it regurgitates bogus, politicized “climate science”.
Explain please the Holocene Climate Optimum, the following Neoglaciation, the 4.2 Ka Event cooling, the Egyptian, Minoan, Bronze Age Collapse and Dark Ages Cool Periods. Thanks!
The Santorini eruption fell between the Minoan and Bronze Age Collapse Cool Periods, ie during a warm cycle.
The AI must have got that wrong.
Michael Mann proved that there was no MWP or LIA. His hockeystick graph had a straight handle.
If the MWP existed then the whole AGW scare needs to be re-assessed.
So AI must have got that wrong.
I think you’ve misunderstood Mann’s research. Mann did not disprove MWP or LIA. In fact it was the opposite. He was one of the first to hypothesize its cause. [Mann 2002]. The so called hockey stick graph, being a global average temperature reconstruction [Mann et al. 1998], does not present data directly relevant to the MWP either way. [Lamb 1965]
The so called “Hockey stick” does not represent anything in the real world. !!
The handle of the farcical hockey stick was when there was a CO2 constraint to growth of trees, and hence tree rings..
Remove the tree ring data, you get a more realistic graph, that matches the cooling down from the MWP, as seen in the GISP data, a lot more closely.
you mean you are now quoting from artificial stupidity?
That makes perfect sense for Banton.
Ah, another Ad Hom.
Perfect response!
And typical for a climate Denialist
Ah, another Ad Hom.
Perfect response!
And typical for a Trans-Reality Alarmist!
That’s a mighty long chain of coincidences and claimed interactions/feedbacks over hundreds of years, most scientifically unsupportable.
As to your third bulleted item, the Sun’s output from minimum SSN to maximum SSN varies by about 0.1%, whereas over the course of just one year the solar insolation at Earth TOA varies by about 6.8% due to Earth’s elliptical orbit around the Sun.
They have run multiple models multiple times, and the models consistently show that there was no Little Ice Age. In fact, the global temperature didn’t change over the last 10,000 years before the industrial revolution. When you think about it, it is pretty obvious: if there is nothing in the models that can make the temperature change then Earth’s temperature cannot change. Climate science really is that simple.
Hah! How about we just set aside the models and look at the actual scientific data?
Such as—among many published scientific articles providing widespread evidence (through documented reporting and paleoclimatology proxies)—the attached graph presented in “The Little Ice Age signature in a 700-year high-resolution chironomid record of summer temperatures in the Central Eastern Alps”, published December 2018 in the international journal Climate Dynamics, available as a free download at https://link.springer.com/article/10.1007/s00382-018-4555-y#citeas
I personally prefer hard data over models, relying on this sage advice of Richard Feynman:
“If it disagrees with experiment (observation), it’s wrong. In that simple statement is the key to science. It doesn’t make any difference how beautiful your guess is, it doesn’t matter how smart you are, who made the guess, or what his name is — if it disagrees with experiment (observation), it’s wrong.”
Millennial ocean cycle.
Models.
It really is very simple: the models have no provision for solar variation.
When they run, they therefore show no solar variation.
From this, they have revised the old estimates.
Do they even think they are doing science, or do they know they are doing politics? IMHO, the latter.
Since y2k, how offen was cooling predicted die to declining sun activities?
I remember at least 3 times.
Any slight change in the solar output is being more than countered by the amount of sunshine actually reaching the Earth’s surface…
Nature Turns Up The Sunshine – Watts Up With That?
The Climate Liars, of course, want to trash this idea because it threatens their anti-science ideology. The thing is, it is science whether you agree with it or not. And puny CO2 is no match whatsoever for whatever direction the sun puts us in. My money would be on at least some amount of cooling in the coming decades. Whether or not we will reach LIA conditions is debatable, but certainly possible.
Firstly, if you accept the graphical evidence for a pattern match between global temperature and sunspot count, the second step is to explain the mechanism that changes the global temperature and the third step is to explain why sunspot counts vary. If you wish to correlate variables for future forecasts, you need to know how well each input can be forecast.
Geoff S
UAH has January and February both at over 0.5°C above the 1991-2020 average for the Northern Hemisphere.
Yes, and UAH shows the temperatures have cooled by 0.5C since early 2024.
UAH “cooled” by over 1°C from April 1998 (+0.62°C) to January 2000(-0.41°C). Rapid warming resumed after this.
Pointing to a short term decline in UAH is therefore not especially informative by itself.
For a group that treats UAH as the gold standard, there seems to be remarkably little familiarity with what the dataset actually shows.
Are they interested in the dataset or do they just like looking at colorful squiggly lines?
You are discussing a term known as variance. It is an important statistical descriptor that provides information about how wide the distribution of measurements is.
Waving it away is not scientific. Science requires an explanation of why the variance occurs. Tell us why the variance is so large.
“Waving it away is not scientific. Science requires an explanation of why the variance occurs. Tell us why the variance is so large.”
Yes, I am discussing the variance of the dataset. To answer your question, the variance is largely attributable to ENSO and volcanic eruptions.
It is strange to see short term variability repeatedly mistaken for something other than short term variability, but here we are.
It’s amusing that you could have directed your comment towards Tom Abbott (as he arguably is waving it away) but you chose not to.
Doing so might have at least helped preserve the faint illusion that accuracy matters more than partisanship on this blog.
Your answer doesn’t even include any mention of measurement uncertainty. That tells me that you think all of the data is 100% accurate and that measurements are not estimates with uncertainty surrounding them.
” To answer your question, the variance is largely attributable to ENSO and volcanic eruptions.
It is strange to see short term variability repeatedly mistaken for something other than short term variability, but here we are.”
Short term variability is not the only variation. If short term variation was the only variation, we wouldn’t have glacial and inter-glacial intervals. Insolation changes over long periods of time. Even continental drift happens over long periods of time. Rivers change course over long periods of time. Deserts wax and wane over long periods of time.
Climate science ignores ALL variance, short term and longer term.
To that point…this is the same guy who is firmly in the “all adjustments are bad” camp. So it is ironic that he gives UAH so much credence especially since UAH utilizes adjustments in its computation model prolifically and then adjusts how they do their adjustments frequently as well.
UAH actually shows that there is NO WARMING apart from the spike + step El Nino events in 1998, 2016 and now 2023/24/25
Between those El Ninos there is near zero trend.
“UAH actually shows that there is NO WARMING”
Your own graph shows the warming trend quite clearly.
Each successive peak is higher than the last, and the troughs are rising as well. That’s exactly what you would expect to see in a warming climate.
LOL. read the rest of the sentence. You really are a leftist aren’t you.. quoting partial sentences. One sentence… as shown below.
UAH actually shows that there is NO WARMING apart from the spike + step El Nino events in 1998, 2016 and now 2023/24/25
It’s also exactly what you would expect to see in a time series that is not stationary with shocks that get carried forward into the average. Each shock raises the average followed by stagnation. ENSO and similar “shocks” get carried forward in the average rather than being immediately dissipated.
Rapid warming resumed after this.
WRONG There was no warming from 2001-2015 in the UAH data..
The near zero trend was broken by the 2016 El Nino.
“here seems to be remarkably little familiarity with what the dataset actually shows.”
Way more than you apparently have. !!
UAH has also seen adjustments made to prior data.
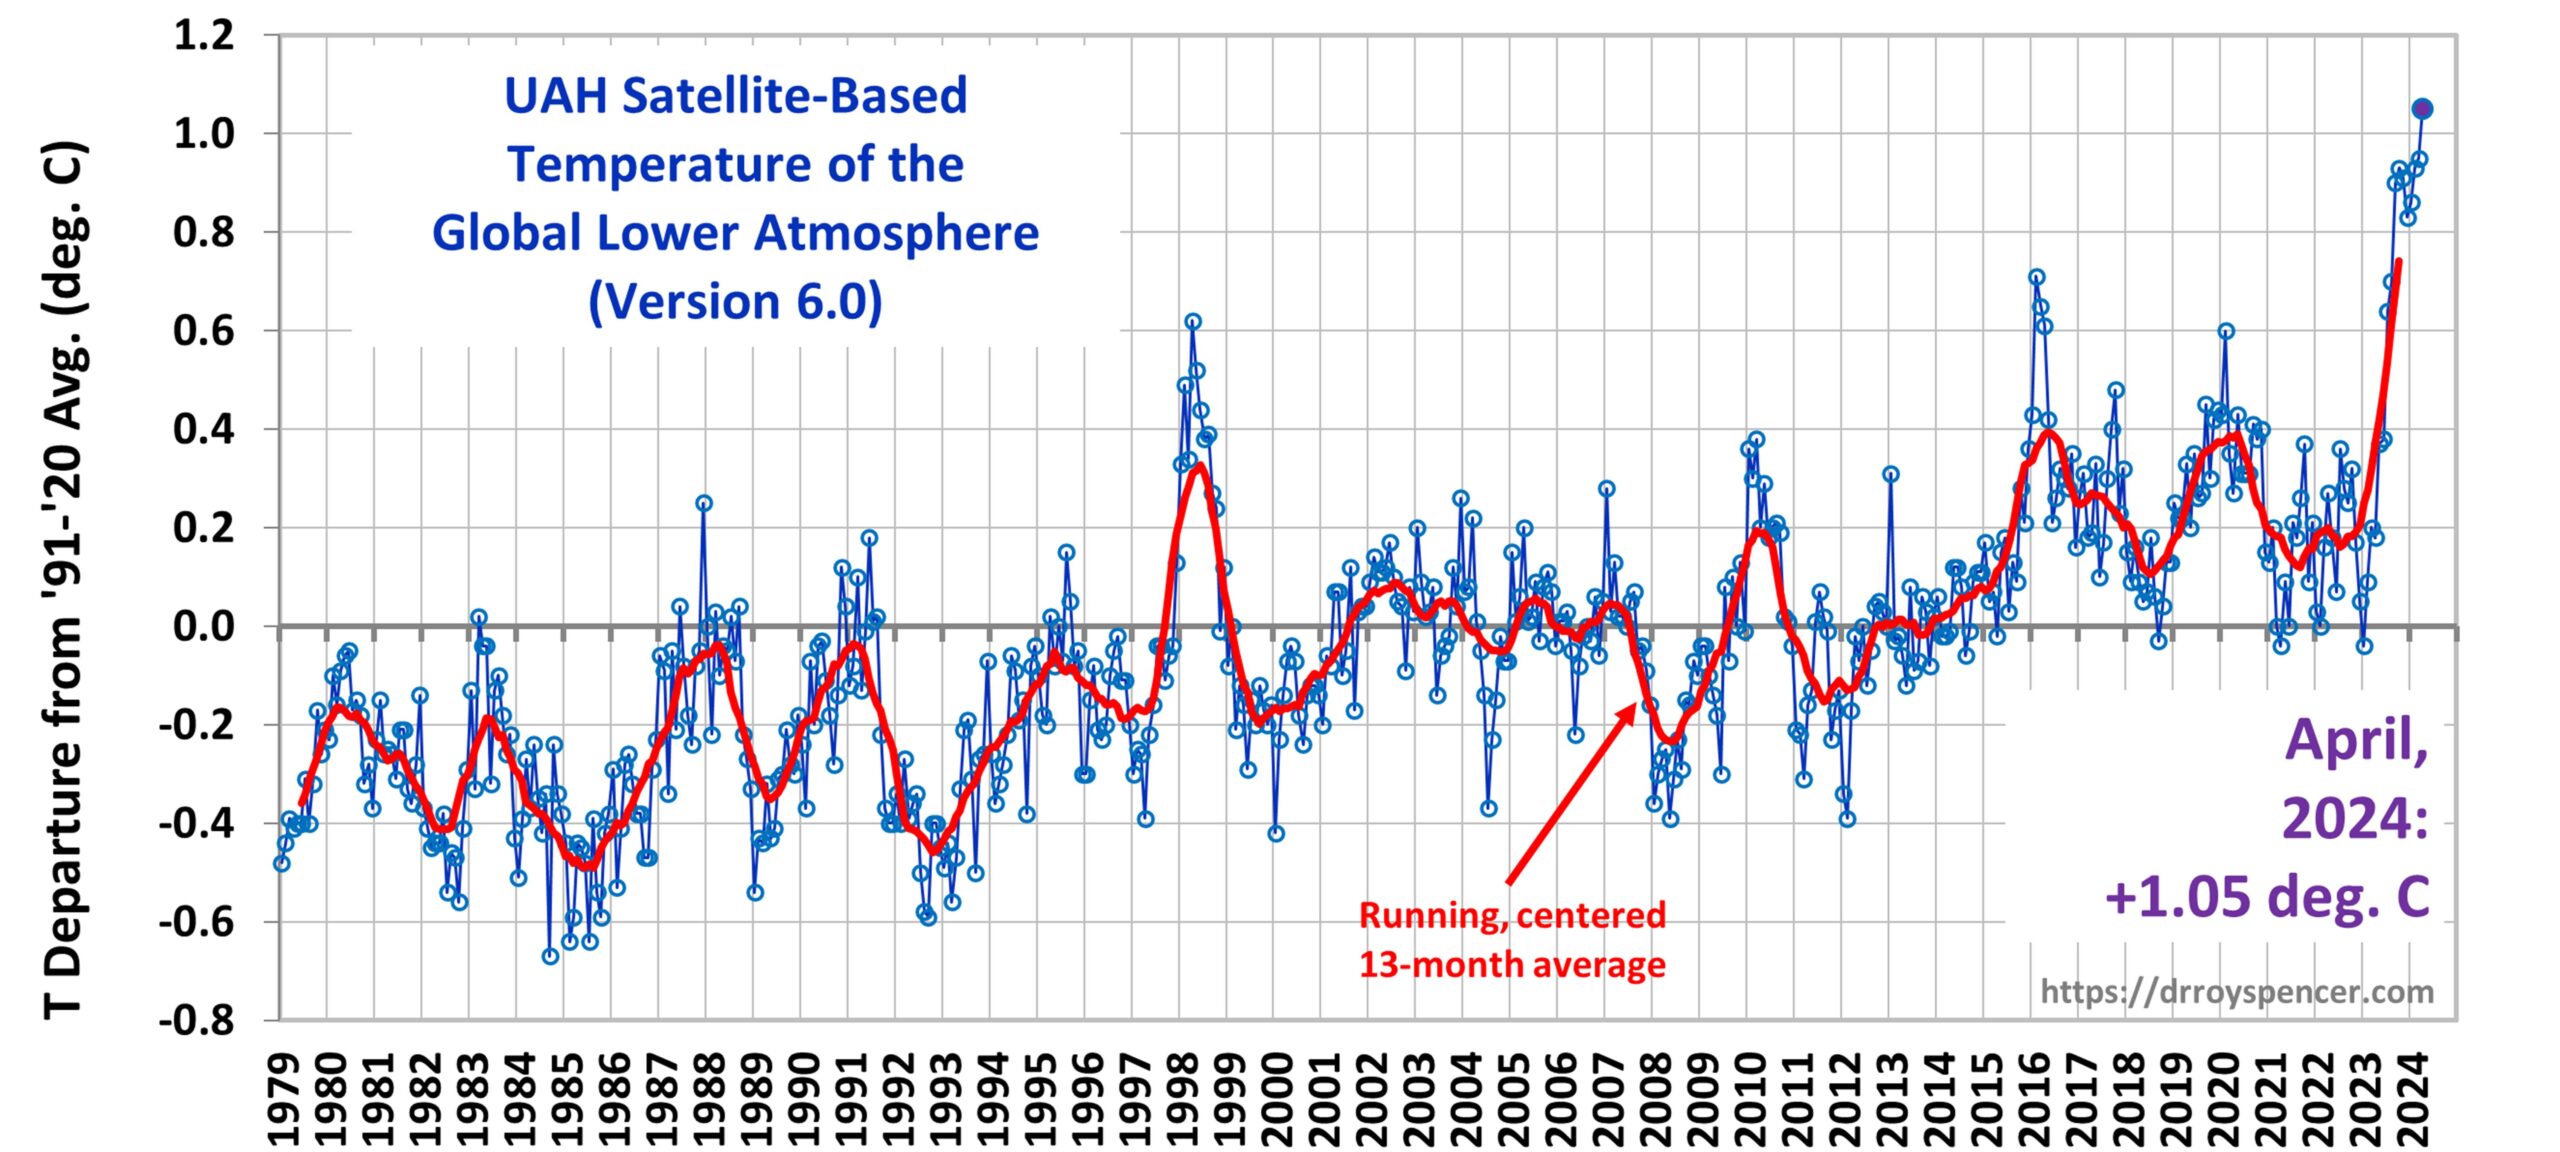
Back in April 2024 (at the spike) Global anomaly was 1.05°C
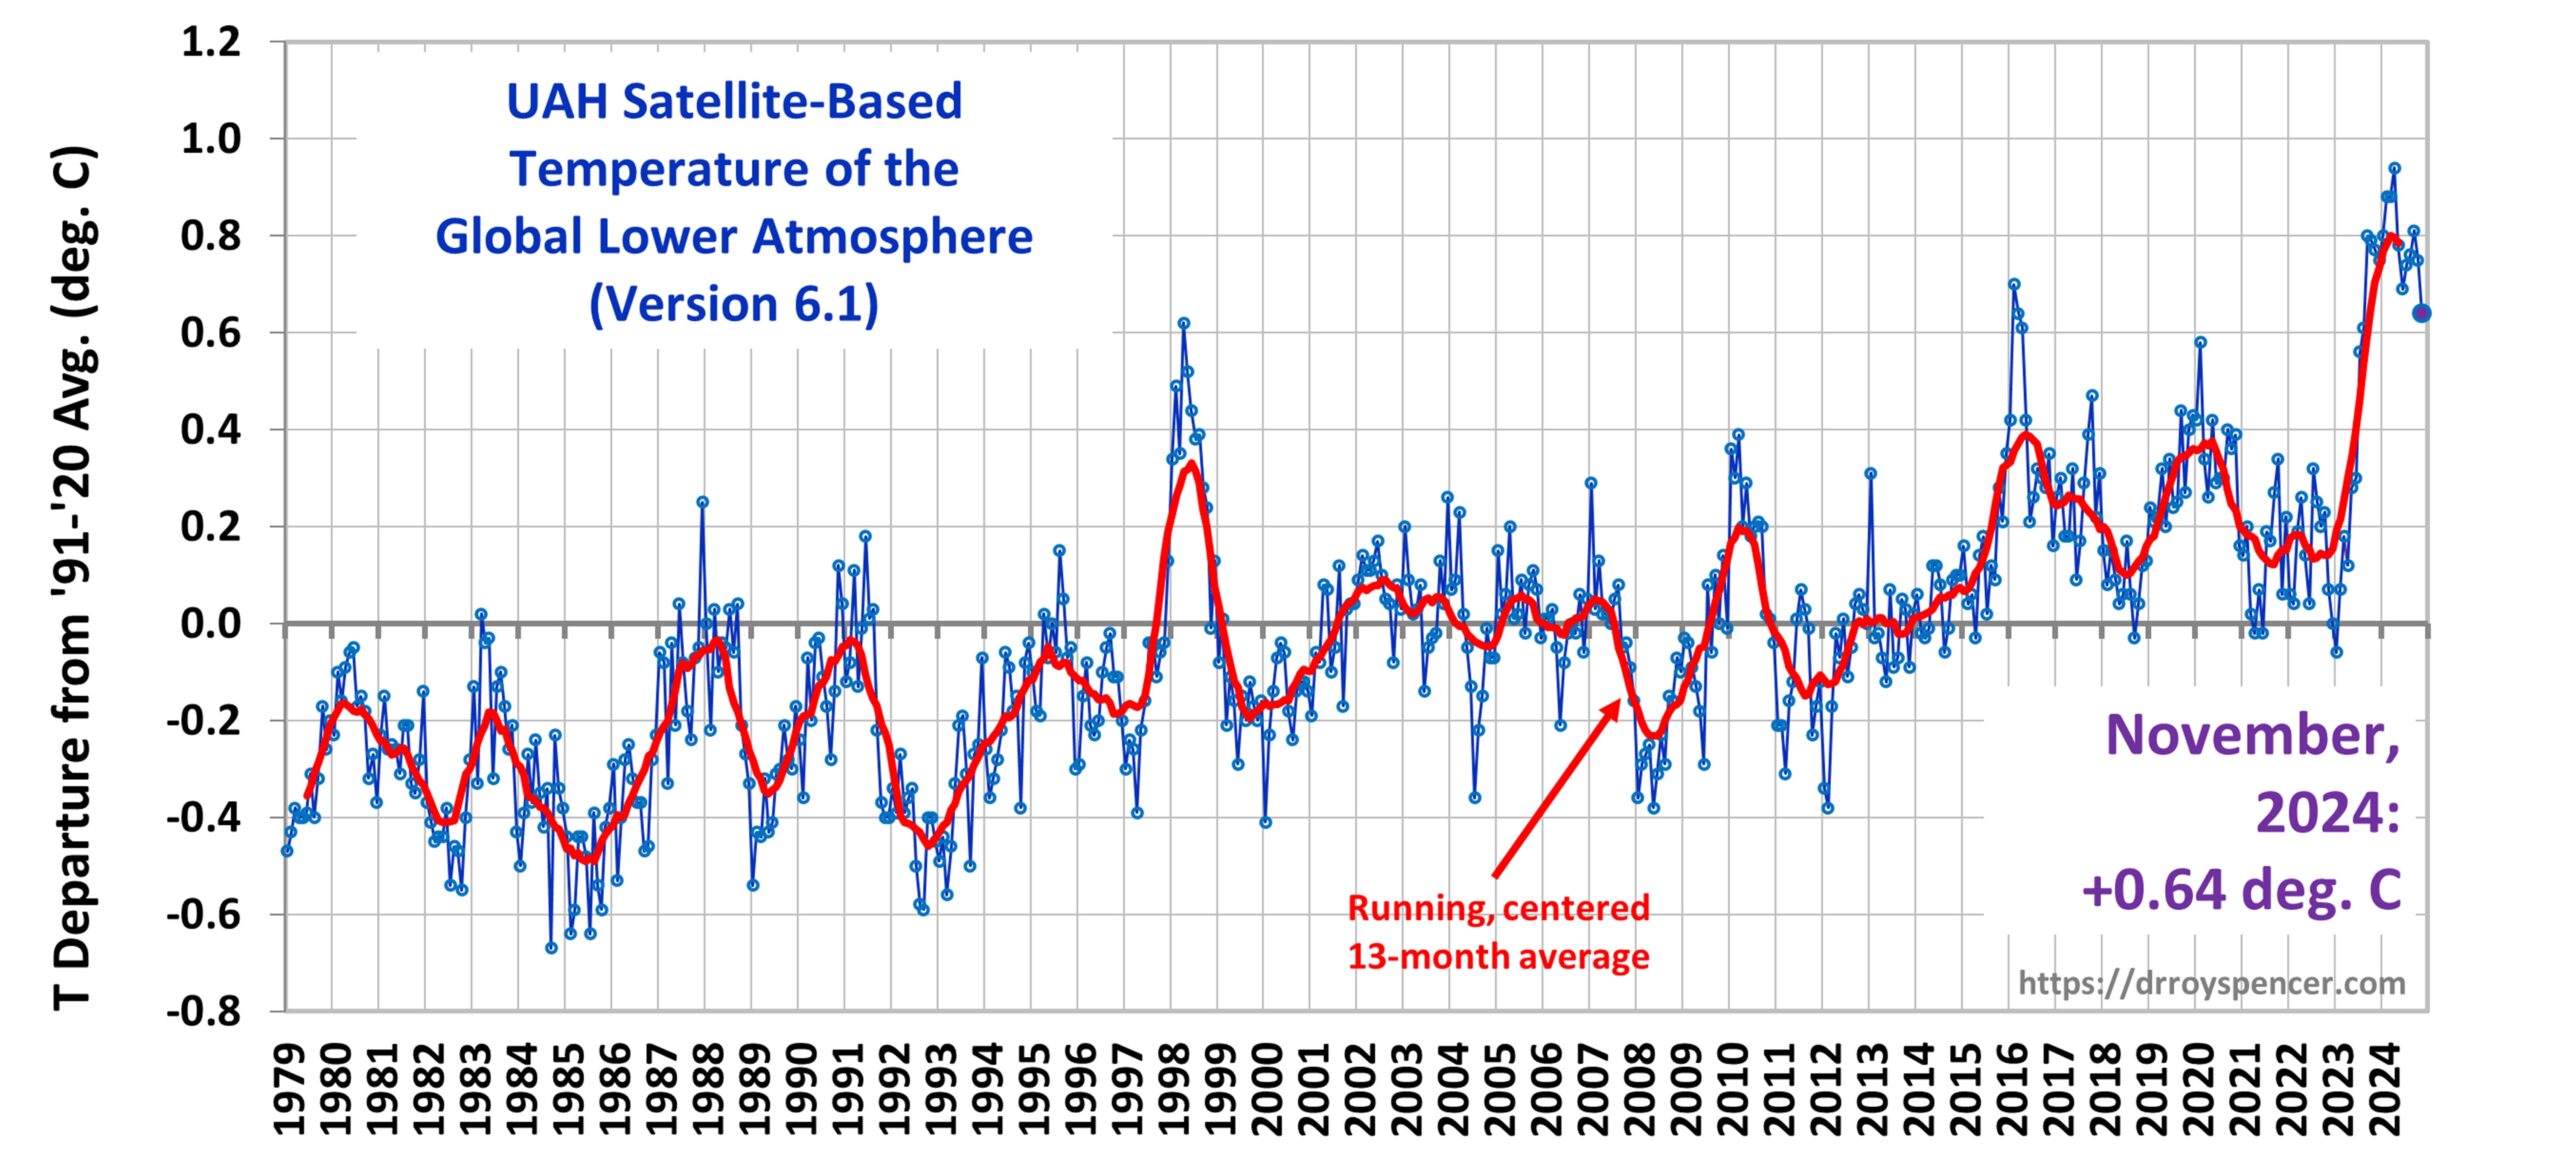
By November that has been reduced to 0.9?
Not sure why but???
There are both CFSR unadjusted and CFSR adjusted daily temperature anomalies.
This indicates an uncertain deviation in satellite temperature measurements that are adjusted manually.
The correction of bias requires calibration to determine the correction direction and value.
Comparison to observational records that have uncertainies only increases the total combined uncertainty. You can’t just assume that observational records of any length has ±0.0°C uncertainty.
Using corrections that are not based on calibration adds to uncertainty. Do you have any information on the actual increased uncertainty values?
Information about Version 6.1
https://www.ncei.noaa.gov/news/ai-supercharges-key-noaa-dataset-ensuring-peak-accuracy
https://www.ncei.noaa.gov/products/land-based-station/noaa-global-temp
NOAAGlobalTemp Version 6: An AI-Based Global Surface Temperature Dataset
https://repository.library.noaa.gov/view/noaa/66587
https://catalog.data.gov/dataset/noaa-global-surface-temperature-dataset-noaaglobaltemp-version-6-1
https://www.ncei.noaa.gov/access/metadata/landing-page/bin/iso?id=gov.noaa.ncdc:C01764
oc4caster creates graphs of unadjusted and adjusted global surface temperature anomaly.
The data are from NOAA grib2 data files.
https://oz4caster.wordpress.com/monthly-trends/
https://oz4caster.wordpress.com/cfsr/
Victor,
I have perused your references and your WordPress pages.
To be succinct, you appear to be accepting “measurement data” as presented by NOAA and others as 100% accurate with zero uncertainty. As an engineer, you should know that all measurements are estimates and part of the stating the measurement is also stating the uncertainty. In general, a 95% interval of the dispersed measurements covers the uncertainty. That means 95 out of 100 are in the interval.
Nowhere in your references or your pages could I find a proper uncertainty budget. That is the first thing required in order to propagate uncertainty from the first measurements all the way to the last calculation.
As an example is NIST TN 1900 Example 2. I preface this with the statement that this is an example only and assumes there is no influence quantities (uncertainty) other than the dispersion between the daily Tmax measurements for a month. NIST calculated an uncertainty of ±1.8°C.
There are several mentions of “bias” corrections. Bias in an individual station can only be determined by an actual calibration of the instrument to find a correction factor.
Bias in climate science uses a bastardization of the term bias to describe what occurs when a station has a change after some change. As you know, different instruments can be 100% accurate but give different readings for a variety of reasons, even among the same model. Microclimates can change due to location, instruments, housings, ground cover etc.
A measurement bias cannot be discovered by simple comparison to other stations that may have “biases” of their own. In essence, this is simply a way to get different stations, instruments, etc., to “match” readings so a long record can be claimed. Ask yourself how much can one missing daily Tavg here and there affect a data stream of a century.
In the not-too-distant future, all these modifications to data are going to go away as minute and sub-minute data spans more and more time. The old Tmax, Tmin, and Tavg will simply disappear along with the stations that can only measure those quantities. HVAC engineers are already using this finer data to create more efficient systems. Agriculture and biology scientists are using this finer data in their studies. Climate scientists in China have several papers using hourly data to determine various climate effects.
There are columns in the grib2 data files for uncertainty and errors for each row.
Explanation of the columns for uncertainty and errors.
Early-twentieth-century cold bias in ocean surface temperature observations.
https://pmc.ncbi.nlm.nih.gov/articles/PMC11578896/
I read your link at: https://repository.library.noaa.gov/view/noaa/45187/noaa_45187_DS1.pdf
I got no further than this statement.
much smaller than those at the local grid scale due to error cancellations by averaging.
Somehow this attitude about measurement uncertainty has become endemic throughout much of science. It is based on the assumption that experimental standard deviation of the mean is the appropriate value to use in categorizing measurement uncertainty.
When dealing with experimental data, you should be conversant with JCGM 100-2008 (and related documents). These two paragraphs should tell you that uncertainty ADDS when combining multiple input quantities. It is not reduced.
Lastly, here is a document “Mean ± SEM” or “Mean (SD)”? – PMC
It says:
Think about this. Averaging can reduce uncertainty. How could averaging do this? Many scientists quote the SEM which reduces the uncertainty of the mean by √n. This is not the data variability around the mean or as JCGM says;
Tell you what, find us a reference that uses the experimental standard deviation of the mean as measurement uncertainty and tell us the assumptions that must be met to use it as such.
Climate science in a meme: “all measurement uncertainty is random, Gaussian, and cancels”. Even if it isn’t random or isn’t Gaussian, it is ASSumed to be such! “Asymmetric measurement uncertainty” is not a term in the lexicon of climate science!
Which assumes that hte long-term historical baseline is 100% ACCURATE. Typical for climate science. Just make a non-physical assumption in order to simplify processing.
How is this done accurately on an individual station level?
Microclimate is a source of SHORT-TERM fluctuation? Sensor noise is a SHORT-TERM fluctuation?
None of this is actually physical at all. Exactly what components of the microclimate are used as a variance factor? Color of the mounting bed where the station is located? Distance to a heat source like a building or asphalt paving? Evapotranspiration of the surrounding area (hint: is the station near a cornfield/soybean/fallow field? near a large lake, small lake, no lake?)
Same for sensor noise? How is the short-term variance determined? What components are used in the determination? Component age? Internal measuring station temperature? Quantum effects in the PRT? Heating effects in the measuring circuit components (see Hubbard and Lin study on station electronics).
I can’t find a single reference on the internet that actually describes a measurement uncertainty budget for ANY OF THIS! It’s all guesswork and assumptions -each of which ADDS to the total uncertainty of the data set – meaning the variance of the data set!
I found information about Bias Adjustment.
The database contains records from more than 100,000 stations in 180 countries and territories. Stations out of order increase uncertainty.
Bias Adjustment
Unlike GHCNm, GHCNd does not contain adjustments for biases resulting from historical changes in instrumentation and observing practices. It should be noted that historically (and in general), the deployed stations providing daily summaries for the dataset were not designed to meet all of the desired standards for climate monitoring. Rather, the deployment of the stations was to meet the demands of agriculture, hydrology, weather forecasting, aviation, etc.
Because GHCNd has not been homogenized to account for artifacts associated with the various eras in reporting practice at any particular station (i.e., for changes in systematic bias), users should consider whether or not the potential for changes in systematic bias might be important to their application. In addition, GHCNd and GHCNm are not internally consistent (i.e., GHCNm is not necessarily derived from the data in GHCNd) until the release of GHCNm version 4.
Methods
https://www.ncei.noaa.gov/products/land-based-station/global-historical-climatology-network-daily
Victor,
Adjustments to temperatures suspected of being affected by events like relocation of weather station apparatus is a nonsense. Sure, one can claim that a correction should be done, but it is not possible to calculate with adequate accuracy the magnitude of the correction. In some cases it is ridiculous when the artificial correction exceeds 2 deg C while significance is claimed for warming or cooling of 0.2 deg C. We used to call that making a silk purse from a sow’s ear. Geoff S
Some of these “experts” exhibit little familiarity with actually making measurements. It is like they would believe you could send off one Model 123 device for calibration and use the same correction you receive on the other 14 Model 123’s in the shop to save the cost of calibrating each one. You just “know” that they all read the same, right?
Tim,
It has been a 30-year haul, but now we are about to show proper calculations of measurement uncertainty for long years of historic temperature data Tmax and Tmin. (Never average them together!). The official government estimate of about +/- 0.1 to 0.2 deg C for 2sigma is emphatically not supported.
One of the reasons it took so long was that we did not contest until a few weeks ago the official statements that RAW temperature data was unadjusted. Forensic computer stuff using lovely programs like JMP shows plausibly that it is riddled with adjustments that are consistent with evidence of the Hand of Man. Examples like 31 daily temperatures starting and ending on a calendar month appearing in more than one year. Cut and paste style.
The initial report should become public inside a fortnight. It is up to a colleague who did the heavy lifting. Geoff S
Doing proper propagation is one thing. Identifying the measurement uncertainty component values to be propagated is something else. Just knowing the variance of the unadjusted station data will be a start. That would maybe point out how the station data should be weighted when averaging.
The upper graph has temperature adjustments Version 6.0.
The lower graph has temperature adjustments Version 6.1.
They changed their computation model slightly and truncated NOAA-19 data after 2021.
“Not sure why but???”
They changed from version 6.0 to 6.1 in October 2024, when they removed one of the satellites from the data set.
https://www.drroyspencer.com/2024/11/uah-global-temperature-update-for-october-2024-truncation-of-the-noaa-19-satellite-record/
Then they’ve added a second satellite, but didn’t change the version number.
https://www.drroyspencer.com/2024/12/uah-v6-1-global-temperature-update-for-november-2024-0-64-deg-c/
Hey Tom. It’s been more than a year since I last reminded you of the adjustments that UAH has made over the years. An additional reminder might be helpful…or not…I don’t know.
Year / Version / Effect / Description / Citation
Adjustment 1: 1992 : A : unknown effect : simple bias correction : [Spencer & Christy 1992]
Adjustment 2: 1994 : B : -0.03 C/decade : linear diurnal drift : [Christy et al. 1995]
Adjustment 3: 1997 : C : +0.03 C/decade : removal of residual annual cycle related to hot
target variations : [Christy et al. 1998]
Adjustment 4: 1998 : D : +0.10 C/decade : orbital decay : [Christy et al. 2000]
Adjustment 5: 1998 : D : -0.07 C/decade : removal of dependence on time variations of hot target temperature : [Christy et al. 2000]
Adjustment 6: 2003 : 5.0 : +0.008 C/decade : non-linear diurnal drift : [Christy et al. 2003]
Adjustment 7: 2004 : 5.1 : -0.004 C/decade : data criteria acceptance : [Karl et al. 2006]
Adjustment 8: 2005 : 5.2 : +0.035 C/decade : diurnal drift : [Spencer et al. 2006]
Adjustment 9: 2017 : 6.0 : -0.03 C/decade : new method : [Spencer et al. 2017] [open]
Adjustment 10: 2024 : 6.1 : -0.01 C/decade : NOAA19 drift : [Spencer 2024]
Oh, and here is how they infilled their grid in their own words.
15 grids representing 2.5° of longitude each at the equator is 4175 km. Compare this to GISTEMP (a frequent target of your anti-adjustment themed posts), which only interpolates to a maximum of 1200 km. And GISTEMP does not perform any temporal interpolation.
If you look at the UAH chart, you will see that 1998, was a high temperature point, and you will see that no year after 1998, and before 2016, was warmer than 1998.
NASA and NOAA claim there were ten years during that period that were hotter than 1998, and came out just about every year claiming the next year was the “hottest year ever!” Over and over again, year after year. The better to scare you with.
NASA and NOAA could not scare anyone with the UAH chart.
NASA and NOAA are propaganda outfits who manipulate the data to push a political agenda.
And while you’re at it, explain how Phil Jones came up with his bastardized version of the written temperature record. Where did he get his data?
You want to convince me of malfeasance on the part of NASA/NOAA due to their adjustments by pointing me to UAH which is even more heavy-handed with their adjustments. See the problem?
I don’t know about UAH but my bones tell me January and Feb were the coldest I can remember, in the mid-Atlantic at least, and I am pretty damn old.
Definitely wasn’t the coldest where I live in Scotland in January. It certainly wasn’t the warmest either. I do think the Met Office were a bit off in their recording. Scotland had the best ski season in several years, with at net gain in snow pack from February through to March, at elevation above 700m. My own temperature recordings in the southern Highlands confirmed a slightly cooler than 1991-2020 average temperature but the Met Office went for slightly milder. There’s definitely a small discrepancy.
I’m pretty old too – most winters of the 1960s, 70′ and 1980s, 1991, 1994, 2001, 2010, 2011, 2021 we’re all much colder than winter 2026.
Notice how the gaps between colder winters widens after 1980s.😁
Even UAH isn’t trusted by many on this forum. Even although poor station siting and/or UHI effect have no influence at all on UAH data, the silly satellite must be getting it wrong somehow!
It isn’t that UAH isn’t trusted, it is that it is assumed to be 100% accurate with no uncertainty attached. Every measurement has uncertainty, they are estimates after all. Associated with estimates are uncertainty intervals that define where the actual value may lay. In the world of metrology, these uncertainties and/or influence quantities are defined and quantified in an uncertainty budget.
When was the last time you saw an uncertainty budget from climate science? If you find one, show it here.
I completely agree that the narrative is very one-sided. I would definitely support a broader perspective on climate science and more in the way of admitting uncertainty by the mainstream. But 2 wrongs don’t make a right. So many on this forum completely closing their minds to even the best presented posts with good supporting data just muddies the water. I think some may feel that they’re acting as a counter-balance to some of the extreme positions posited by the mainstream media on climate change. But the end result is just a screaming match of who can shout the loudest. It certainly isn’t well- reasoned debate.
“When was the last time you saw an uncertainty budget from climate science? If you find one, show it here.”
Here’s one: https://images.remss.com/papers/rsspubs/Mears_JGR_2011_MSU_AMSU_Uncertainty.pdf
I read through the entire study. It only studies the uncertainty introduced from using various measuring devices, each with different data.
It was enlightening to read this from your reference.
While this analysis is somewhat useful, it totally ignores the issue of measurement uncertainty introduced by measuring device influence quantities as defined in the GUM.
Here is a sample uncertainty budget that meets ISO 17025 requirements. I did not find an assessment of this type in your reference.

and another

From this web page:
ISO Standards For Instrumentation Calibration – Complete Guide
If laboratories, engineering firms, builders, etc., must achieve these expectations to meet regulatory and legal requirements, shouldn’t climate science be able to meet them also?
“If laboratories, engineering firms, builders, etc., must achieve these expectations to meet regulatory and legal requirements, shouldn’t climate science be able to meet them also?”
You implied that climate scientists did not perform uncertainty budgets, I answered your question by providing an example, clearly they do. Nit picking about how they do it in a more complex measuring system is an inappropriate response!
Here’s another example: https://pcmdi.llnl.gov/research/DandA/PNAS_2019/Santer_etal_LE_PNAS_2019.pdf
And the original:
https://www.science.org/doi/10.1126/science.247.4950.1558
It’s not nitpicking. There is no budget supplied that an objective reader can evaluate. Uncertainty in path loss is not even evaluated. Even if the measuring devices were 100% accurate there will still be uncertainty in that you won’t know if the end point measurement accurately represents the origin point value. It’s somewhat analogous to the uncertainty introduced by “parameterizing” cloud cover. No amount of averaging can correct this. It’s on par with climate science assuning that temperature is a valid metric for climate!
Did you even read these references? The uncertainty being discussed in the first is internal to a model! It has to do with the uncertainty in time to see a change. It has nothing whatsoever to do with uncertainty in measurements and their propagation.
As to the second reference, maybe you can read the entire study, but I do not have access. However, I suspect the mention that “Analysis of the first 10 years (1979 to 1988) of satellite measurements of lower atmospheric temperature changes reveals a monthly precision of 0.01°C” has more to do with how many digits of precision can be extrapolated.
Precision has a specific definition in metrology. From JCGM 100-2008:
Closeness of the results of successive measurements of the same thing under the same conditions. This is only one component of an uncertainty budget, i.e., repeatability.
For edification, here is a sample uncertainty budget.

The discussion on the blog misses one essential point:
1: Prof Zharkova et al used source data that is well tried and tested, such as the magnetic fields of the Sun which are measured by NASA and the Paris Institute (and which agree to fine margins) . NASA uses this data to make essential ‘space weather’ forecasts of the magnetic fields that can affect earth artificial satellites. She also makes use of the ephemerides of the planets, data long established and used among other things for predicting tides and eclipses.
2: The solar magnetic fields fluctuate in a complex way and simple Fourier analysis will not deal with the issue, so Prof Zharkova has used a technique which I think is called Hamiltonians, and which is used for calculating the vibration within engines.
So we have data that has known practical value to which a mathematical technique of practical importance is applied, so the resulting equations are what they are.
This is not a conjecture, or a hypothesis. It is a straight calculation.
To disprove the result either the data or the techniques have to be demonstrated as false.
I have been exploring this work for some time, and continue to be amazed at how well it picks up historical events. The equations produced from a relatively short dataset of NASA measurements will hindcast onto actuals dating back to Roman times and beyond. None of the IPCC models can do that.
Of course other things will happens such as the forthcoming El Nino which may mask the temperature decline for a while. Here is a story tip: I used Prof Zharkova’s work in an essay to see what would happen if the lessons from the Covid Inquiry were applied to the climate issue. That can be viewed at
https://mvteal.co.uk/wp-content/uploads/2024/10/COVID-Lessons-neutral-V04.pdf
What would Leif Svalgaard say?
https://svalgaard.leif.org/research/Does-The-Sun-Vary-Enough.pdf
Who cares?
“…There is the cold weather with huge frosts and snows recorded in January- February 2026 in the whole Northern hemisphere from the West to the East and from the North to the equator…”
“The whole Northern Hemisphere” minus Western North America, at least.
“…The little ice age associated with the modern grand solar minimum is here…”
Let’s not get ahead of ourselves. It’s still warmer than it was during the mid-20th century, as we’re still declining from the HT temperature spike.
It seems strange that people are so eager to accept that 150 MtH20 can have such a dramatic effect on the global TLT temperature, but the 20,000 MtCO2 that has been added to the stratosphere since the HT eruption has little to no effect at all.
CO2 in the Stratosphere with be emitting most outwards.. ie COOLING !!
Outwards and inwards approximately equally!
Indeed – which is why the Strat is cooling …
I see that the “downvoter for no valid reason” is lurking around here today.
I was looking at the data to see if it supported this article, and the data does to support it. But I must say that when you look at solar cycle 25 in its current state, it has blown away the predictions made over the last two decades by all. Cycle 25 was supposed to be another weak cycle, but it has out shinned the previous two cycles, I would not call this a grand minimum.
But I do find it interesting that the Central England Temperature time series appears to correlate with solar activity, it confirms the pause very well.
Interesting that the graph of sunspot number omits the last 5 years and hence fails to show that the last maximum was higher than the last one in that graph! https://www.spaceweatherlive.com/en/solar-activity/solar-cycle/historical-solar-cycles.html
We have just been through the longest and strongest Grand Solar Maximum in at least several thousand years. Given the amount of inertia in the system (ie, in the oceans) I doubt that a new Grand Solar Minimum will give us a new global Little Ice Age, well, not unless it is also long and strong, and anyway not for several decades.
Agreed.
It is good to see that the importance of the sun to ‘climate change’ is finally being recognized!
Regarding the ‘inertia of the system’ and the lags that it causes, it should be noted that there are two distinct lag times:
Of the two lag times (and their respective transport mechanisms), the second is more important in the context of ‘climate change’.
So will the extra man made Co2 that has increased the global temperature offset the decrease in global temperature caused by the GSM? (Sarcasm)
The amount of hot CO2 expelled by climate alarmists may offset this.
Just looking at historical records, the each of the warm periods since the end of the Holocene Optimum have been closer to 200 years long. Based on that, the modern warm period still has 100 years or so before it gives way to the next cold period.
“It is time to bury the grand solar minimum myth” … https://wattsupwiththat.com/2023/02/18/it-is-time-to-bury-the-grand-solar-minimum-myth/
WUWT tells us that principal component analysis is flawed and that averaging temperature is useless and meaningless. Yet here we have another article that does both. And why is Zharkova truncating solar cycle data after 2020 in paper published in 2026 anyway? It couldn’t possibly be because the post 2020 data is contrary to her original prediction of the timing of the onset of a GSM could it?
There is an adage in journalism that by framing a story as a question one can avoid accountability about accuracy. Like, “Mr. Doe just hugged his personal assistant after receiving a notable award, is there a scandal brewing here?”
Why don’t you just come out and say that you suspect Zharkova modified using false data in his theory? Then present your evidence.
WUWT “tells us” a lot of different things, sometimes even contradictory things. That’s because WUWT is not a monolithic voice that echoes only a single view – it shares many different voices and different views.
You’ve been around here long enough that you should know that.
“WUWT is not a monolithic voice that echoes only a single view – it shares many different voices and different views.”
Tony_G, this might look impressive at first glance, but in science, it really just highlights a lack of replicability.
By contrast, AGW isn’t a one-off observation. It has been validated across multiple independent domains. All the evidence converges on the same conclusion: the planet is warming, and the culprit is the rising concentration of carbon dioxide.
it really just highlights a lack of replicability.
To apply your position to the almighty “peer-reviewed” journals, said journals must thus never publish something that goes against something they have previously published, otherwise that highlights a lack of replicability.
The problem with your position: Replicability applies to individual papers or articles, not to the full corpus of works of a published body. You’re not even vaguely talking about the same thing here.
Using pattern analysis, it may be assumed .. that this is a commercial for Professor Valentina Zharkova of ZVS Research Enterprise Ltd., London, UK.
“The theory that solar activity—specifically the solar wind and magnetic fields—affects cloud formation was primarily developed by Danish physicist Henrik Svensmark ”
Been on this one since John Daly.