Roger Caiazza
I have long been meaning to address the myth that renewables provide the cheapest electricity. This myth has achieved “everybody knows that” status which means that a rebuttal must have strong supporting arguments. A series of articles at the Science of Doom blog by Steve Carson explains why this myth is not true. He sums it up: “We built a lot of cheap intermittent energy, and now the expensive part is making the system work when that energy isn’t there.”
Carson explains why cheap renewables don’t automatically produce cheap electricity in a reading guide to his recent renewables posts. Fellow traveler Francis Menton and I have long argued that before continuing with New York’s renewable energy madness that a test jurisdiction should implement the transition mandates so we can see what happens. Carson wrote 14 posts “starting with a broader look (including China and Europe), then drilling into South Australia as the most useful real-world laboratory for high renewables” that examines the reality of other jurisdictions.
I recommend the entire series. Carson suggests that if you’re new to this series, the best way to read it is in time order. Each post stands alone, but “together they build a clear picture of why “cheap renewables” doesn’t automatically produce cheap electricity, and why the system ends up paying for flexibility, backup, and wiring.”
If you don’t have time to read them all, Carson suggested the following:
- If you only read one: The Pricing Paradox
- If you want the South Austrailia (SA) market story: Pricing Paradox → Batteries in SA → Market Machinery → Negative Price Puzzle → Invisible Renewables Market → Solar Lunch Break
- If you like infrastructure + geography: Germany Keeping the Lights On → 1,500km Relay Race
- If you want “costs to consumers”: Germany/UK/France: Price of Energy Transition
The remainder of this article lists the post in sequential order with a short summary for each.
1) China Renewables and PR
Steve Carson explains how easy it is to tell very different stories using the same data. China’s renewables growth is huge — but so is coal. This post explains which data (energy TWh, percent growth of a cherry-picked year) you use can get your preferred answer
2) Germany and Renewables
This post describes a similar situation for Germany. Germany’s domestic generation mix has changed since 2015. There has been a significant drop in demand (due to heavy industry shutting down) and generating sources have changed: “coal down hard, nuclear to zero, wind/solar up massively”. In this case it does not matter how you choose the data – the answer is always the same. Carson points out that imports fill the gaps caused by intermittent renewables. This post is the “big picture” before subsequent posts follow the power across borders.
3) Germany, Renewables & Keeping the Lights On
Green energy proponents often point to the success of the German shift to renewables as proof it can be done. This article explains how it was done and why it is not transferable. In short, the German transition to alternative energy often uses Interconnectors as “extended grid storage”: The article describes “Germany’s imports, who supplies them, and why cross-border wiring quietly does three jobs at once — sharing cheap generation, sharing backup, and sharing weather luck.”
4) The 1,500km Relay Race: Why Spanish Wind Struggles to Reach Germany
The assumption buried in academic studies that claim to show that wind, water, and solar zero emissions generating resources can supply the grid effectively without new technology is that the wind is blowing somewhere when it is not blowing at home. This post takes a deep dive into the unacknowledged physical bottleneck: transmission. Carson explains that Spain can be “anti-Germany” meteorologically, but “moving power across borders is a multi-decade, multi-billion euro relay race.”
5) UK and Renewables
In this post, Carson looks at the United Kingdom situation. He described UK generation from 2015–2024: “coal collapses, wind surges, nuclear declines, and gas stays central.” His approach uses a simple data-first view that “sets up the follow-up question: what does “renewables success” mean in system terms?”
6) UK and Renewables: How the Magic is Done
The next post digs into the data deeper. He shows that “the UK is leaning on (imports, gas, biomass accounting, etc.)”. I believe that marketing is an essential part of the message of green energy proponents and Carson explains how “a high-renewables narrative changes once you include full system constraints.” That would be all the caveats that those proponents ignore.
7) Germany, UK, and France: The Price of Energy Transition
Carson sums up the previous articles in this one:
Germany increased wind and solar hard — but also saw some de-industrialisation (industry moved) and a big change in how much electricity it traded with neighbours. The UK turned coal off, leaned heavily into offshore wind… and increased the burning of woodchip. Both countries also leaned more on imports — especially French nuclear-dominated exports and Norwegian hydro.
Carson states “The spruikers of the energy transition often promise that because wind and solar have zero fuel cost, electricity prices will inevitably fall.” I had to look up spruiker – it is an Australian slang term for a barker’s spiel. Carson examines what consumers actually experience — “the cost stack, the trade-offs, and why ‘more renewables’ doesn’t map neatly to ‘lower bills’ without flexibility and wiring.” I recommend this series because he does an excellent job unpacking the components of electricity costs. In this example, he breaks down the wholesale market price, grid charges, and additional costs like taxes that together make up electric bills, and shows how these factors influenced prices in Germany and England compared to France, which did not pursue renewables as aggressively.
Carson goes on to use the South Australia experience for a deep dive into “the daily price rollercoaster and what it really means” in the remaining seven articles in this series.
8) The 100% Experiment: How a Small State Became the World’s Renewable Laboratory
He argues that South Australia is the most appropriate real-world lab for high renewables because “it has huge rooftop solar, lots of wind, and tight interconnection”. This post sets the stage: what changed from 2015–2025, and why the grid behaves differently from fossil-era intuition.
9) The Pricing Paradox: Why ‘Free’ Solar Leads to $15,000 Energy Rollercoasters
It is New York State doctrine that a renewable system is better than the current system because fossil fuel volatility is high and a wind and solar system eliminates external causes of volatility. Carson explains why a renewable system has its own volatility problems: “Midday prices go negative and evening prices spike to extreme levels.” This post “explains the “canyon curve” and why wholesale volatility doesn’t translate into cheap household bills.” The author recommends this as the “best entry point if you only read one South Australia (SA) piece.”
10) Batteries in SA: The Market in Operation
Since I started my blog in 2017, I have discovered that every aspect of the energy transition is a can of worms upon closer inspection. This is a great example. Proponents of New York’s Climate Act position battery storage as a multi‑purpose enabler: shifting surplus wind and solar into peak hours, providing capacity and ancillary services as fossil plants retire, and reducing overall system costs. In the SA example, “batteries aren’t being built to store “a day” of electricity — they’re being built because the market pays for fast response in the shoulder periods.” This post shows what batteries actually contribute on the grid, by time of day.
11) Batteries and the Market Machinery — How the Grid’s ‘Invisible Hand’ Rewards Speed
Continuing my argument that every aspect gets more complicated upon closer examination, Carson delves into the NEM market rules. The National Electricity Market (NEM) is the interconnected wholesale market linking Queensland, New South Wales, Victoria, South Australia, and Tasmania. Carson explains “how the NEM rewards speed: 5-minute settlement, Frequency Control Ancillary Services (FCAS) “twitch” markets, negative price behavior, and why grid-forming inverters matter.” This is another good example why this series is so useful. Carson breaks everything down and describes what is happening to describe a very complex situation.
12) The Negative Price Puzzle — Why Generators Pay to Produce Electricity
In the alternate reality of renewable energy negative electricity prices are a feature of a system that has large wind and solar capacity. Carson explains why “Negative prices aren’t a glitch — they’re how the market clears surplus supply when some generators can’t or won’t stop.” He delves into “Coal/gas cycling economics, wind/solar incentives, and why negative bids can still be rational.”
13) The Invisible Renewables Market: From LGCs to CIS to REGO
This post explains how renewable subsidies work in SA. As a result, the jargon will be different for other jurisdictions. He describes:
The “second market” that helped fund renewables: Lage-Scale Generation Certificates (LGCs). Who pays, how the cost shows up in bills, why LGC values collapsed (because the scheme worked), and what newer mechanisms are trying to do instead.
There are two newer mechanisms. The Capacity Investment Scheme is a federal program that underwrites new renewable and clean dispatchable capacity, run through competitive tenders in the NEM regions. Renewable Energy Guarantees of Origin (often shortened to REGO) are tradable certificates that verify that a given quantity of electricity was generated from renewable sources. I think but cannot prove that most markets have similar mechanisms.
14) The Solar Lunch Break That Coal Can’t Take (and Gas Only Sort of Can)
This is another example of the hidden complexities of the electric system that insiders understand but renewable spruiker spiels ignore. It is a more technical post that explains “why thermal plants can’t simply shut down at 8am and restart at 4pm without cost and risk.” This is the “physical side of the negative-price story — ramps, starts, cycling, and why batteries are a useful bridge.”
Discussion
While preparing this summary a few quotes from the articles caught my eye.
Results from Germany, England, and France show that:
- System Costs Overwhelm Commodity Savings: While the “Wholesale” cost of a windy day might be low, the cost of managing that variability (the Blue Layer) and the “legacy” subsidies of the past (the Red Layer) are driving the total price upward.
- Decarbonization via Imports: Both the UK and Germany have “decarbonized” partly by importing French nuclear and Norwegian hydro. They have outsourced their grid stability to neighbors with firmer foundations.
- The Nuclear Dividend: France, despite its 2022 technical crisis, maintains a more stable and lower-priced retail environment by avoiding the massive “Redispatch” and “Capacity” costs that plague its neighbors.
The deep dive into the South Australia test case made the following points:
Data from SA demonstrate the “Pricing Paradox”: how “free” fuel from the sun and wind has created a market of extreme highs and lows that rarely results in a “cheap” bill for the average household.
An important point – batteries like negative prices because charging becomes cheap (or paid), but batteries are limited by energy capacity and state of charge — they can’t absorb infinite surplus.
That’s the punchline from the earlier articles:
- Midday prices go negative because solar overwhelms demand.
- Evening prices spike because solar vanishes and wind often can’t fully cover the gap.
- The scarcity signal has pulled in batteries — not to “run the state overnight,” but to act as a fast bridge while slower plant and imports ramp.
So the real shift isn’t “renewables are cheap.” The real shift is:
We built a lot of cheap intermittent energy, and now the expensive part is making the system work when that energy isn’t there.
Conclusion
I highly recommend this series of articles as a great source of information about the myth of cheap renewables.
Steve Carson’s original Science of Doom website addressed climate science. Now he publishes on a Substack of the same name.
Roger Caiazza blogs on New York energy and environmental issues at Pragmatic Environmentalist of New York. This represents his opinion and not the opinion of any of his previous employers or any other company with which he has been associated.
Solar has it’s place.
If you are running a mining camp and plant off grid and using diesel generators as your fuel source, then by all means install solar panels.
The solar input will reduce your diesel fuel consumption and your bills will drop.
BUT…. How much can you add before the system becomes unstable?
I would imagine that a demand based on purely resistive elements, where the load varies over long intervals can be managed with 100% solar. Even a basic inverter will manage those loads. At the other end of the demand spectrum is reality. If the demand curve has sudden stops and starts, for example your crushing plant stops operation due to a blockage or starts up after maintenance what happens? There is no inertia on the line. Will the voltage sag and surge, tripping the inverter?
And if you set the inverter to allow these sags and surges how much damage will occur to the sensitive equipment like your computers?
There is a limit, there must be. Strangely you just don’t see any real world studies published to explain the reasons for the apparent/observed 30% penetration limit for W&S, above that 30% value things don’t always work as planned. As an example, I give you Spain. What was their limit before the instability crept in?
Too right about remote mines and outback cattle stations using solar and wind for supplemental electricity generation to cut down as much as possible on diesel fuel consumption.
These are businesses, every expense line item is constantly reviewed for ways to reduce the costs.
Solar & wind use aren’t virtue-signaling environmental statements.
Diesel generators are still their mainstay power source.
As Vito Corleone would say – “it’s just business”.
I just don’t see that many serious mines could operate economically on solar and diesel. A rare situation. It certainly is possible.
Go to north west, Western Australia. There are quite a few of them.
In recent years the plants have been changing over to gas fired, (thanks to the Dampier to Bunbury pipeline but not everyone is near enough to make use of it).
Grid backup is the major Achilles heel for renewables. Explaining spinning reserve to a renewable advocate usually gets the “batteries can take up the slack” misconception.
Great summary – thanks for that!
two major logic errors in LCOE
A – LCOE only computes the cost of generation, not full system costs
B – LCOE assumes all electricity generated from renewables is consumed. Therefore total generation cost is divided by a denominator which is all the electricity produced. The reality is with high renewable penetration, you have to have significant over capacity to produce on the slow days. The creates a lot of excess electric generation that is wasted. The result is a grossly overstated denominator.
That is exactly right and its almost universally ignored. Just like if you are producing any kind of product for which there is no market, if you carry on doing it and booking it as revenue, you end up with inventory write downs and, on a sufficient scale, prosecution for accounting fraud.
LCOE is a variant on the traditional ‘stuffing the channel’ accounting fraud, when you book revenue credit for unsaleable inventory, and sooner or later end up writing it down and restating your revenues lower.
The turbine is producing 100MWh. Using LCOE you divide this into total system costs which gives you a low unit cost number. But only 75MWh is saleable, so this is all you should count when determining unit cost. Its ridiculous to claim to have lowered your unit costs by producing unsaleable goods. Even though the wind and sun are free!
This is different from constraint payments, which are a profitability problem, they mean the operator is being paid not to produce. LCOE is about the overall business case, unit costs, and when you are determining unit cost per MWh you cannot count MWh production which cannot be sold because of lack of demand.
Done right this will lower the capacity factor and blow the business case out of the water.
The next time someone tells you that the capacity factor of offshore wind is 35%, just ask them how that number is calculated. Ask how much of those MWh are produced when there is no demand. Same with solar: it fails at night obviously. But what about peak production at 12 noon? How much of that is unsaleable?
Wind and solar are just wishful thinking. There is no way around intermittency, both lack of production when needed and over production when not needed.
LCOE in any other context would be regarded as accounting fraud.
Michael Agreed. This is basic accounting, basic budgeting, basic forecasting, basic financial analysis. The advocates hate individuals with actual real world expertise.
As one advocate stated on skeptical science – Grid operators and fossil fuel electric generation operators are not “renewable energy experts” and therefore their knowledge is meaningless.
neither of us are “renewable energy experts ” so our actual real world expertise and knowledge is of no value.
We need to find a way to impress upon the
Renewables IndustryHope Industry that no matter how hard you hope, electricity will never go straight from the sun to your kitchen’s power outlets.Yep, the old “HOPE OVER EXPERIENCE” trap for ‘believers’.
Much of this is over my head. But, one obvious problem to me is that the renewables don’t last as long as a ff power plant- so you have to buy them over and over by the time a ff power plant needs to be shut down due to its age. Is this cost problem somewhere in all the documents mentioned in this article? Or is this not really an economic problem contributing to the cost of electricity?
In other words, let’s say you spent X number dollars for a ff power plant. Then you depreciate it over several decades and in some way you factor that into the current charge for electricity. Standard accounting, right?
Same for renewables- but if they only last 1/4 as long as a ff power plant and you have to rebuild them (renew them!) then that future periodic cost must be factored into the current charge for electricity. Don’t you have to bring all those future costs to the present in proper accounting?
I’m not saying this clearly as I don’t understand the economics of power generation and I’m tired late in the day, being a geezer, so maybe I’m making no sense. It just seems that the short life span of renewables must push up the cost for the electricity in the short term.
It’s worse than you think. At some point you will be replacing at least half of the installed panels and turbines, at the same time, in the world. Unplanned obsolescence, or planned?
The 20 acre solar “farm” next to my ‘hood was built in ’12. About 5 years later they had to replace maybe 10% due to a lightning storm that damage them.
Michel – frequent commenter here – has explained many times that the ONLY way to properly account for current & future costs of plant is application of “Net Present Value” (NPV) assessment.
Play it again, Michel.
It would be the equivalent of painting the Forth Bridge. As you get to the end of installing the infrastructure, it would be time to replace the first units.
But wait, there’s more. End of life of solar panels, wind turbines and batteries create toxic wastes that aren’t easily recycled or remediated, especially for battery fires that can pollute air, water and soil.
Steve Carson is right to choose South Australia as a working example. But I don’t think he is on top of how it works. He says:
“Retailers (like AGL or Origin) act as Shock Absorbers. They buy power at the volatile 5-minute spot price but sell it to you at a flat, stable rate (e.g., 40c/kWh).”
No, they don’t buy on the spot market. They buy under contract, and in fact often (eg AGL) own the generators. That is the real reason why spot prices are so volatile. They account for only a small fraction of traded electricity. If electricity runs scarce, only a small fraction of output is availale to spot buyers.
But what he seems to miss is that average result. SA has gone from being (with coal) the most expensive to being now mid-range in wholesale cost, and from importer to frequent net exporter.
Low or negative spot prices when wind and solar are actually supplying their erratic electricity, are one of the main reasons investment in them has stalled.
Pointless installing new wind and solar on the grid when you can’t make any money from it.
The highest spot prices are when the small grid batteries have to be used for a short period..
… the battery bids set the high price, usually when there is little wind and solar…
… so coal and gas make a nice profit…. and wind and solar make basically nothing.
Its fun to watch 🙂
ps..
the amount SA uses and exports is almost insignificant compared to the electricity use in the 3 main states.
Yet they still regularly need 50% gas and large imports.
Nick, consumer bills for electricity supply & consumption are all that matter.
Academic exercises in wholesale pricing for generated power means nothing to households if the transmission costs of the generated power push the average bills to ~ 45 cents / kwh.
Up there with highest bills in the world.
Where I now live, we pay AU 11.5 cents / kwh.
Still living down to your title of Nitpick Nick.
But since you want to be technical, yes retail supplier do buy at spot prices. You only rate a Duck.ai search, but when asked “how much of Australia’s electricity is purchased on the spot market” it responds with “approximately 10% of Australia’s energy is purchased on the spot market”.
In fact, the AEMC even says you’re wrong:
https://www.aemc.gov.au/energy-system/electricity/electricity-market
FTA: “The wholesale national electricity market (NEM) is where generators sell electricity and retailers buys electricity. Retailers then resell electricity to businesses and households.
There are two ways to buy and sell electricity in the NEM wholesale market: through the spot market and the contract market.”
And to further demonstrate your speciousness:
Mr. Carson points out that “In Q4 2025, South Australia recorded negative prices in 48.4% of all intervals.”.
The funny thing is that to get to his comment about Spot Pricing you had to read over the comment I just quoted, and then you STILL tried to argue that “average” prices have meaning. To make this worse for you, ‘negative’ prices can actually ADD to the true cost of the power because the generator is paying someone to take the electricity that isn’t being used.
And, then you brought up “If electricity runs scarce, only a small fraction of output is availale [sic] to spot buyers.” So, what kinds of things make power unpredictably scarce Nicky?
There goes the great Stoke Lie and con again he wants to talk about wholesale cost NOT retail cost. South Australia has a tiny grid because it’s concentrated in and around Adelaide.
Look at the real picture not the garbage Stokes is trying to smokescreen
https://www.macrobusiness.com.au/2025/09/energy-reality-smacks-south-australia-in-the-face/
SA will achieve 100% renewable for periods of time but they will still always have the most expensive power in Australia and it doesn’t matter what garbage Nick wants to trot out.
IEE Japan did a study of the cost of implementing renewables into the Vietnam grid.
HORRENDOUS…
and they didn’t even consider many of the main costs to society.
Wind and solar are EXPENSIVE PARASITES where ever they are connected to the grid system
image didn’t attach, sorry
Very nice overview of the hidden costs of renewables…
Some addition on point 4:
“The wind always blows somewhere in Europa” is what some use as argument for renewables, but even that is often not the case…
Indeed there is the fact that with full wind in N.W. Europe, one need to install and export the full capacity of all other countries in Europe in and from e.g. Scandinavia to Greece or with full sun in Greece the other way out, which assumes enormous capacity of both the installations of wind and sun in every country and enormous capacity of all the connection lines…
Moreover, the wind doesn’t blow and the sun doesn’t shine always, not even in Europe as a whole: here the figures of several weeks in 2024, where in whole Europe (not only the EU) sun and wind together didn’t deliver more 10% of the installed capacity:
https://energy-charts.info/charts/power/chart.htm?l=en&c=ALL&interval=week&year=2024&week=45
The installed capacity can be found under “Power” and “Installed Power” for the current and previous years.
And one can find more periods where all wind and sun together simply fail to deliver what is needed, even with a multiple of the installed capacity…
Storage capacity is limited to about 10% of yearly need in Europa and also limited in momentary delivery capacity…
You left out the bestest part! All the toxic waste from solar panel and wind turbine production and disposal. And lithium battery production and disposal. Gasoline was a waste byproduct of refining oil back in the day. Wonder what uses the toxic waste created by “green” energy will be found. How about using it to replace the drugs used to execute convicted criminals. It’s free! Hahahahaha!!!!!!!
Professor Roger Pielke, Jr. says:
https://rogerpielkejr.substack.com/p/renewables-are-not-renewable
Interesting article, though the one graphic <a href=”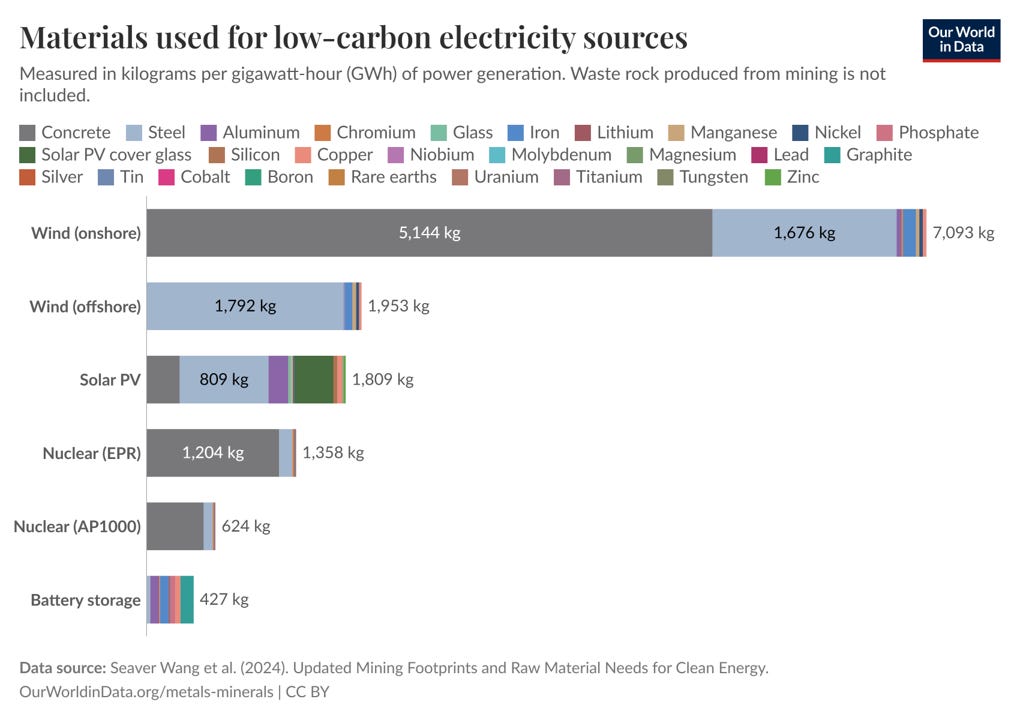 “>graphic</a> doesn’t make sense. It shows the amount of material that needs to be mined for 1 GW-hr of battery storage is 427 kg. A Boeing 747 200B carries 204,360 L (or 167,575 kg) of jet fuel which produces 2 GW-hr heat energy when burned. So if we converted the 747 to electric propeller drive, we’d only need 854 kg of batteries. I don’t think so.
The evidence from the Australian NEM is clear. Increasing renewables penetration has brought higher, more volatile prices.
Wind turbines and solar panels ONLY generate electricity but CANNOT make any products or transportation fuels for life as we know it.
The world is not dependent on raw natural fossil fuels BUT has become dependent on the products and transportation fuels MADE FROM oil, the same products and transportation fuels that Wind and Solar CANNOT make!
Planes, ships, trucks, and cars do not run on raw crude oil, they run on transportation fuels manufactured FROM crude oil by multi-billion-dollar refineries.
Anyone who has bent a wire or a piece of metal multiple times to make a fracture know this. Heating creates stress through expansion. Cooling creates stress through contraction. The result is a fracture point that will fail just like wire breaking after bending it multiple times. Boilers and associated piping are not immune from this.
Gas turbines and diesel engines are not immune. Jet engines in aircraft usually undergo comprehensive inspections annually to check for cracks, bearing failures, etc. Does anyone know why truckers let their trucks idle when refueling, eating, etc.? Restarting a cold diesel engine is hard on the engine. Wear occurs as the oil film on cylinder walls is too thin during the first moments of startup, and corrosive acids condense on cold metal surfaces.
The argument against renewables is strong, but not given here, unfortunately.
Good contribution! However, the term ʹrenewablesʹ is a misnomer. The manufacture of green energy devices requires large amounts of critical trace metals, including some of the rarest elements in the Earths crust (<0.1 ppm) such as Se, Cd, In, and Te. Due to a lack of recycling at industrial scale, they need to be mined as rare byproducts from base metal deposits. Once a mine is exploited, a new one needs to be explored and developed. There is nothing ʹrenewableʹ about that! A recommended read can be downloaded for free at the online journal Habitable Planet at https://www.sciltp.com/journals/hp/articles/2603003359