From NOT A LOT OF PEOPLE KNOW THAT
By Paul Homewood

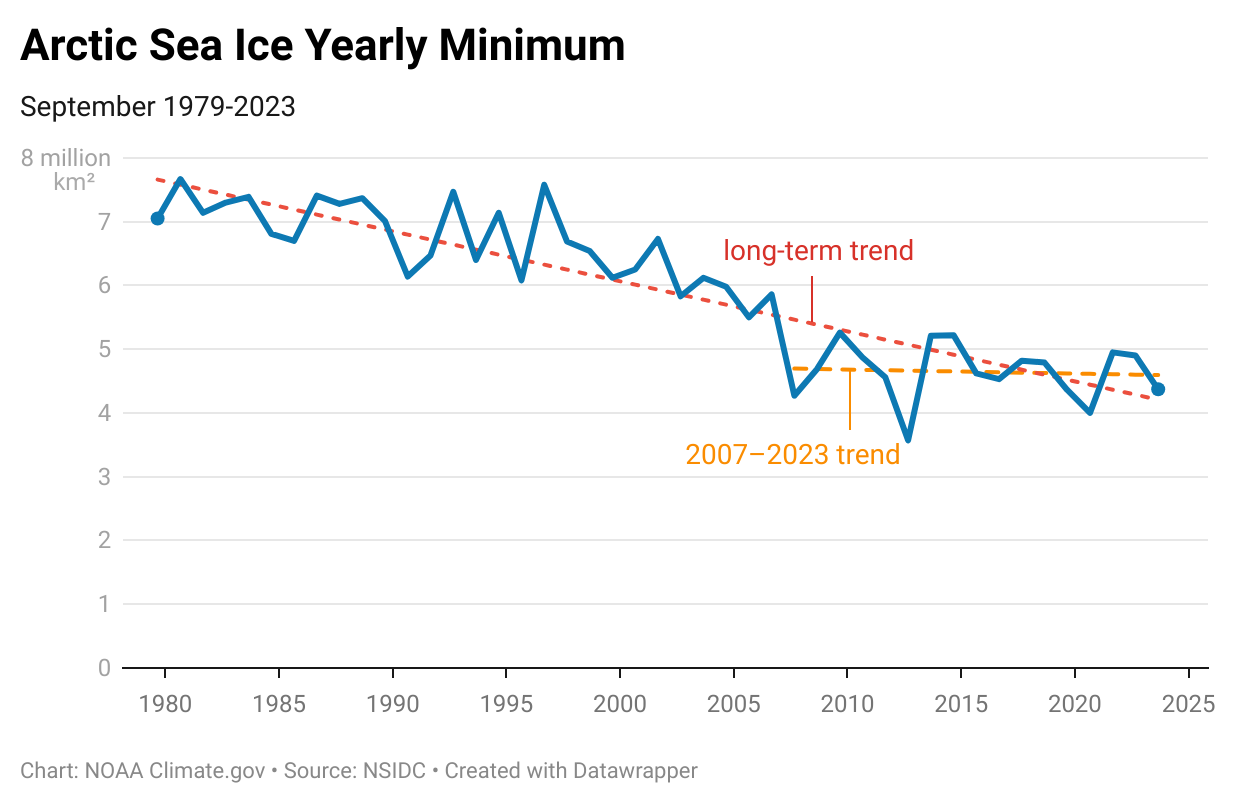
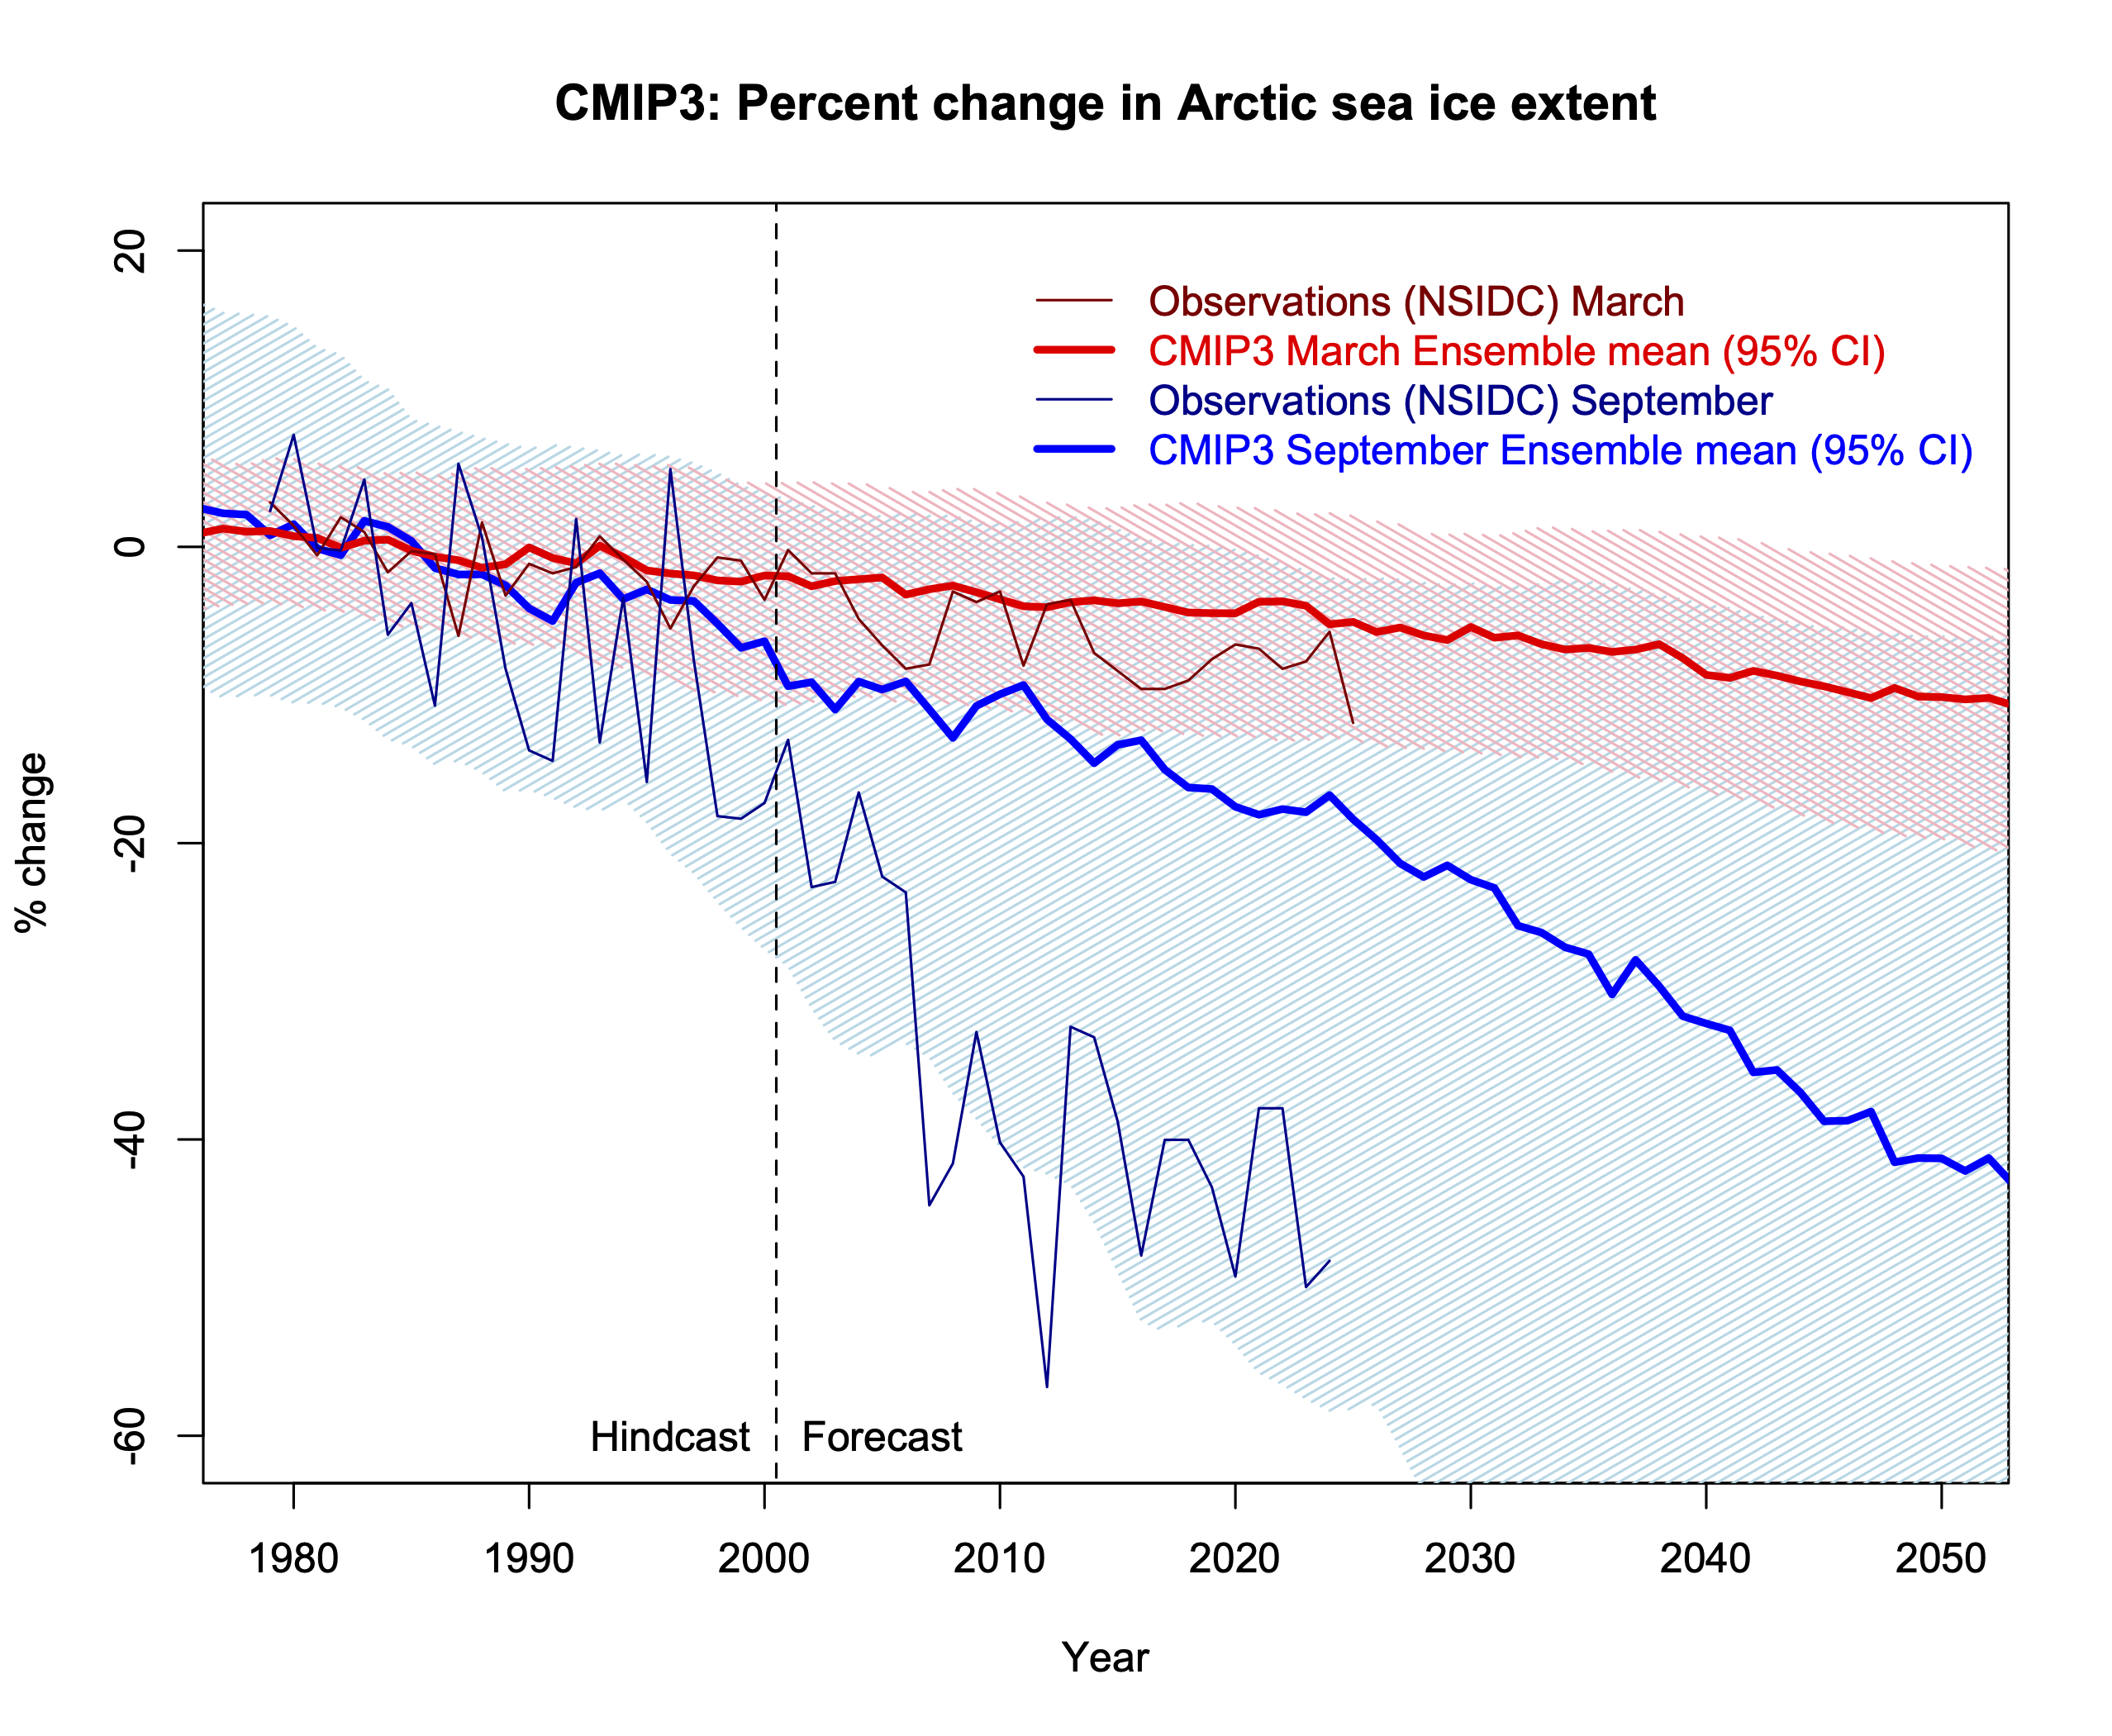
First, the Arctic sea ice refused to melt away, as the “experts” predicted.
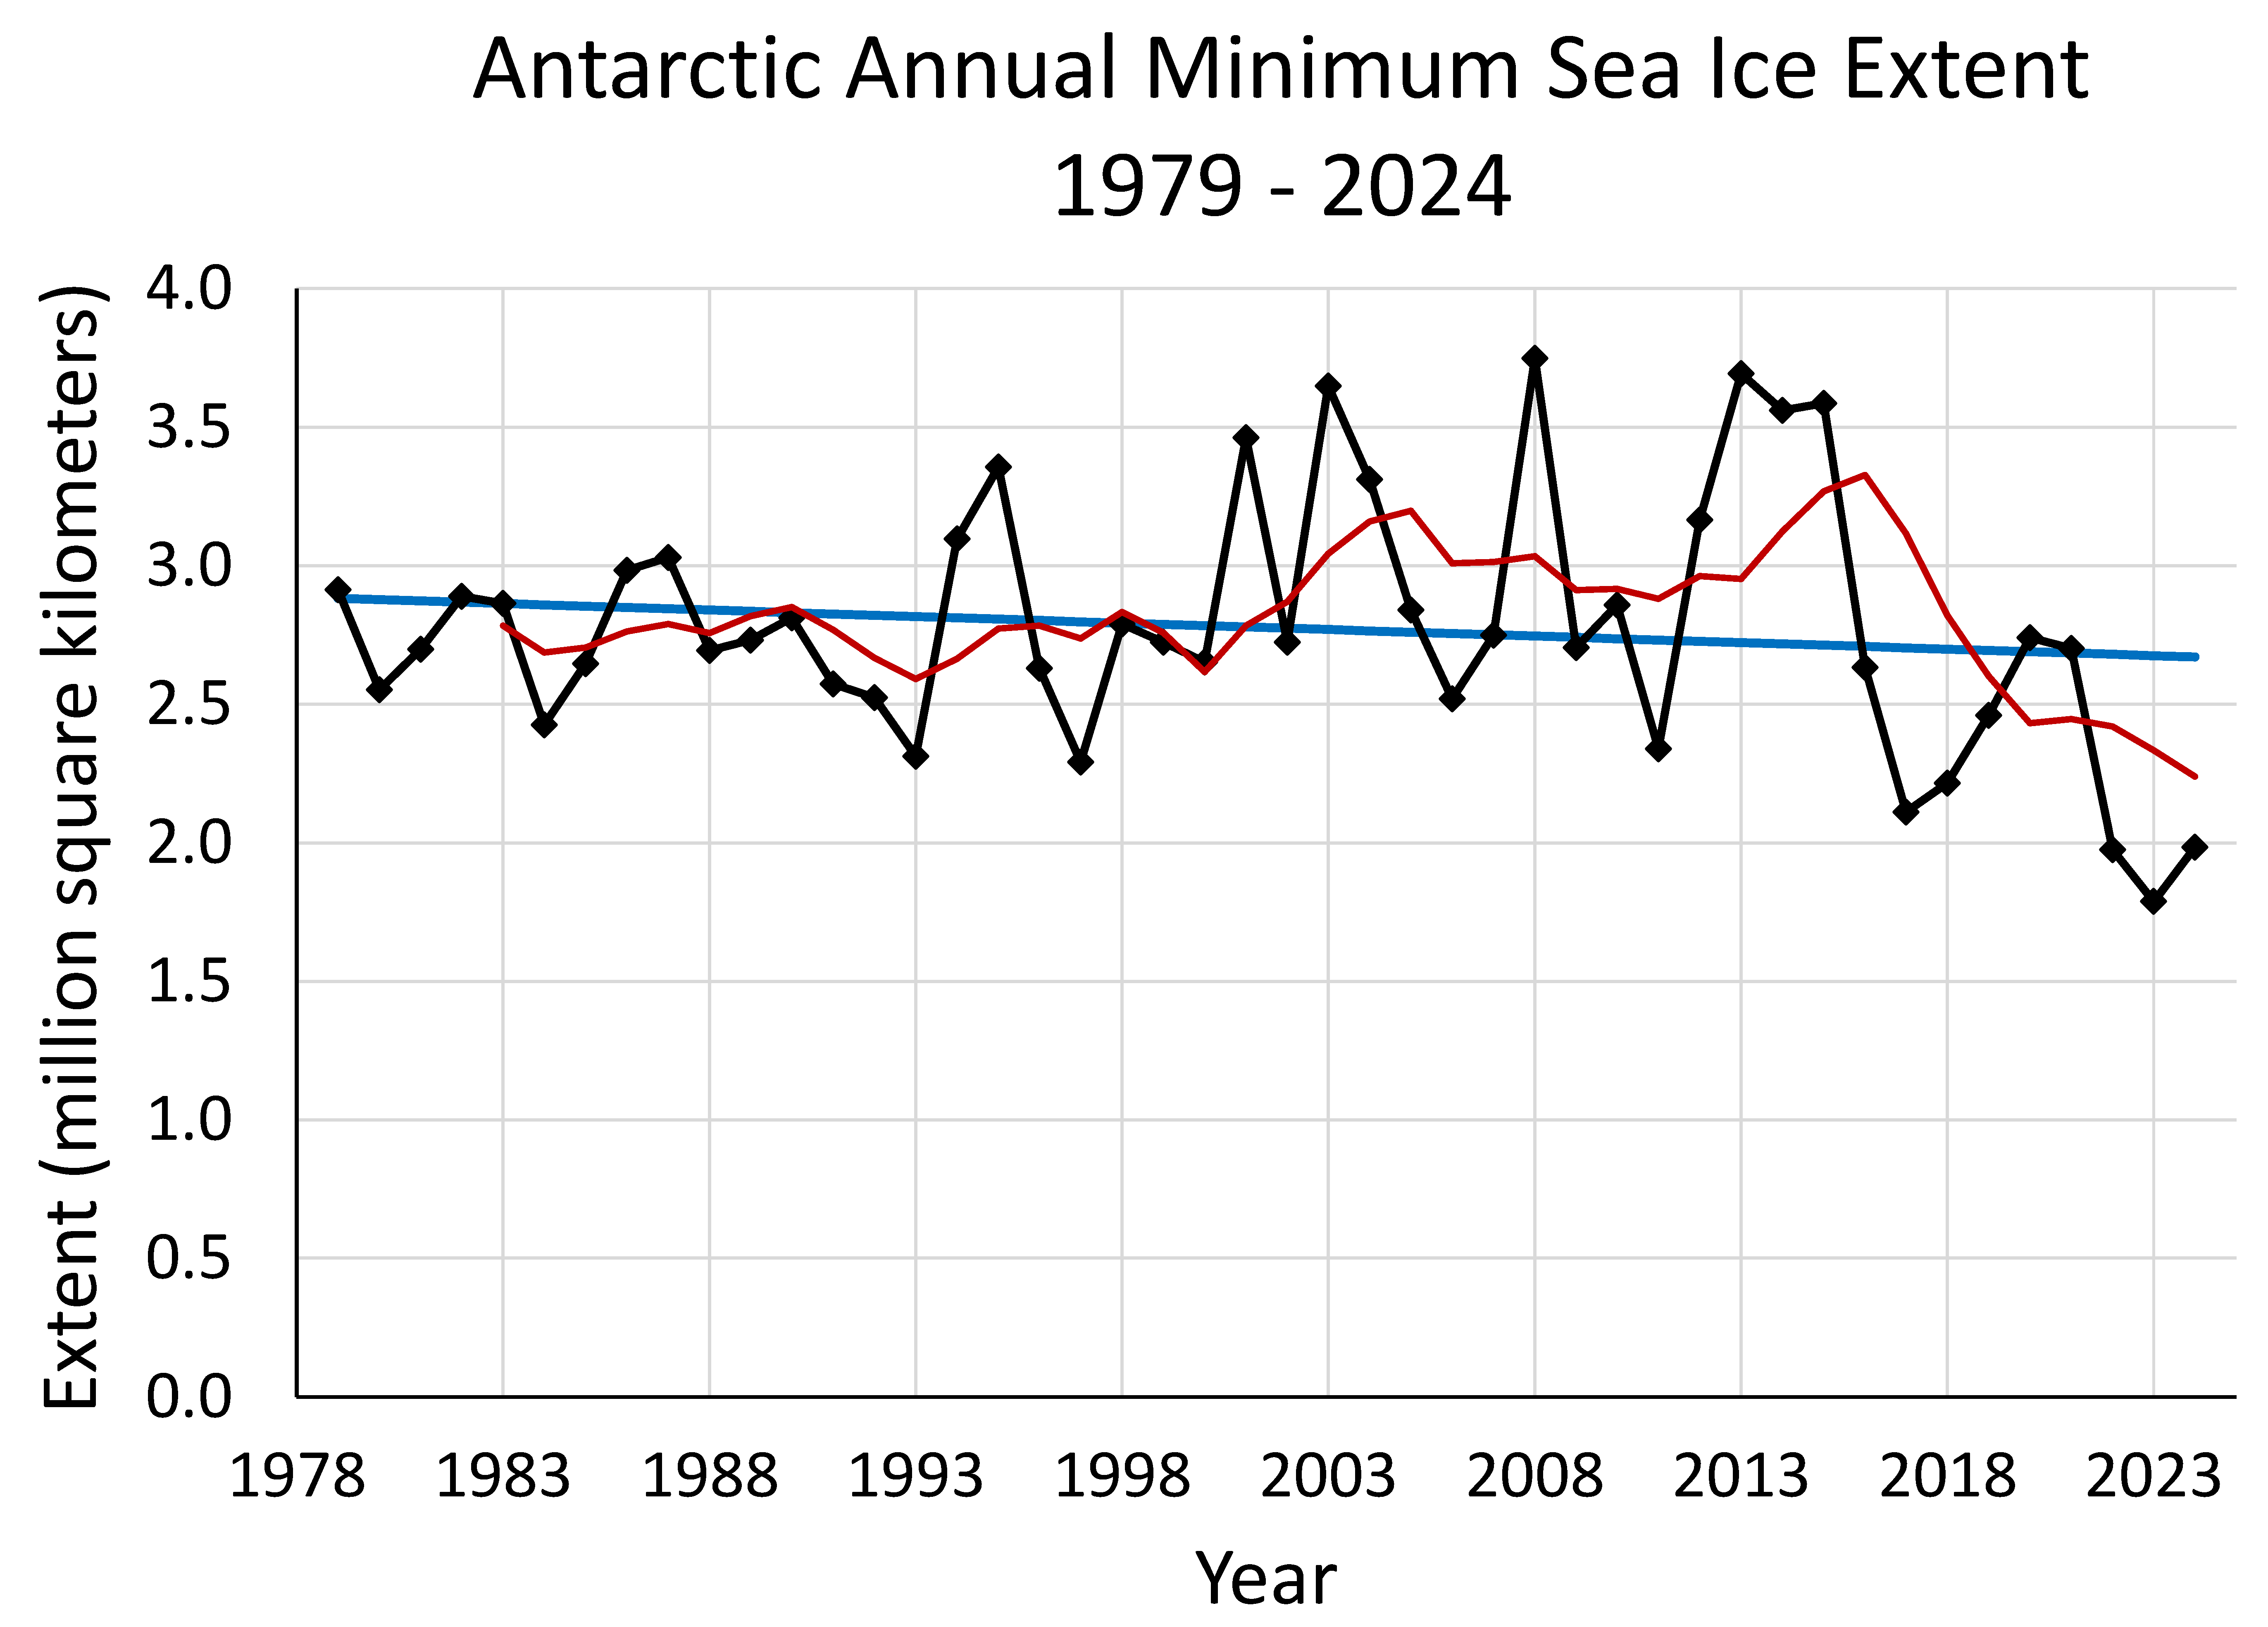
So they turned their attention to the Antarctic after a couple of years with less ice than usual.
Sadly for their credibility, this year the sea ice cover is close to normal again.
Forget about that fake slope – it is statistically meaningless, given the short timescale and the massive interannual variation.
And they can hardly blame a few years of low ice extent on global warming, when we also had record highs a decade ago.