by Dr. Alan Welch FBIS FRAS
This report presents and analyses the sea level data for 2025. It was a roller coaster year for sea level data that turned into a “Hunt the Data” exercise. As a consequence, the analyses main purpose is to link the new data to the old and produce a new methodology so that changes to sea levels in 2026 can be more easily judged.
The NOAA site: https://www.star.nesdis.noaa.gov/socd/lsa/SeaLevelRise/LSA_SLR_timeseries.php
gave data for the end of January then no more for the rest of the year. Does anyone know why and/or if the data is available any other way?
The NASA site: https://science.nasa.gov/earth/explore/earth-indicators/sea-level
produced data for January, April, July, August, September, November and December but in July 2025 NASA changed dramatically the amount of data being provided. Up to April 2025 the data consisted of 13 columns giving number of readings, standard deviations and results with and without a 60-day Gaussian type filter applied, with and without GIA not applied and with and without annual and semi-annual signal removed. The data analysed was from COLUMN 12 which was for smoothed (60-day Gaussian type filter) GMSL (GIA not applied) variation (mm); annual and semi-annual signal removed.
Whereas in July only 3 columns of data appear:-
HDR 1 year+fraction of year
HDR 2 GMSL (cm)
HDR 3 GMSL with 60-day smoothing applied (cm)
with the 3rd column being used in the analysis.
Also, up to April 2025 data appeared on a roughly 10-day cycle but in July this changed to a 7- day cycle. To add more misery the U.S. Government shut down stopped any data at all being provided for a couple of months.
To show he differences in the data used for the analyses Figures 1 and 2 give the diagrams provided by NASA for April and July 2025.

How to proceed?
Up to April 2025, after 7 years of studying the NASA data, several standard Excel spreadsheets had been created producing plots of the Full Data with best fit Linear, Quadratic and Sinusoidal curves with the associated equations and plots of residuals, measured from the linear line, with best fit Quadratic and Sinusoidal curves. Also, statistical results have been produced and historical plots of how the so called “accelerations” had changed with time.
One approach would be to use the data as it is with the old spreadsheets, but this would lead to very “bumpy” plots. The annual and semi-annual signal vary from -4.33 to 5.46mm which is quite large when compared with an annual average increase of about 3.3mm.
A second method would be to do a moving annual average which would eliminate the bumps but would also lose a lot of the El Niño/La Niña effects which are useful to show.
The annual and semi-annual signal is a regular variation that repeats year in year out with the same shape, so the amount involved only depends on the date in the year. Using this fact the signal’s value at any time in the year can be ascertained from the readings with and without it included. This was done using the difference between columns 11 and 12 of the April 2025 data, creating a list of dates and differences then subtracting the year value from the date. This leaves 2 columns for the partial year date and the annual and semi-annual signal which is shown in figure 3.

An 8-order polynomial curve was fitted to the graph in figure 3 using the LINEST Function in Excel, resulting in
y = -6643.928484 x8 + 25497.575242 x7 – 37890.084128 x6 + 27118.787657 x5 – 9446.372672 x4 +
1420.212996 x3 – 37.494970 x2 – 18.784928 x + 0.200699 Equation 1
The order and accuracy may look excessive, but a 6-order was found to be too inaccurate at the extreme ends of the graph and although 2 less significant figures only changed the graph slightly it was decided to stay with this equation. Figure 4 shows a plot of the actual and fitted curves indicating only a small inaccuracy at the extreme ends of about 0.1mm.

The new data with annual and semi-annual signals can now be processed by taking the sea level and calculate the part year by using a calculation in Excel
Part year = year – INT(year)
and then calculating the annual and semi-annual signal using Equation 1. This can then be taken off the listed sea level and the normal processing carried out.
I wish life was that easy.
This process was applied to the NASA Aug 2025 data which only had data with the signal included. The result was not satisfactory with the Aug data having a seemingly larger variation than what was shown in previous data releases.
Another source of readings is from our friends at the University of Colardo. Their site https://sealevel.colorado.edu/data is a useful source of information even if you don’t like the conclusions they reach like extrapolated sea levels in 2100. The site has 2 sets of processed data shown in figures 5 and 6. The “acceleration” indicated is 0.071mm/year2 which is line with other estimations. Strangely this site has removed several figures for analyses carried out between 2020 and 2025.

Repeating the process shown in Figure 3 resulted in

The equation for an eight-order polynomial is given by Equation 2.
y = -7765.207058 x8 + 32631.342618 x7 – 54125.59435 x6 + 44768.098468 x5 – 19273.077711 x4 +
4111.056244 x3 – 321.22496 x2 – 25.210076 x + 1.282815 Equation 2
The comparison of this eight-order polynomial with the actual values is shown in Figure 8.

This shows a similar form with some small differences in shape and is generally about 30% more than in Figure 3. The best option therefore is to use the data as supplied by NASA and accept that any graphs will be affected by the annual signals.
The sets of data analysed are therefore January and April 2025 with the full data and July, August, September , November, and December 2025 with the reduced data. The data for April 2025 and December 2025 will both be processed for comparison.
Figures 9 and 10 show the linear and quadratic best fits of the full data.

The differences in the equation’s coefficients seem larger than would be expected but it is more revealing the change year on year with consistent sets of data so 2026 data will be more revealing.
The residuals are plotted in Figures 11 and 12 together with the quadratic best fit curves and the standard deviations of the errors added. To check this process is carried out correctly the quadratic terms are compared with that for the full data and the linear fits checked as being given by y = 0 x + 0.

Next in Figures 13 and 14, the residuals are plotted together with a sinusoidal curve having an amplitude of 4.2 mm and a period of 29 years. The value of 29 years has been used for a couple of years having been originally eyed in and is probably not quite the best fit curve but not far off.

The standard deviations of errors with the sinusoidal curve are lower than the quadratic for both the April and December analyses. The inclusion of the annual and semi-annual signal greatly increases the standard deviation for both curves.
Figures 15 to 18 show histogram plots of errors for the two analyses.


Figures 15 and 17 show more normal distributions whereas in Figures 16 and 18 the shape of the annual and semi-annual signal makes them slightly skew.
Figures 19 and 20 shows the result of the spectral analysis for the full data.

Both show that there is a very long-term variation and in figure 20 the annual and semi-annual signal appears as a spike at a period of 1 year. On this plot it appears very small compared with other peaks due to Solar and Lunar cycles but is better judged on the residual spectral analysis shown in figure 22 below.
Figures 21 and 22 shows the result of the spectral analysis for the residuals in the NASA analysis.

Figures 23 and 24 plot the “acceleration” values against the date they were determined based on the data from the start of 1993 up to that date. The effect of El Niños and the annual and semi-annual signal can be seen. If the residuals had followed a sinusoidal variation based on the 29-year sinusoidal curve an equivalent set of “accelerations” could have been determined. Remember the curve labelled “sinusoidal” is NOT a sinusoidal curve but a curve of “accelerations” based on the residuals having a sinusoidal variation.

Figures 25 and 26 show the “accelerations” as at the end of Jan 2025 with the long term predicted “accelerations” up to the 2060’s calculated using quadratic curve fitting to a set of data obtained from a 29-year curve. The validity or not of the curve will be seen earlier by about 2034 when, if correct, “accelerations” will be approaching values seen in the long-term Tidal Gauges i.e. values of about 0.01 mm/year2.

No conclusions about sea levels during 2025 have been deduced. The comparisons between April 2025 and December 2025 show no major differences and so the ongoing work must turn to the changes during 2026. Figure 26 is considered the most revealing graph, now somewhat complicated by the annual and semi-annual signal, which masks the El Niño variations, but assuming no more complications with data presentation by NASA there should be a steady drop in “accelerations” throughout 2026.
If any readers have stayed the course, I wish them all the best for 2026 and hopefully I’ll be reporting on 2026 in twelve months’ time .
# # # # #
It is important to look back as to why I am pursuing these sea level analyses. The reasons come out of papers emanating from the University of Colorado. In their 2018 paper they state
“we show that this rate is accelerating at 0.084 ± 0.025 mm/y2”
and
“If sea level continues to change at this rate and acceleration, sea-level rise by 2100 (∼65 cm) will be more than double the amount if the rate was constant at 3 mm/y.”
The first statement equates quadratic coefficient to a physical acceleration. The second extrapolates 25 years of data over the next 80 years. Quadratic curve fitting is useful over the range of the data, but extreme extrapolation is a real no go.
In 2022 they state
“The acceleration has been stable at around ∼0.08 mm/yr2 since 2017”
My figure 23 shows this is not so. When allowance is made for the 3 large El Nino/La Nina cycles a variation approaching that labelled Sinusoidal is evident.
Strangely figure 24 paints a different picture somewhat but is complicated by the annual variations now retained in the data. But the data is greatly changed between the April and December releases, and it feels a bit like smoke and mirrors are being introduced.
Looking at figure 10, and in particular over the last 3 years, there will be a large drop in the sea levels over the next 9 months or so which will, I predict, have a major effect on the “accelerations”,
That’s a big “if”. I see in such “science” a lot of ifs, and, and maybes- along with numerous use of “could”. It’s not rocket science that can land a rover on an asteroid.
Andy – perhaps you can provide a link to a study of tide gauge studies through 2022 or 2023. the most recent I have found is church white from 2011. The absence of any over the last 14 years doesnt give me the warm fuzzies.
Story Tip
The Censorship Network in Germany
Over the past several years, investigative reporting has revealed a range of coordinated efforts to suppress online speech in Western countries. Often referred toas the Censorship-Industrial Complex, these networks of information suppression (mostly operating under the guise of “countering-disinformation” or “hate speech”) have been particularly widespread in the United States, United Kingdom and the European Union. Within the EU, Germany plays an outsized role in this complex, with a plethora of government and private nodes engaged in monitoring online speech and advocating increasing levels of content suppression.
I guess they’re happy they’ve succeeded in suppressing the mass media- now they’ll go after online speech. They’ll probably use AI to find what they’re looking for.
I guess they’re happy they’ve succeeded in suppressing the mass media- now they’ll go after
onlineall speech.I had a “free speech” issue years ago. Here in MA, the state’s Chief Forester said some extraordinarily ignorant things about forestry in a Congressional hearing, representing the National Assoc. of State Foresters. I had just put up a forestry web site (late ’90s). I wrote a very sarcastic, satirical piece about his ignorant testimony. So, what did he do? He tried to remove my forester license. I got my lawyer involved and the ACLU, which wrote a letter to the state saying they had better back off quick or else. And they did back off!
I’m glad they backed off.
You are one of the people on this forum that I would love to have beer with. You sound like someone I respected greatly in the past (now gone to the hereafter), also a forestry expert.
He told me this story: He and a friend were looking out over a field, bordered by well-managed trees and a river. The friend said “Well, looks like you and God did some beautiful work here.” He answered, “Well, it’s all nice now, you should have seen what it looked like when God had it to himself.”
Folks like you do good work.
If you were looking for examples of state overreach and the removal of information/rights that could be used to challenge government policy, then Germany is years behind our Labour Government practices here in the UK.
Here we lock people up literally for years for making what are deemed nasty Twitter/X comments about current affairs. During a recent horrendous terrorist act the judiciary were operating all night to ensure angry twitters were taken of to jail. Lucy Connolly being the most well known.
Not content with that level of overreach/control our current Labour government have already cancelled local elections across the whole country and are about to cancel the rights of another 4 million voters who wanted to vote in May local elections this year.
The Ministry of Truth is alive and well here in Orwellian Britain. Elections are being cancelled under the excuse it is for efficiency of council operations….? They can’t run an election and run a council at the same time, apparently.
This is the latest crazy situation our left loaded government have decided to adopt.
https://www.telegraph.co.uk/news/2026/01/14/lucy-connolly-warned-recall-prison-social-media-use/?recomm_id=f3c6613b-80b1-4595-b911-ad63c3535c01
I thought my paper was about Sea Level rises and am sad that political items worm their way in. Without wishing to involve myself may I just point out that Lucy Connolly was convicted of posting on X
“Mass deportation now, set fire to all the fucking hotels full of the bastards for all I care, while you’re at it take the treacherous government and politicians with them. I feel physically sick knowing what these families will now have to endure. If that makes me racist so be it.”
Now back to Sea Levels.
Sorry Alan, my bad. The situation in UK is so dire I am afraid the increasing rate of sea level around our coasts, does not ever get into the everyday list of things to be anxious about.
On the subject of whether the sea level is rising more quickly than it was 150 years ago? Well that is in the sae range of concerns as whether the firm contracted to paint the Forth bridge chose the correct colour for the job. Someone somewhere is bothered but…..
Having said that, I applaud the detail of your work and the ongoing effort you are making to establish facts. Without people as dedicated to their subject as you the NOAA/NASA and other supposedly science based institutions would be content to just make things up.
Satellite altimetry measurements of sea-level are remarkably malleable.
The widely-hyped 2018 paper which you referred to was by U. Colorado’s Dr. Steve Nerem et al. They reported finding “acceleration” in the satellite altimetry measurement record of sea-level, but they did it by reducing the rate of measured sea-level rise in 20 year-old Topex-Poseidon data, thereby making more recent measurements appear to have accelerated, by comparison. H/t Steve Case for this graph:
Here’s a heavily-cited 2014 paper:
Cazenave, et al. (2014). The rate of sea-level rise. Nature Clim Change 4, 358–361. https://doi.org/10.1038/nclimate2159
They sought to explain away an apparent declining trend (deceleration) in the rate of sea-level rise measured by satellite altimetry. They managed to massage the data until that embarrassing decline had almost entirely disappeared.
Here’s a pair of graphs from the paper, with “before” and “after” versions, showing how they “corrected” the work of five (5) different satellite altimetry analysis groups, to almost completely eliminate the decline which all five groups had reported. (Does that remind you of anything?)
In a 2017 paper they finished the process. With additional adjustments to old data, and a few more years of new data, the same group finally managed to find the elusive acceleration:
H. B. Dieng, A. Cazenave, et al. (2017). New estimate of the current rate of sea level rise from a sea level budget approach. Geophys. Res. Lett. 44(8), 3744-3751. https://doi.org/10.1002/2017GL073308
Here’s a graph from the paper, triumphantly showing the long-sought acceleration:
“If you torture the data enough, nature will always confess.”
– Ronald H. Coase
Meanwhile, most of the best coastal measurements (from tide gauges) still show little or no acceleration. As you mentioned, “Sea level acceleration from extended tide gauge data converges on 0.01 mm/year².” (Hogarth 2014) That much acceleration, were it to continue for 150 years, would add a total of just 4.4 inches to average coastal sea-level.
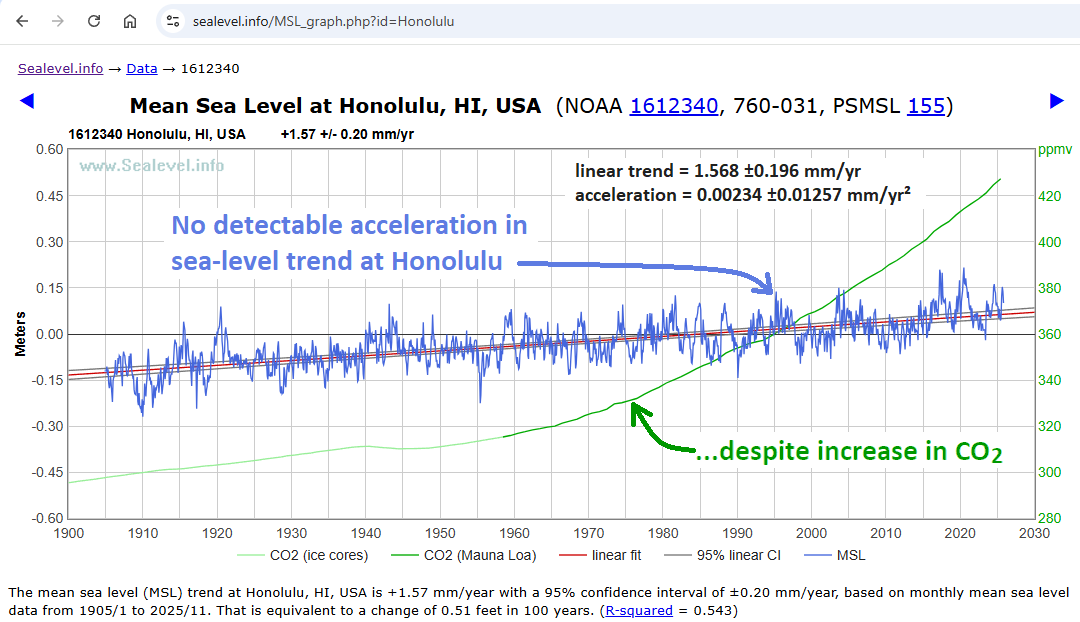
For instance, Honolulu has a wonderful 120 year continuous measurement record, from a nearly ideal location:
https://sealevel.info/MSL_graph.php?id=Honolulu
Thanks Dave for your detailed comment.
In my work I have always differentiated between acceleration – a physical measure- and “acceleration” – 2 times the quadratic coefficient and so NOT a physical measure. In one of my papers last year I showed that a range of long period (1000ish years) curves were just a good a fit as a quadratic to Tidal Gauge Data and possibly more believable.
In December, I took a dive boat and separately a private charter out of the harbor a mile away next to Ala Moana Park. I was going to look for the station but I forgot to do so.
Anyway, gangways are sloping well down for most boats there. They might need to raise the dock a little in 4 or 5 hundred years.
The widely-hyped 2018 paper which you referred to was by U. Colorado’s Dr. Steve Nerem et al. They reported finding “acceleration” in the satellite altimetry measurement record of sea-level, but they did it by reducing the rate of measured sea-level rise in 20 year-old Topex-Poseidon data, thereby making more recent measurements appear to have accelerated, by comparison. H/t Steve Case for this graph:
That was my recollection – The original satellite SLR data showed a 1.0mm to 1.2mm greater SLR than the tide gauges( 2.4mm vs 3.4mm for the 1993-2003 years) Circa 2011, those earlier satellite SLR data were revised downward to match the tide gauge data. The changes always seemed suspect to me.
As previously noted, I havent seen any studies on SLR using just the tide gauges since the 2011 Church White study.
I can’t say I have “stayed the course” but I get the impression that sea level is not rising, or expected to rise, as fast in 2026 as it has in some past years. Many years ago, on WUWT and a couple of other sites, I used the phrase “The easy ice has already been melted.”. I’ve seen meltwater running off several glaciers (5,000 and 7,000 feet elevations; latitudes 46.9°, 47.5°, & 52.2° ). {Right. No big deal.} But my limited excursions tell me high elevations are still mostly cold.
My point is – – if not faster land-ice melting, how will (or could) “acceleration” increase?
Changing the size of the tub (continental drift) may alter increases and acceleration of increases as well as more water and warmer (or cooler) water. Do we know whether or not the size of the tub is changing?
It must be, but far too slowly to matter at all for this sort of analysis.
So what is the change in ocean volume in terms of % of the total to result in a sea level rise of 1.5 mm. Tiny or not tiney? If I did it right, which is always questionable, it amounts to about 0.0004% of the average ocean depth. Doesn’t seem like much. Lava from volcanoes including the Atlantic mid-ocean ridge, the Pacific rim, island volcanoes? Sediment flow? Hmm. The question needs a proper look perhaps?
Yes, Denis.
I have been questioning why tub changes are largely ignored, for a decade now.
Geoff S
The cure for worrying about rising sea levels is to move to places where the land is rising faster than the ocean.
Of course, then you have new worries about major earthquakes ruining your day.
But if you stop and think about it, large asteroid impacts can occur anywhere at anytime.
So I guess everyone has to worry all the time no matter where they live.
It’s all the same fear after all. Be sure to get yours soon.
Believe is religion.
Think is opinion.
Know is science.
What is “judge” if not subjective?
Why not just use physical gauges at locations scatted about the globe? Ya know, actual science instead of computer model bullshit?
Go to PSMSL.org,a British site showing tide gauge data for thousands (I think) of coastal sites around the world. Go to “The Battery” at the tip of Manhattan and click on “Plots” to see a tide gauge measurement of relative sea level at that location since before Abraham Lincoln was President. Click on “Other Information” to see the GPS elevation data for that site. Go to Manila, The Phillipines to see data showing a sudden increase in sea level beginning around 1960. Don’t buy a house near the water there! GPS is of course new so it doesn’t go back to Lincoln. Those who have studied such data conclude that overall sea level as measured by sea level gauges and corrected for land elevation changes has been rising at a rate about half that of NOAA’s satellite measurements. I have not seen an explanation of why this is so.
The explanation is contained in a guest post here some years ago—‘Jason 3–fit for purpose?’. Short answer, no.
Don’t tell me, tell the fake ass, tax dollar stealing “climate scientists”.
I would not rule out the obvious one: The same as all other data sets, they altered it. The numbers are fudged, made up, fake.
Look at photos of various specific places, long ago and now.
I have never seen a single location with old photos, where any visually detectable change has occurred.
Sounds crazy, I know.
But I have long been a beach hound, since childhood in NJ.
As far as I can see, the ocean has not moved, at all.
Not exactly scientific, but it is true.
The warmistas lie about everything, all the time.
Every word they say is close to the opposite of what is true, not just wrong.
And we know that way back when, they were already concerning themselves with coordinating data sets to all be in agreement.
The tide gage data is not raw data, it is highly modeled.
Adjusted to remove seasonal variations, wind, pressure, etc.
IOW, altered.
Are we do trust in their honesty?
Prior to the era of global warming alarmism, sea level graphs did not go steadily in the upward direction.
There were decades of rapid increases (relatively speaking), and decades where it just bounced around in a range, and even some periods when it fell.
And those periods lined up exactly with the temperature records available at that time.
When it warmed for several decades, sea level rose, when it got colder, sea level fell.
And these patterns were visible on the sea ice charts, and matched up with what various sources said who were explorers, researchers, etc.
Now, none of it makes sense.
Periods that media and researchers gave graphic and detailed accounts of Arctic ice increasing, are shown as warm, and periods of decreasing sea ice in those accounts, are shown on todays graphs as the coldest period in the record.
So what do we believe?
The info published before alarmism was a business model, and various data sets from multiple independent sources was all in remarkable agreement, IOW, it made sense, or the gaslighting bullshit from people who alter every data set, are on record discussing their collusion to falsify the data, change everything with no explanation or very lame and nonsensical ones, and graphs that no longer make any sense when compared to the known activity of glaciers, sea ice, every textbook, researcher, and media account?
From people that tell us there was never any global cooling scare?
Who fire and refuse to publish anyone who goes against the preordained narrative?
We all know what the story is.
Why should we think they kept some data sacrosanct?
1) There are not that many “physical (tide) gauges” that can measure SLR in the deepest waters of all of the world’s oceans.
2) For those tide gauges located along shorelines, there is the problem of accurately correcting each one for local land subsidence and uplift, and as such varies over time. The is the major reason that land-based tide gauges don’t substantially agree with each other as regards “global” SLR magnitude and global SLR rise rates.
The position of the moon affects the sea level. It is on the order of feet per cycle. The result is seen by coastal tide gauges and is likely what is seen in part by the NOAA satellites. The moon’s distance from the earth varies by about 10% from apogee to perigee. Is the variation in at-sea NOAA measurements corrected for position of the moon? I suppose so, but don’t know. As you say, the issue is correction for land elevation changes from elevation or sinking of the tide gauge itself. The tide gauge at The Battery is located on bedrock which is moving down at about 1/2 the rate of steady rise of sea level as measured by the tide gauge for the past ~170 years or so. See PSMSL.org for this info. For some reason NOAA’s tide gauge site does not include GPS info. The GPS elevation gauge at The Battery has only been operating for ~15 years but it to is on bedrock. It seems safe to say that the sinking rate has not changed since the gauge was installed (geology is usually a slow business) which is about 1.5 mm/year when subtracting the sinking rate. The tide gauge at Philadelphia is also on bedrock and has been recording for the past 125 years. When corrected for land sinking as revealed by a GPS gauge at the same location, the result is the same as at The Battery, around 1.5 mm/year. In sum, tide gauges can be used to correct for true sea level changes when the appropriate data are used. Sometimes geology is not a slow business. See the Manila gauge for an example (The Philippines are a very active geologic area as you will see.)
So, long story short, actual science is time consuming and requires actual, physical work. So sticking with computer model bullshit. Got it.
And why are there “not that many” gauges? They are cheap, easily installed and accurate.
Think about it: how is a “tide gauge” located over a water depth of more than 1000 m— considering the average depth of the world’s oceans is around 3,700 meters—going to be anchored to a solid land reference (that is, a reference geological location that changes only minimally in vertical position as a result of daily tidal forces compared to ocean level tide as well and long term vertical movements)?
Easily installed? . . . I think not.
The stupid, it consumes you. Sea level “rise” is only an issue where people live, ya know, the coast line. Since it is not a problem to begin with your screeching&caterwauling is nothing but comical.
It is quite apparent that you fail to see the contradiction between your first sentence and the beginning of the second sentence in the above extract from your post.
Also, about 10% of the global population (more than 750 million people) live within 5 kilometers (3.1 miles) of a coast line.
(source: https://www.preventionweb.net/news/15-global-population-lives-within-few-miles-coast-and-number-growing-rapidly )
Now given this, it would be appropriate for you to carefully examine your reference to “stupid”.
All that blahblah and still no proof sea level rise is a problem, much less a civilization ending crisis. So yes, stupid definitely applies to you.
Careful . . . you are beginning to sound like a relative (twin?) of Michael Flynn.
And still no proof. Thought so.
I would like to see a good study of sea level rise using tide gauges. The last one I saw was Church White from 2011.
when the first satellite measures came out in 1993, the SLR was about 3.2mm per year while tide gauge slr was about 2.3mm ish. That gap persisted for 10-12 years, then the SLR for the satellites were adjusted downward to match. A dubious adjustment.
Unfortunately I cant find any subsequent tide gauge studies much less any studies that reconcile the differences.
From the above article:
“An 8-order polynomial curve was fitted to the graph in figure 3 using the LINEST Function in Excel, resulting in
. . . Equation 1
The order and accuracy may look excessive, but a 6-order was found to be too inaccurate at the extreme ends of the graph and . . . it was decided to stay with this equation.”
IMHO, once one decides an 8-order polynomial is needed to fit a curve to a time-series of physical measurements (i.e., data), he/she have abandoned all attempts to explain the physical basis of that data and instead have embarked on a purely mathematical exercise.
This is quite sad to see.
My reason for what seems an absurd equation was to use that curve to remove the annual variations from the only NASA data I had to work on. It showed a remarkable fit but no physical interpretation was intended but just a tool to adjust the data but sadly that came to nothing hence the need to live with the “bumpy” curves.
As von Neumann said “With four parameters I can fit an elephant, and with five I can make him wiggle his trunk.”
Alan, I think a harmonic model might work better as the seasonal signal. As your link for the NASA data returned a 404 error, I built a model using the Colorado data. It’s a sum of a fundamental, 2nd and 3rd harmonics. It’s certainly easier to apply.
The third harmonic is small, and not really needed (nor are so many digits of precision).
I did apply a 3-sample moving average to the deseasonalized data (red).
The model was created by first applying a 2nd-order detrend to the MSL data and then computing the Fourier coefficients for the three cycles. A dft was used instead of an FFT as the sample data is not linearly spaced.
Thanks for that Robert. I probably went for over kill and may have had a slightly, but not much, better fit. I work on the principle best to have too much precision and not want it than not enough and need it.
John von Neumann as quoted by Enrico Fermi, once said:
“With four parameters I can fit an elephant, and with five I can make him wiggle his trunk”. I suspect that with 6, I’m quite sure he could fly.
“Show me the dataset, and I will show you the rise.”
No thank you.
Nice Lavrentiy Beria reference!
The long term average given in this post, 3.3mm/year, MUST be about right. The late Nils Axel Moerner estimated 3.2 using dGPS vertical land motion corrected long record tide gauges—and even his value varied a bit with the definition of ‘long range’ as either more than 60 or more than 70 years.
The reason that narrow value range MUST be ‘right’ is closure. Closure is when the SLR estimate agrees with the sum of thermosteric rise and ice sheet loss estimates (all possible else being negligible). Since ARGO, we know thermosteric rise with considerable precision. Ice sheet loss is less certain given satellite based gravimetric and altimetric methodological uncertainties. Depending on which of those Antarctic ice sheet loss estimates are used (Greenland being more certain), closure is either 3.2 or 3.3mm/year.
Covered in much more detail with many references in essay ‘SLR, acceleration, and closure’ in ebook Blowing Smoke.
I’m sure this is good information but I have a hard time following it. It appears NOAA’s and Colorado’s sea rise accelerations are skewed. There is mention that there should be a drop in acceleration of sea level rise in 2026. I don’t remember reading about sea level rise acceleration decreasing before, is that normal? What causes the changes?
I’ve lived with this topic for the last 8 years and this was meant to be a review of 2026, following on from previous reviews. It may not explain everything in detail so may I recap on how I see it. Any references are to figures in this paper.
In figures such as 5 and 6 any deviation, whatever its form, from the linear best fit is small. This applies equally to figures 9 and 10. But if the residuals shown in figures 11 to 14, defined as the differences between the actual reading and the value for that date on the linear line, are plotted the deviations from a straight line are greatly magnified. Note the quadratic coefficient for the x2 term do not change between the full data and the residual data.
In Nerem et al’s work they double this quadratic value and call it acceleration. Prior to 2012 the value of this value was erratic but then tended to settle down. In 2018 they showed it reaching a peak of about 0.1mm/year2. By 2022 they quoted it as being level at about 0.08 mm/year2. Latest releases of plots from the University of Colorado for 2025 quote about 0.07 mm/year2 as can be seen in figures 5 and 6. But never have I seen any reference from them of the value reducing.
The process of fitting a quadratic curve is nothing to do about acceleration but just a curve fitting exercise. That’s why I call it “acceleration” in my work.
Figures 13 and 14 show an alternative sinusoidal curve that statistically is a better fit. If the sea levels followed this sinusoidal path the process of calculating “accelerations” can be applied and results in the curve, labelled “sinusoidal” in figures 23 to 26. This curve shows a similar increase from 2012 to 2020 at which it peaks at about 0.087 mm/year2 then begins a decline followed by reducing minimums and maximums approaching zero like a under-damped sinusoidal variation (try googling “under-damped oscillation).
What makes me think that 2026 will show a more marked trend in this decline in “acceleration”. It is the form of the last 3 peaks in data (figure 10) and that the levels will be dropping for most of the year from a combination of a El Nino/La Nina cycle and the annual and semi-annual signal.
Unfortunately, time moves so slowly as the song goes so, we all have to wait and see.
Next update Jan 2027 so feet up, put the coffee on and just wait patiently.
first line should have read 2025 not 2026
Sea levels have obviously varied by at least 10,000 meters in the past.
Why the fuss about 0.2 m in a century (even if it were true, which it’s not)?
do you have a reference for “10,000 meters in the past”?
Alan, of course.
Do you doubt me?
It’s not about doubt but sharing information. I have no references to a 10000 metres rise in the past and would like to read your reference(s) to educate myself. Thank you.
Alan, once you’ve educated yourself, feel free to tell me why you believe I’m wrong.
I know it’s extremely unlikely, but knock yourself out.
1 I have not said you are wrong
2 You have not provided any reference for me to read to make any comments
3 Please reply with information or we could go on til my review paper of the 2026 sea levels is published in Jan 2027
4 If not I wish you all the best for 2026
If you believe what I said, you don’t need anything else, do you? If you believe that I’m not wrong, and not right, at the same time, that’s your choice.
I suppose you have reasons for your opinion. have presented facts to support my statement previously, on this blog. I presume there is some sort of search facility available, but I have never used it, so I can’t teach you.
On the question of sea levels generally, anybody who claims to be able to measure the Earth’s “average sea level” at any point in time is delusional. Sea level measurements, even if accurate, would have no utility whatsoever, unless someone was silly enough to believe that they could predict the future by examining the past.
Marine fossils, including ammonites, brachiopods, crinoids, and trilobites, are found at the summit of Mount Everest and throughout the Himalayas at altitudes exceeding 8,000 meters. Most oil deposits are formed from the remains of prehistoric marine life, primarily microscopic organisms like plankton, algae, and bacteria that lived in ancient oceans millions of years ago, and are found at depths of over 5000 meters, having originally lived in the photic zone close to the surface.
But of course, you knew all this, didn’t you?
So no, I’m not going to provide any “references”.
Sea levels go up and down, as does the Earths crust. Magma from the interior penetrates the crust, forms solid rock, and the Earth shrinks as a result.
How you choose to spend your time is your affair. I suppose the ignorant and gullible might think your “work” has some value.
I wish you all the best for 2026.