Kevin Kilty
Part I of this series focussed on the sources of data substantiating an energy imbalance, the magnitude of said energy imbalance, and the likely uncertainty of this magnitude. Measurements suggest this magnitude is most likely around 0.76W/m2 but the uncertainty is optimistically stated as being as small as 0.1. Even the authors of scientific reports admit their uncertainty does not include all factors, especially instrumentation and processing biases. Most (89%) of this energy imbalance ends up warming the oceans.
Part II examines climate feedback, its potential magnitude, and likely uncertainty. Part III, when I get around to it, will focus on whether or not the Earth possesses a regulator; that is, whether there is some physical process that will limit response to such an imbalance continuing on into the future. In particular, Part III will explore the curious status of Le Chatelier’s principle, which people often invoke lately to suggest there must be such a regulating mechanism.
The Standard View
It’s best to start with the standard argument for why increasing CO2 will raise surface temperature. Then critique this argument. Figure 1 is from a review article by Held and Soden (hereafter H&S), from 2000[1] but which was largely repeated in 2006.[2] I can do no better to explain than to just paraphrase H&S themselves. Their review article, I think, explains the standard view as clearly, and simply as anything I have read.
To maintain an energy balance, the Earth must radiate back to space the 240 W/m2 portion of absorbed solar radiation it receives. To balance this a black body radiator would have to have a temperature of 255 K (240 = σ Te4) which we will call Te the emission temperature. This temperature occurs at a height above the surface which we call Ze. As pictured in Figure 1, one might think of the average infrared photon escaping to space from near this level.

As H&S say “It is an oversimplification to assume that temperature gradients within the troposphere do not change as the climate warms, but this simple assumption has proven to be a very useful point of reference…”
With a fixed Te and fixed gradient (Lapse rate Γ) surface temperature then becomes; Ts = Te + ΓZe. In this simple model only changes in Ze matter. Now the argument takes the following path.
An increased concentration of CO2 in the atmosphere makes the atmosphere more opaque to outgoing infrared radiation from the surface. Thus, to have a CO2-doubled atmosphere equally transparent above Ze to enable escape of the average photon, Ze must reside higher in the atmosphere. A doubling of CO2 makes the more opaque atmosphere equally transparent above at Ze+150m. However, the invariant gradient of 6.5K/km means the temperature at Ze+150m is lower by about 1K, and according to the Stefan-Boltzmann law this amounts to a reduction in outgoing radiation by about 4W/m2(236.3 = σ 2544). There is an energy imbalance that warms the entire atmosphere and surface.
Water Vapor Concentration
The effects do not stop at this point. The entire atmosphere is now 1K warmer, and at the Earth’s surface this higher temperature, according to the Clausius-Clapeyron relationship, will lead to an increase in water vapor pressure at saturation of about 7%. This, in turn, makes the atmosphere more opaque still, and raises Ze again. The process repeats, but converges to a new equilibrium at surface temperature enhancement of 1/(1-βH2O), where βH2O=0.4 is the feedback factor for water vapor. As H&S say in their 2006 paper, “ a number of important aspects of the hydrological response to warming are a direct consequence of the increase in lower-tropospheric water vapor.”
My Critique
Recognizing that H&S admitted this model is an oversimplification, let’s nonetheless critique its main elements in order of their appearance.
There is no emission surface at 255K
First, people appear to literally believe in an emission surface in the middle troposphere with a temperature of 255K that radiates as a black body. In other words, they view the problem as akin to a typical boundary value problem with the surface acting as one boundary and some imagined layer above acting as the other. While the surface does behave as a near black body (emissivity=0.97), the clear atmosphere is nowhere so emissive that a thin layer will act as a black body. As H&S, themselves, say in a different publication[3], “…Owing to its much
larger emissivity, the surface contribution is an order of magnitude larger than that from any individual 100-mb atmospheric layer.” What happens instead is that the compensating outgoing LWIR escapes over a broad vertical region of the atmosphere that begins right at the surface for some wavelengths.[4] The upper boundary of this problem is complex.
Instead of a single degree of freedom, Ze, establishing surface temperature, there are many different configurations that will do the task. The emission surface has a complicated, and ever changing, configuration. While the idea of an increase in height of the emission surface is one possible response, an atmosphere dehumidfied from above, which is what precipitation accomplishes, could place the average emission surface lower into the atmosphere without changing the surface temperature much if at all.[5]
Radiative-convective equilibrium doctrine
Second, the unvarying 6.5K/km gradient value of radiative-convective equilibrium is not helpful. Anyone who has examined temperature profiles knows that they are hugely more complex than just a constant gradient. Figure 2 shows a number of model atmospheric temperature profiles drawn from MODTRAN. Note that the only constant 6.5 lapse rate in the set is the U.S. Standard 1976 Atmosphere – a made-up profile of atmospheric non-structure designed by committee.[6] The other examples actually have some structure to them which tell us something about the dynamics of heat transfer in various locales.

Figure 2.
Evaporation
Water vapor assumes primacy in this simplified model, especially in the tropics. Invoking the Clausius-Clapeyron (hereafter CC) relationship means that each 1K rise in surface temperature adds 7% more water vapor into the lower troposphere – it’s a geometrical increase of the most powerful greenhouse gas.
To promote CC scaling, H&S rest their analysis on an atmospheric dynamics relationship for the evaporation process.[7] I have argued in a few instances here and elsewhere that this CC scaling is wrong by reason that the distribution of water vapor throughout the atmosphere is non-equilibrium and dependent on transport processes. It is energy constrained; whereas atmospheric dynamics models of evaporation simply assume the energy constraint vanishes.[8]
Engineering hydrology concerns itself with evaporation from surface storage.[9] Of the expressions for evaporation which they have developed from this focus, some are atmospheric dynamics based; others are energy balance based; others are a combination of the two.[10] Atmospheric dynamics based expressions work well enough, but must have a scale-size issue because they don’t consider energy balance. Without energy balance the process is unphysical.
As Landsay, et al, say in regard to energy used for evaporation.
“In Deep lakes with capacity for considerable heat storage, sudden changes in wind and humidity have longer lasting effects; heat into or from storage assists in balancing energy demands. Thus by using stored excess energy excessive evaporation during a dry, windy week can reduce evaporation which would otherwise occur in subsequent weeks.”[10]
Energy balance provides a constraint. I think atmospheric dynamics is a weak argument. Evaporation (depth of open water evaporated per unit time) based on an energy balance would look something like this:
E=(Qn+Qv-Q0)/(ρHv(1+R) ); where,
R is Bowen’s ratio, Qn=net all wave radiation, Q0 is energy going into storage, Qv=energy advected, and Hv is latent heat of vaporization.
Ignoring observations in favor of theory
Regarding the feedback enhancement from water vapor, H&S, say this:
“…There is no simple physical argument of which we are aware from which one could have concluded beforehand that βH2O was less than unity. The value of βH2O does, in fact, increase as the climate warms if the relative humidity is fixed. On this basis, one might expect runaway conditions to develop eventually if the climate warms sufficiently.”
One might respond this way. There is no simple physical argument except that the precursor to water vapor, liquid water, has covered a majority of the surface of Earth for 4 billion years, under widely varying conditions, including enhanced CO2, and we have not observed anything remotely like a runaway greenhouse effect. In fact, we more commonly observed excursions into exceptional cold.
Climate modellers seem more impressed with agreement among their models than they seem to be with observations. I am not a climate modeller, but I am not impressed with proof of correctness through consistency among models. I have some experience modeling heat transport. I have translated complex codes for all sorts of purposes from one programming language to another, and debugged the results. It was common enough for me to find the same mistakes in different platforms to suggest common ancestry of codes; sometimes agreement is just lack of independence.
Closing the water vapor controversy
Fourth, as H&S say, closing the water-vapor controversy requires comparison with data.
“Given the acceleration of the trends predicted by many models, we believe that an additional 10 years may be adequate, and 20 years will very likely be sufficient, for the combined satellite and radiosonde network to convincingly confirm or refute the predictions of increasing vapor in the free troposphere and its effects on global warming.”
How well do we know the underlying physics?
Bob Irvine wrote about feedback two years ago. He showed data similar to, but independent of that in Figure 3. Figure 3 shows Era5 reanalysis from the tropics plotting 2m temperature and dew point data against one another. There is a rise in dew point temperatures, specific humidity or mixing ratio, as one prefers, all show a modest rise in absolute humidity of about 3% over the past two decades. The observed rise does not support CC scaling and certainly not a constant relative humidity.

Figure 3.
Irvine’s essay provided a Table comparing AR4 to AR6 feedback values. Of particular interest are the large changes in the combined feedback values for water vapor+lapse rate. In AR4 (2007) this value is 0.96 ± 0.08 W/Km2. In AR6 (2019) it is stated as 1.30 (1.15 to 1.47). Perhaps noting that water vapor has not kept pace with CC scaling in the two decades from 2000 to 2019 caused the revision. Of greater interest is the stated uncertainty.
Consider AR4 uncertainty of 0.08 as pertaining to a coverage factor of 1.0, and the interval for AR6 as the 90% confidence interval. This places central values four standard deviations apart, meaning that each estimate is highly unlikely in view of the other. In addition, a graphic in reference [3] shows the water vapor and lapse rate feedback values separately. As was often noted in Part I with regard to energy imbalance, the uncertainty of combined quantities becomes smaller than uncertainty of its components. How does this happen? Possibly model biases in estimates of water vapor feedback are anticorrelated with biases in lapse rate feedback.
Cloud Feedback
Everyone recognizes that clouds are a weakness of global climate models. Everyone may not recognize the tremendous variability of clouds day-to-day. Figure 4 below shows what total downward welling solar radiation looks like on two closely spaced days along the Colorado front range. The raw data is by UTC day, so these plots are patched together. Yet what they show is patently clear. The partially cloudy day has enhanced downward radiation when cumulus or cumulonimbus north and northwest of the observatory redirect scattered light toward the observatory, but more often reduced radiation to winter-time subarctic conditions when they shade the observatory. The change in daily received solar (downwelling total solar) is from 34,000kJ/m2 on the clear day, to 23,000kJ/m2 on the other. That’s huge by anyone’s estimation. Even the surface albedo (ratio of blue curve to red) changes from 18.8% to 19.3% simply because of the redirection of sunlight.

Figure 4.
Figure 5 is from data taken just north of Laramie, Wyoming, at an elevation of 2200m on a clear summer day. There is no SURFRAD site here, but I own numerous radiometers and was testing/calibrating one. By pure serendipity, I caught the sheerest of clouds – Subvisual cirrus so insubstantial that I could not see them by eye. However, the radiometer detected them, and occasionally when the cirrus formed a wisp that could be discerned by eye which passed in front of the Sun, I could correlate it with the radiometer.
Lynch [12] suggests these clouds have an optical depth near τ=0.03, which would translate into a power density variation in the neighborhood of 1000e-0.03=970 or decline of 30 W/m2. Just about what Figure 5 shows. Thus, even in this instance of the least substantial clouds one could imagine, the effect is ten times as large as that of a degree K change in surface temperature.
Clouds present a large climate forcing.

Figure 5
Nevertheless, this climate forcing is not what “feedback” means in the context of climate science. Feedback is the effect a warmer surface has on the radiative difference between clear sky and total sky. It is the change in cloud forcing (clear sky less total sky), and complicating the matter is that clear sky is a calculation from theory again. AR4 lists the feedback effect of clouds as 0.69 ± 0.38 W/K-m2; AR6 lists 0.42 (-0.1 to 0.94).
Exploring Feedback
Models result generally in positive feedback. I have no basis for arguing with that. What I disbelieve is that a relatively tiny differential quantity, calculated as the difference between two other large variable quantities which are, themselves, differences of large variable quantities, aren’t swamped by uncertainty. This is especially so given the lack of resolution in climate models, plus the parameterizations of things like clouds, convection and precipitation that aren’t calculated directly from physics.
I am not an opponent of climate modeling, but I do wish the results of modeling could be grounded by comparison with observations. I fully recognize that observations can be so encumbered with problems of calibration and data reduction schemes that what results has large uncertainty also. Nonetheless, I want to see a comparison now and then. So, what do we do about feedback?
Let’s consider feedback calculation schemes. They’re done with models. The challenge with doing the same things with observations is having long enough runs of days to approximate climate. Can any schemes be mimicked with observations? Soden et al, outline schemes based on modeling.[3] How would they translate to observations?
Scheme 1: Think of the net energy imbalance at the top of the atmosphere (TOA) as a function of just a few items. Figuratively call this R( w, T, a, c); where w stands for water vapor, T for surface temperature, a for surface albedo, and c for clouds. Run multiple models changing only one item, c for example, at a time and compare to the unperturbed state. This is very difficult to do with observations because it is difficult to search for and find extended runs of days that are identical in all respects except for one item.
Scheme 2: Separate feedback into two factors. The first, the “radiative kernel,” depends only on the radiative algorithm and the other is simply the change in the climatology of the feedback of interest of two comparator states. The product of the two is the feedback. This method is not pertinent to observation. Yet, radiative kernels are interesting for a different reason in Part III.
Scheme 3: Perturb the climate model with a step change in sea surface temperature. Then infer the climate sensitivity from resulting computed changes in radiative fluxes.
The scheme most amenable to observations is scheme 3. The sea surface perturbations available naturally are ENSO, PDO, AMO, and so forth. In addition, we might think about organizing the effort like the factorial experiments we do in engineering; we purposely change multiple variables in each successive run because that is what the weather will do. Build a table of contrasts with four factors (w,T,a,c) and note how each changes in each successive change of PDO or ENSO. Eventually we will fill in the entire table of contrasts and have a rough idea not only of factors of feedback but also interactions among them.[13]
Conclusion
Just as in Part I, in Part II I find numbers applied to fundamental concepts that are small but with uncertainty estimates I cannot reconcile nor find entirely credible. The entire topic of climate change appears to be like this; guided by numbers and measurements that need to be certain within 0.1% but are often 10 or 100 times worse. Is the cloud feedback positive? I don’t know. There is a lot of weather to sort through to find out. However, if it is positive that is not necessarily a bad thing as explained in Part III.
References and Notes
1-Held, I. M., and B. J. Soden, 2000: Water vapor feedback and global warming. Annu. Rev. Energy Environ., 25, 441–475.
2-Isaac Held, Brian J. Soden, 2006, Robust Responses of the Hydrological Cycle to Global Warming, J. Climate, V. 19, p.5686
3-Brian J. Soden, et al, 2008, Quantifying Climate Feedbacks Using Radiative Kernels, J. Climate, V. 21, p3504
4-Even in the moist tropical atmosphere, clear sky is over 80% transmissive to many segments of the IR spectrum as wide as 2 inverse centimeters in wavenumber.
5- This is an element of Lindzen’s iris hypothesis.
6- This mean profile may be a case of an average that is never actually observed – like the 3.5 average of dice rolls. Of further interest, the band 8,9, and 10 water vapor satellite images are reduced using the U.S. standard atmosphere. Perhaps use of this model in this context could be explored in some future post.
7-An atmospheric dynamics model from H&S: “ … evaporation E from the ocean can be
modeled as proportional to the difference between the saturation vapor pressure at
the surface temperature T* and the vapor pressure in the atmosphere at some small
convenient reference height…”
8-An analogous situation occurs in electronic feedback circuits. The power supply is almost never shown explicitly in such circuits under the assumption that the power supply is capable of providing whatever the feedback circuitry demands. Clipping occurs when output reaches close to the power supply rails. This doesn’t occur in models even though it happens physically.
9-I worked as a USGS hydrologist for three years in the 1970s. Employment is a capable teacher.
10-Ray K. Lindsay, Jr., et al, 1975, Hydrology for Engineers, 2nd ed, Mcgraw-Hill
11- Lynch, Subvisual Cirrus, Aerospace Report number TR-93(3308)-1, 1994, available online at https://apps.dtic.mil/sti/tr/pdf/ADA289329.pdf
12- I had a bit of fun with generative AI. I asked if ENSO could be used as an analog of climate change. It said “no”. I then asked if El Niño could be. AI said “yes”.
13-At a conference in 2002 I suggested this as a method of making history itself, and historical sciences, look more like experimental science. No one, to my knowledge, has taken up the idea.
Converting code from one language to another??? You have my deepest sympathy…
More seriously has been the utter lack of a runaway greenhouse effect in the Earth’s history of the last billion years that makes me wonder about the most extreme warming claims. The temperature history of the last million years or so suggests some mechanism that puts a hard limit on how much temperatures can rise.
Correct. If you consider the atmosphere as a vertical column with warm base and radiating cold ice at the top, then whatever is in between has the capacity to reduce the heat input at the base to near zero but the top will always radiate at the minimum temperature of the tropopause – say 200K.
Think in terms of a tropical cyclone which allows next to no surface sunlight but still loses about 150W/m^2 at the top of the atmosphere.The cause rapid cooling of the ocean surface.
The balance point, where cyclic average solar energy at the base equals cyclic average solar energy at the top, occurs when the ocean surface is at 30C. Atmospheric ice is ther dominant player in the regulation and has a precise temperature of formation.
You only need to look at anywhere on the globe any time of the year to see this temperature regulation in action. The process has not changed since data from moored buoys has been available. More of the ocean surface in the NH is reaching 30C but that is its limit.
Look at the ocean around Australia today. Four heat vent valves going off around the continent as some of the coastline nudges above the 30C sustainable limit. This process has very slight sensitivity to the atmospheric mass but additional carbon from fossil fuels is negligible on that front.
“ allows next to no surface sunlight but still loses about 150W/m^2 at the top of the atmosphere.”
Good point that maybe isn’t so widely understood. Even though the tops of cumulonimbus, or hot towers, is very cool, they still radiate quite a bit. In comparison to radiant heat fighting its way up through a moist atmosphere from the surface on a clear day, it’s probably twice as much cooling.
And in the vicinity of the bottom of those CB’s is a pretty incredible evaporation rate that cools the surface by about 15C….
The temperature history of the last million years
This time period can be extended back to 2.5 million years, but no point going back any further. The Pleistocene Epoch (2.5 million years to 11,700 years ago) is the geological period where the earths landmasses and oceans stabilised in the positions we now recognise. The closing of the Isthmus of Panama about 3 million years ago stopped the Gulf Stream flowing into the Pacific and diverted it into the north Atlantic. The ocean currents that have since developed have had a dramatic cooling effect on our planet.
You’re being humorous, Erik. Translating among the many flavors of FORTRAN, ‘C’, assemblers, PASCAL, PL/I, ALGOL, and a few too obscure to mention… “Mohawk Data Language”! Put that in your peace pipe and smoke it.
Various variables prevent the ocean surface temperature in the tropics from rising above 30 C. That fact likely has a stabilizing impact on long term weather, which is also influenced by celestial cycles, sunspots, etc.
Ha, I await a wilpost post that doesn’t have “30” in it somewhere.
Just kidding Wil…
DMacKenzie,
Here it is.
It shows WV plays the overwhelming role, while CO2 is a bit player
Excerpt from:
CO2 Has a Very Minor Global Warming Role in the Atmosphere
https://www.windtaskforce.org/profiles/blogs/co2-has-a-very-minor-role-in-the-atmosphere
Radiation Transport in Clouds
https://scienceofclimatechange.org/wp-content/uploads/SCC-2025-vWijngaarden-Happer.pdf
By Drs. van Wijngaarden and Happer
.
The article details just how insignificant CO2 is as a factor in climate change, revealing that doubling the CO2 concentration from 400 ppm to 800 ppm – a 100% increase – hypothetically reduces radiative heat loss to space by just 1%.
It would take many decades to achieve such a ppm increase, plus there are not enough fossil fuels left over to make it happen.
Because CO2 has increased by only 50% since 1850 (280 ppm to 420 ppm), the CO2 total greenhouse effect regarding reducing upward IR radiation has thus far been in the range of tenths of a percentage point.
Such a small change in upward IR radiation, over 175 years, is not even detectable amid the noise of outgoing radiation measurement.
For example, the measured upward IR radiation has an error of about 33 W/m²
This negligible CO2 greenhouse effect is a calculated value for an atmosphere that is perpetually cloud-free.
As clouds are present 60 to 70% of the time, this clear-sky-only condition only occurs in an imaginary world – an atmosphere that doesn’t exist.
Compared to the CO2 role, the greenhouse effect of clouds is tens of times more influential.
To cool the Earth by a few percent, low cloud cover needs to increase by only a few percent.
During cloudy skies, there is warming, due to downward IR radiation from cloud bottoms at about 340 W/m^2
During clear skies, there is about 30% less warming, due to upward IR radiation at about 260 W/m^2, primarily from the thermal IR radiation of water vapor and CO2
.
If cloud cover increases from 60 to 65%, the upward IR radiation (cooling) from earth surface decreases by (0.40 – 0.35) x 260 = 13 W/m^2, and downward IR radiation (warming) from cloud bottoms increases by (0.65 – 0.60) x 340 = 17 W/m^2, for a net warming increase of about 30 W/m^2
Because cloud cover changes of much more than 1% routinely occur, such as during El Ninos, over time-scales of a few years, the role of CO2 within the greenhouse effect is insignificant, if not irrelevant.
Cloud cover changes are the only plausible explanation for most of the modest “secular” warming of the past two centuries. Together with ocean current fluctuations (see below URLs), cloud cover changes are also the only physical mechanism that could account for fluctuating temperature changes with time scales of a few years.
Based on fundamental physics, one should expect some warming from increasing CO2. But this warming will be too small to account for what has been observed.
Cloud cover changes provide the only rational explanation that does not violate basic physics.
“To maintain an energy balance, . . .”
Why must an “energy balance” be “maintained”? If a body emits as much energy as it receives, it is in a state of thermal equilibrium, and its temperature is unchanging.
On the surface of the Earth, if the Sun is the sole external energy input, the energy is “balanced” twice a day – at the maximum and minimum temperature inflection points, where “energy in” is exactly equal to”energy out”.
At any other time, the surface is either warming or cooling.
The Earth has cooled since the surface was molten, and continues to do so, being hotter than its environment. No “energy balance” to be seen.
Earlier, you state “It’s best to start with the standard argument for why increasing CO2 will raise surface temperature . . .”. The “standard argument” is complete physical nonsense. Adding CO2 to air does not change its temperature one bit. Likewise, removing CO2 from air does not result in a lower temperature. Anybody who believes otherwise is supremely gullible.
Making statements like “Most (89%) of this energy imbalance ends up warming the oceans.” is just misleading and meaningless bafflegab.
There is no incoming “energy imbalance” and the oceans are warmed from beneath.
If you disagree with me in any substantial way, I would be grateful if you could quote me, and provide some facts (backed up by reproducible experiment, if possible) to support you4 disagreement.
This whole GHE delusion would be funny if it did not cause so much unneeded worry and diversion of time and money from things that might actually benefit humanity – medical research, for example.
Can we stop using an average sun temperature and average total solar irradiance and mean orbital distance from sun to earth? Please?
What do you propose to use to replace them? The function describing the heating integrated over time?
When 1/r^2 and T^4 play in, those averages are inaccurate.
One can due the integral calculations for a 1 year orbit and come up with a more accurate solar irradiance in the earth energy system.
One can put a tolerance on the sun temperature and provide a range for the calculation.
Keep in mind, those averages result in 4 significant digits applied, which is bogus.
And when one considers the reported 0.6% energy imbalance, those details become significant.
Average temperature errors:
5C => 339.41 W/m^2 (100% emissivity)
25C => 448.07 W/m^2 (100% emissivity)
average is 15C
15C => 390.91 W/m^2 (100% emissivity)
But the average for the temperature extremes is 393.74 W/m^2.
Almost a 3 W/m^2 error, which is close to 1% of the estimated 341 W/m^2 solar irradiance.
Thank you. Now that you have explained why you said what you did, I agree with you.
You can calculate your very own estimate of the Earth’s radiative imbalance. A few years ago I made an online spreadsheet to make it easy. You can enter your best estimates for various climate parameters, and it will show you what that implies w/r/t the radiative imbalance:
https://www.sealevel.info/radiative_imbalance_calc.htm
Give it a whirl! Enter your best guesses for things like the warming to date, percentage of warming that’s from human GHG emissions, etc., and it will calculate YOUR implied estimates for common climate parameters.
Using that calculator, my best estimate for the radiative imbalance comes out to about 0.3 W/m².
BTW, I’ve been “collecting” those “ERB” (Earth’s Radiation Budget) and “EEB” (Earth’s Energy Budget) diagrams.
⋅
Here’s Kevin Trenberth’s famous 2009 version: (link)
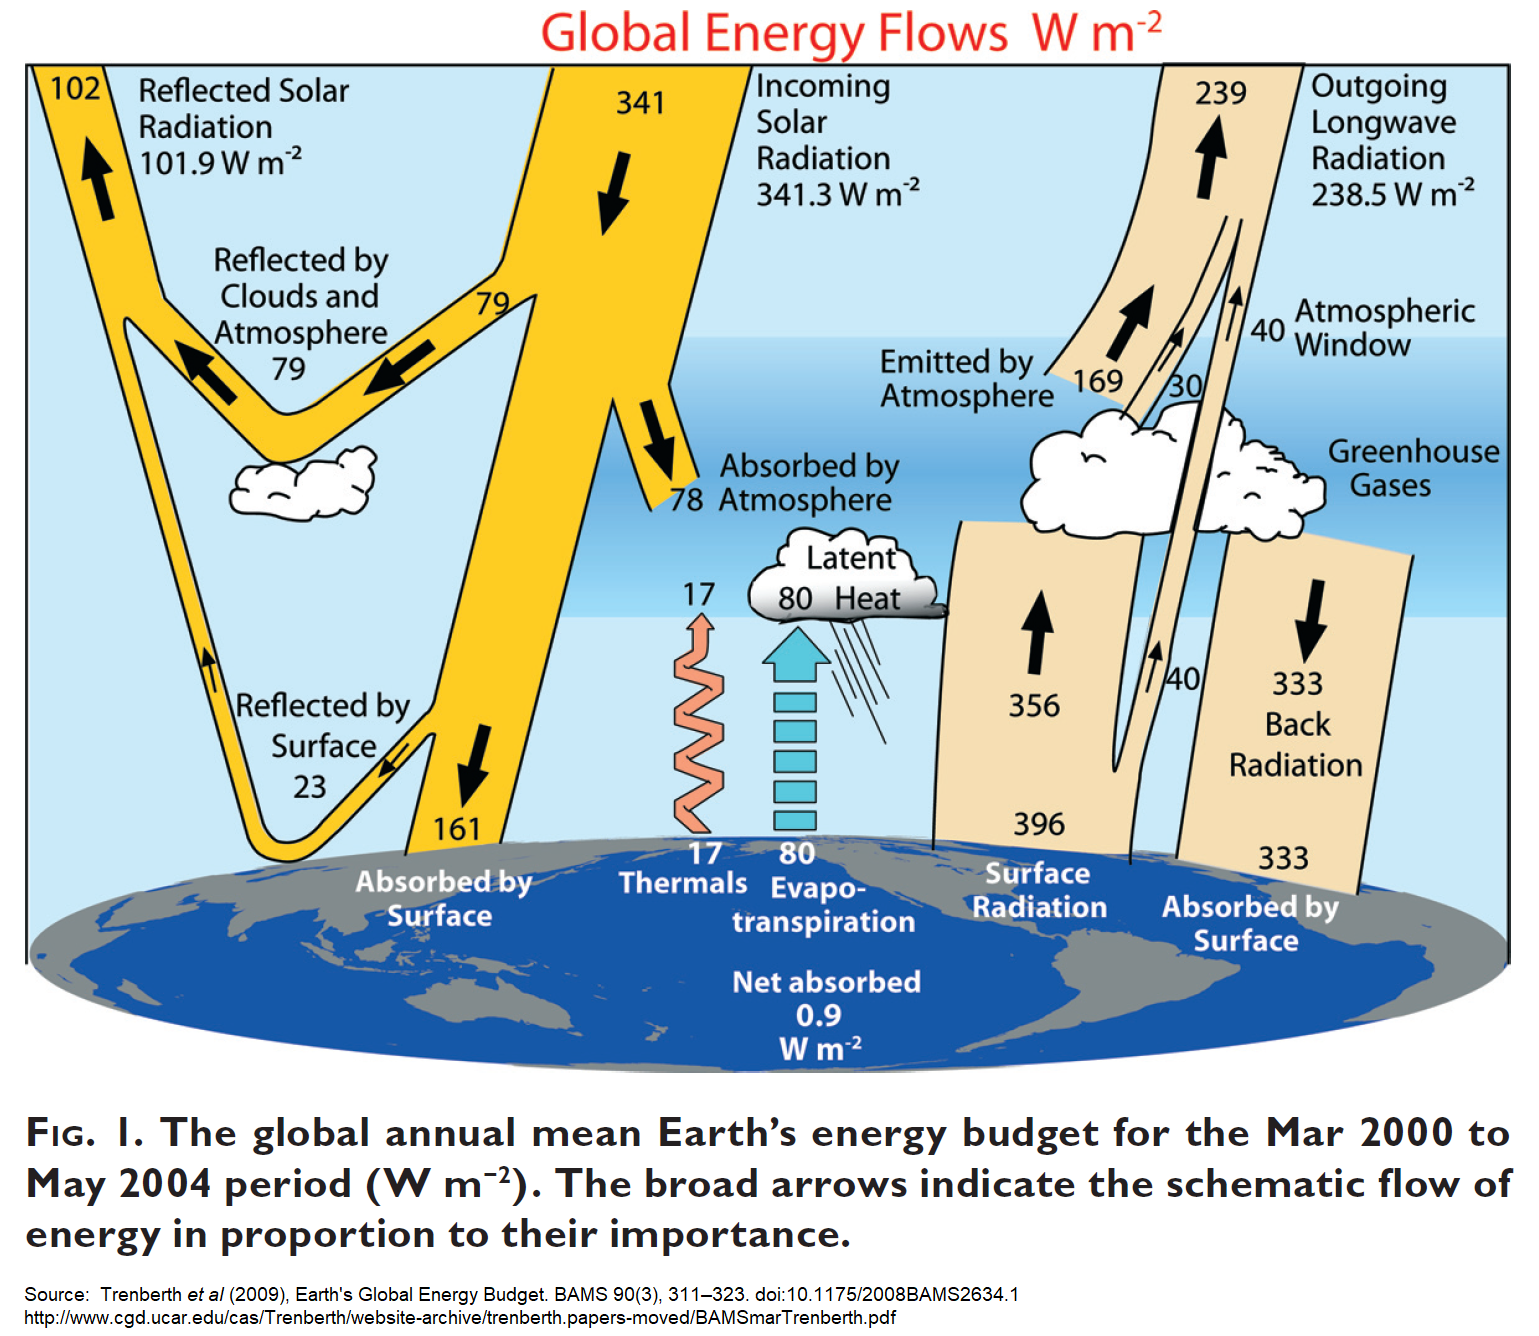
Problems:
1. there’re no confidence intervals at all, and
2. he show’s a wildly exaggerated radiative imbalance of 0.9 W/m² (which I think is probably about 3× reality)
Source:
https://journals.ametsoc.org/view/journals/bams/90/3/2008bams2634_1.xml
https://web.archive.org/web/20170811022122/http://www.cgd.ucar.edu/cas/Trenberth/website-archive/trenberth.papers-moved/BAMSmarTrenberth.pdf
⋅
Here’s one of NASA’s many versions of the ERB, circa late 2019: (link)
Problems:
1. it shows the fluxes with absurd precision, and
2. no confidence intervals at all, and
3. exaggerated radiative imbalance of 0.6 W/m² (which I think is probably about 2× reality)
Source: https://web.archive.org/web/20210320185736/https://science-edu.larc.nasa.gov/wp-content/uploads/sites/141/2020/07/ERB-poster-combined-update-8.2019v4.pdf
Here’s a newer NASA version:
https://web.archive.org/web/20220716090536/https://science-edu.larc.nasa.gov/wp-content/uploads/sites/141/2021/08/ERB-Litho-Edits-2020.pdf
or https://ceres.larc.nasa.gov/images/Earth_Energy_Budget_Diagram_Litho_Handout.pdf
(also here)
Problems:
1. they seem to have confusingly renamed “atmospheric window” heat loss to “surface cooling,” and they increased it from 40.1 to 53 W/m^2, and they show it in two places, and
2. renamed the radiative imbalance to “Net absorbed by Earth System,” and
3. radiative imbalance is shown as 0.6 to 0.8 W/m² (which I think is probably 2× to 3× reality), and
4. they still have no confidence intervals at all, except for a much too tight CI for the imbalance.
WUWT discussed a 2014 NASA version here:
https://wattsupwiththat.wordpress.com/2014/01/17/nasa-revises-earths-radiation-budget-diminishing-some-of-trenberths-claims-in-the-process/
⋅
The best ERB / EEB diagram is probably NCA4’s, which I annotated here: (link)
They give the radiative imbalance as 0.2 to 1.0 W/m², with a best guess halfway between: 0.6 W/m².
Problems:
1. they didn’t even try to quantify the atmospheric window energy loss,
2. they confusingly renamed “thermals (conduction/convection)” to “sensible heat.”
3. the high end of their radiative imbalance range is certainly too high, and.
4. it confusingly calls thermals (conduction/convection) “sensible heat,” and
But at least they have honest CIs!
⋅
AR6’s version is their WG1 Figure 7.2
It’s similar to the NCA4 version, but they unjustifiably shrunk the confidence intervals. They estimate the radiative imbalance as 0.5 to 0.9 W/m², with a best guess halfway between: 0.7 W/m² (too high).
⋅
Richard Lindzen’s 1990 ERB diagram was copied (with attribution) from MacCracken 1985:
Note that the numbers in the MacCracken/Lindzen version are percentages of incoming solar radiation, rather than W/m^2.
Here’s MacCracken’s 1985 version (which I cleaned up a bit). It’s the earliest example of such a diagram that I could find. The quoted text excerpt is:
“The fluxes of energy within the atmosphere-surface system can be illustrated using an energy balance diagram. Although many measurements have been made at the surface and from satellites, there are still uncertainties of 10-20% in the values of some of the fluxes because of the difficulty of making representative global measurements. In some cases model calculations have been used to generate estimates. The values shown in the diagram in Figure 1.2 are derived from consideration of energy balances prepared by Gates (1979), Liou (1980), and MacCracken (1984), and are only an approximation.”
Source:
https://www.researchgate.net/profile/Michael-Maccracken/publication/236534420_Projecting_the_Climatic_Effects_of_Increasing_Carbon_Dioxide/links/568edcd108aead3f42f075b4/Projecting-the-Climatic-Effects-of-Increasing-Carbon-Dioxide.pdf#page=36
Citation:
M. C. MacCracken and F. M. Luther (Ed.), “Projecting the Climatic Effects of Increasing Carbon Dioxide,” United States Department of Energy, DOE/ER 0237, Dec. 1985.
Maybe that is because there is not confidence at all. 🙂
Or maybe because it is a confidence game.
BTW, I have what is intended to be a comprehensive list of known and theorized climate feedbacks (and a discussion of how feedbacks work), here:
https://sealevel.info/feedbacks.html
That’s quite an extensive list and providing references is very helpful. The Cattail/Tree competition feedback (via BBC) is a fine example of how absurd the discussion becomes.
Many on your list are subcategories of others. It would be nice to just settle into a small list — Planck, water vapor, lapse rate, surface albedo, clouds. And then the one never discussed which is advection of heat to another domain on the planet where the feedbacks have different values and heat can be dissipated to space more readily. That is, the ploeward transfer by air and ocean.
Yes, the silly cattails are the very last one on my list:
https://sealevel.info/feedbacks.html#methanefromplants
The BBC article is here:
https://www.bbc.com/news/science-environment-43990403
I called that mechanism “methane-flora feedback:”
Notice how the BBC anthropomorphized the microbes:
That’s from an organization which rarely gives unborn human babies such respect. For example:
There are a couple of feedbacks on my list which could be considered examples of your advection category:
15. Thermohaline Circulation Feedback.
16. Arctic Summer OLR Feedback.
Without any numbers to support their speculation.
There is a good reason that methane is usually measured and reported in parts per billion while carbon dioxide is reported in parts per million. And, as I have previously demonstrated, when reported in common units (PPMv) that are the native units of measurement, methane is only about an order of magnitude potentially more powerful.
My brother-in-law engineer keeps asking how much of this is due to orders of magnitude increases in measurement precision. Number 13 sounds reasonable as does more ocean data like Fig. 4 on the effect of clouds. It’s gets tiring reading papers that don’t know the definition of hypothetical, etc., which is why it is always necessary to read what we used to call “fine print.” Can we also expect renaming sensible heat after somebody like was done with centigrade?
Starting in the nineteenth century, the energy transfer processes that determine the surface temperature of the earth were oversimplified using the climate equilibrium assumption. The time dependent flux terms that determine the surface temperature were replaced by average values. Physical reality was abandoned in favor of mathematical simplicity. In his 1896 model, Arrhenius used a steady state air column at a temperature of 15 °C with constant average solar flux, and a partially reflective blackbody surface with zero heat capacity. When the CO2 concentration was increased, the surface temperature had to increase, by definition, because of the assumptions used.
This basic model was copied by Manabe and Wetherald (M&W) in 1967. They added a 9 or 18 layer radiative transfer algorithm and assumed a fixed relative humidity distribution. This created a ‘water vapor feedback’ that amplified the Arrhenius warming artifact. When the CO2 concentration was doubled in this model, from 300 to 600 ppm M&W claimed an increase in ‘equilibrium’ surface temperature of 2.9 °C for clear sky conditions. The equilibrium temperature increase produced by a CO2 doubling is now known as the equilibrium climate sensitivity (ECS)
Later, in 1975, M&W incorporated the 1967 model algorithms into every unit cell of a ‘highly simplified’ global circulation model. This model also had an ECS of 2.9 °C. Then in 1979 Manabe and Stouffer added a ‘slab’ ocean to their GCM and assumed, incorrectly. that their CO2 artifact could also warm the ocean. They ignored the surface energy transfer, including the wind driven evaporation.
In 1976, Hansen’s group at NASA Goddard copied the 1967 M&W model and created warming artifacts for 10 minor species including methane and nitrous oxide [Wang et al, 1976]. Later in 1981, Hansen et al added a 2 layer slab ocean to their model. They then ‘tuned’ this model using a combination of increasing CO2 concentration, a variable solar flux and changes in volcanic aerosols to make the model warming artifacts resemble a global mean temperature record.
This work by the Manabe and Hansen groups between 1967 and 1981 established the foundation of the pseudoscience of radiative forcings, feedbacks and climate sensitivities still found in the climate models today. Claims of dangerous global warming became such a lucrative source of research funds that these groups rapidly trapped themselves in a web of lies of their own making. These early modeling errors have never been corrected.
As computer technology improved, the one dimensional radiative convective models were superseded by atmospheric GCMs and then by coupled ocean-atmosphere GCMs. The Arrhenius equilibrium assumption was changed to a global energy balance. The GCMs were ‘tuned’ using contrived combinations of forcing agents and feedbacks to match an equally contrived global mean temperature record. None of this has anything to do with the earth’s climate. There is no global average temperature that can be perturbed by greenhouse gases.
Climate should be defined in terms of zones based on temperature and precipitation ranges such as those used in the Köppen-Geiger or similar climate classification. At present the atmospheric concentration of CO2 is increasing by about 2.5 ppm per year. This produces an increase in the downward LWIR flux from the lower troposphere to the surface of approximately 40 milliwatts per square meter per year. This cannot cause any climate change. Nor can it have any influence on ‘extreme weather events’.
The climate modeling fraud is considered in more detail in ‘A Nobel Prize for Climate Modeling Errors’ and in the Tom Nelson podcast # 271. The invalid use of the global mean temperature record as a measure of climate change is addressed in the Researchgate preprint ‘A Proposed Definition of Climate and Climate Change for IEEE PP2030 and Related Standards’
“This produces an increase in the downward LWIR flux from the lower troposphere to the surface of approximately 40 milliwatts per square meter per year. ”
No it doesn’t. Prove it.
So you’re asking Roy to prove that line-by-line and layer by layer radiative transfer calcs are correct. Hmmm…you might as well ask him to prove that KE is 1/2 MV^2….yah know just cuz you say it ain’t…personally, I liked Roy’s summary, though units of 40 mW per sq.M per year cause some mental image pixelating….
No, I’m asking him to prove that there is any power being developed from the atmosphere to the surface at all, whether incremental or not. No one else has yet done so. Asking for evidence is not unreasonable in any way.
Measured line by line for CO2 at two places in the period 2000-2010:
https://escholarship.org/content/qt3428v1r6/qt3428v1r6.pdf
The fact that they could detect the impact of seasonal changes of the CO2 levels in the atmosphere at these places gives confidence that their measurements are right…
Those measurements are taken with AERI devices. Those instruments are cooled to liquid nitrogen temperatures. This is therefore not evidence of power being developed from the atmosphere to the surface, because the surface of the Earth is not at liquid nitrogen temperatures. Your answer is thus non-responsive to my question. Have you got anything else?
stevekj, the only reason that they cool the measuring device is to reduce the noise from photons emitted by the instrument itself.
What the device measures is photons of specific wavelengths over a wide IR band coming from the atmosphere, independent of its own temperature. The device is counting photons, not temperature or total incoming energy (or power).
The latter is deduced from counting the incoming photons for each wavelength over a wide spectrum. Each photon is a discrete package of energy (or power), in ratio to its wavelength. Thus easily calculated for specific wavelengths or total incoming energy (or power).
The temperature of the sensor is irrelevant for counting incoming photons from the sky that hit the sensor.
Ferdinand, this paper was thrown at me some time ago and it is deeply flawed. In their first figure, they attribute the emissions from 600-800/cm to emission of CO2. This is a (unfortunately) common misinterpretation of the spectrum. If the CO2 was absent, there would be a broad emission peak there. The flat top in the spectrum is due to partial absorption of the water vapor emissions by CO2.
In their second group of figures, they use modeled spectra in (a) and (d), and compare them to the difference between measured spectra and modeled radiative transfer calculations in (b), (c), (e), and (f).
I understand what they are trying to demonstrate, but it is garbage.
I did a lot of investigation into the AERI system at that time. It is a very sophisticated FTIR spectrometer with the same limitations as others. It has a very narrow field of view, 46 milliradians full angle.
As with many papers of this type, there is nothing wrong with the measuring instrument. The problem lies in the users failure to understand the limitations of the instrument and how to interpret the information it provides.
Tom, as far as I know, the only reason to use the modeled spectra (which are based on laboratory and real measurements over many years) is to abstract the water vapor signal from the total signal and what remains is the absorption by CO2. The amount of water vapor was obtained by balloon measurements.
The same reason why hand-held CO2 meters use the wavelength of CO2 and use humidity to compensate the CO2 signal from the presence of water vapor.
The fact that they could detect the seasonal signal of changing CO2 levels over 10 years (+/- 6 ppmv between winter and summer at ground level for Barrow) gives confidence that their calculations are right.
If that seasonal signal is not from CO2, then what are they measuring with such a large amplitude?
See:
Further: do you agree that the measurements are independent from the temperature of the instrument, except for reduction of the noise?
All they demonstrated is that they can measure the seasonal variation of CO2 less precisely by using a different method.
Yesterday I listened to a presentation by Tim Palmer Professorial Fellow, Royal Society Research Professor in Climate Physics, Jesus College, Oxford on Probabilistic ensemble forecasting enhances the accuracy, reliability, and usability of weather and climate predictions.
He suggested that cirrus clouds having a warming effect whilst cumulus are cooling.
Those are subjective probabilities at best because the models cannot be assumed to be accurate. No reason the believe the predictions as the models are just hypotheses. That the models disagree widely is enough to falsify them.
Taking an average of them should put all minds at brainwashed peace
A wilpost without a “30” in it! I take it all back, Wil. And a “+” to you too.
But logically there can only be one ‘best’ model in an ensemble. Averaging in all the inferior models results in an average value that can’t be as good as the ‘best’ model.
Tim Palmer is, I believe, using a “whole day” concept. The thin cirrus clouds are almost “clear sky” as far as letting SW sunlight through to the surface during the daytime, yet at night they are still thick enough to be a partial radiation shield for IR from ground level to cold -270 outer space. So yes they can have a warming effect compared to clear sky at night…. and a warming effect compared to cloudy skies that are reflecting 70% of incoming solar back to outer space during daytime…
Basically, on the sunny side of the planet, if you can see the cloud’s whiteness from orbit, it is reflecting SW back to outer space, and creating a cool shady spot at the surface. At night, the same cloud is preventing IR from “seeing” its lowest temperature absorption surface. I would add, there is also a climate effect that warmer surface temps will cause low level cumulus clouds to form much more predominantly than cirrus. Those cumulus clouds will form early in the afternoon and reflect a lot of the incoming 1360 W/sq.M and in a very few minutes restore a heat balance that resulted from cirrus clouds the night before.
You gotta remember, Tim Palmer is a climate scientist with a government job and his salary depends on telling the story in such a way that contributes to his continued employment. And Tim is one of the good guys who comes out in favor of sanity on occasion.
To maintain an energy balance, the Earth must radiate back to space the 240 W/m2 portion of absorbed solar radiation it receives.
This opening comment makes the massive assumption that absolutely zero exo- or endothermic reactions take place or that they balance to zero. An incredible assumption.
Plants absorb energy to make sugars, starches and cellulose. This process works so well that we’re burning that fuel now, formed when the Earth was much younger.
It must be obvious that if we have fuel formed from previous times that the opening statement has omitted a very obvious fraction of the entire energy balance. Storage.
Until that is addressed then the unknowns are larger than investigators imagine and any apparent excess being retained by the Earth may actually be this storage.
If storage is to be flippantly ignored, call it insignificant, then surely all the wild fires, the burning of carbon based fuels, old and recently grown would amount to nothing too. Yet strangely they seem to matter, we even have to curtail our burning of carbon based fuels to pacify some governments.
Even NASA have found the Earth to be greening.
And what about the non biological reactions. Materials oxidise and reduce, often due to inorganic reactions resulting in long term stable solids, such as carbonates, (as occurring in the oceans). All of these reactions release or consume energy.
If they are to be excluded from the energy balance then I ask what is the uncertainty in the equation commented upon, it surely must be more than the instrument calibration or the measurement method. An energy balance equation where the process ignores obvious inputs such as storage is not a special case, it’s just wrong.
The summation at the bottom of this article would suggest that plants efficiently absorb 3-6% of the available sunlight.
If you ignore plants and energy storage. Then why bother picking at the minor details and the fractional percentages, I’d say that you’ve missed the big picture or least a large part of it.
https://en.wikipedia.org/wiki/Photosynthetic_efficiency
T’was an interesting article to examine, but you’ll note two things. First, the table they include shows efficiencies around 0.1% unless we are talking about cultivated crops. Second, even in the case of cultivated crops they aren’t speaking of efficiency in quite the way most of us think about it. Finally, most of this energy doesn’t go into true storage, but goes in and out — look at the annual wiggles on the CO2 curve from Mauna Loa.
I farmed for a time. My alfalfa fields would produce about 1.6 kg of dry matter per square meter over a 100 day season. The gross energy of alfalfa is about 20MJ/kg, so my fields were producing about 30MJ of stored energy per 100 days per square meter. But Figure 4 shows that this is what comes in from the Sun on a clear day. That suggests about 1% for a very productive cultivated crop, and far less in most natural settings.
The endo-thermic reactions driven by photosynthesis are balanced by the exo-thermic reactions from the various decay paths.
If this were not the case, we would either be buried in plants or be living on a dead world as plants were killed faster than they could grow.
Have you seen or read about the depths of the coal seams?
I’d say that storage is real, if not for being buried by silt, we’d be buried in plants.
That storage was done some 200 million years ago. It was also done before fungi had developed the ability to break down lignin, and before animals had started moving out of the seas to eat those plants.
Compared to the amount of plants being eaten by animals, bugs, fungi, etc. The amount of plant material being buried doesn’t even make it up to rounding error.
I agree, MarkW.
When hydrocarbons are burned, energy is released, along with CO2. When hydrocarbons are created by photosynthesis, energy is absorbed, along with CO2. The fact that CO2 levels in the atmosphere are rising tells us that the former is greater than the latter.
Different hydrocarbons have different ratios of CO2 to chemical energy, but the hydrocarbons being burned are not so different from the ones being created by plants, so it is safe to say that the net combustion & creation of terrestrial hydrocarbons is currently exothermic, albeit small compared to the so-called “greenhouse effect.”
If you add the photosynthetic and decay processes of the oceans, I’m not so confident of the sign, but the net energy flux from those processes is probably small compared to thermal storage.
I liken your Figure 1 (from H&S, 2000) to M.C. Escher’s famous ‘Ascending and Descending’ lithograph – just because someone can draw a process doesn’t mean it actually occurs.
The longer we cling to Schwarzschild’s radiative-centric ‘model’ of energy transfer through the troposphere, the longer we’ll stay in thrall to those who wish to dominate us by curtailing our access to cheap and reliable energy.
Good review, Kevin. Thank you.
“The entire topic of climate change appears to be like this; guided by numbers and measurements that need to be certain within 0.1% but are often 10 or 100 times worse.”
Ain’t that the truth!
And let’s remember – the static radiative effect of incremental CO2, CH4, N2O does not determine the result in the general circulation, as to the disposition of the energy involved in the slightly improved IR absorbing power of the clear atmosphere. No one knows that sensible heat gain should be the expected result down here when properly considering the dynamics.
Do I believe the “science” or my lying eyes? Am I really supposed to believe that outward “long-wave radiation (IR) from a particular altitude” is supposed to balance the entire incoming solar energy? When I look at pictures of the Earth taken from space I see lovely blue oceans and brown/green land as well as white areas of clouds and snow/ice which, they tell me, is a broad spectrum of wave lengths coming from various surfaces. Moreover, I remember seeing on WUWT a few months ago a picture from an IR camera in space that displayed radiation from the Earth at temperatures ranging from -80 to +50 C. (What surprised me at the time is that the measured radiation intensity difference, hot to cold, was a factor of 13, while the standard forth-power calculation would only predict a factor of ten.) Obviously, IR radiation was coming direct from surfaces. I think I’ll go with Feynman and trust measurements over theories.
Areas with the greatest solar input, are usually the areas with the greatest convection. Which would cause the top of the atmosphere at that point to warm.
Laboratory experiments have shown that the IR photons are absorbed quickly at sea level atmospheric pressures.
‘Am I really supposed to believe that outward “long-wave radiation (IR) from a particular altitude” is supposed to balance the entire incoming solar energy?’
From a ‘particular altitude’, no. The largest of the many other problems, though, is the consensus view that suppresses the role of convection, which transports sensible and latent heat away from the surface, and exaggerates the role of spontaneus radiant emission and absorption in the lower troposphere.
Basically, any mechanism is suspect that doesn’t acknowledge a priori that thermal radiation emitted by the Earth’s surface in wavelengths that can be absorbed by GHG molecules is predominantly converted by collisions with non-GHGs within meters of the surface into sensible heat, which along with the latent heat of evaporated water, is convected aloft to where it can all eventually excite GHG molecules and radiate out to space.
In your final sentence, do not ignore the release of latent heat which, by conduction, heats all air constituents, not just GHG.
I recall that episode. It was a band 16 image put up by David Dibbell, and the supposed 50C temperature was coming from far above ground. RickWill commented on it. All of these bands require some model of atmospheric temperature and composition in order to isolate emissions to a particular level. In my notes to this essay you will note that I say bands 8, 9, 10 for sure use the U.S. Standard Atmosphere. The question is, what sorts of exaggerated outputs does data reduction arrive at when the model employed is wholly inaccurate for representing state of atmosphere below the satellite? It might be interesting to explore. I don’t know how Band 16 is processed but U.S. Standard atmosphere being involved wouldn’t surprise me.
“I don’t know how Band 16 is processed…”
There is a user manual for the imager in which an equation and coefficients for converting a radiance value to a brightness temperature are given.
https://www.goes-r.gov/users/docs/PUG-GRB-vol4.pdf
“Conversion from radiance to brightness temperature (T) is achieved for the emissive bands by applying the Planck function and the spectral bandpass correction: T = [ fk2 / (alog((fk1 / ) + 1)) – bc1 ] / bc2 where fk1 and fk2 are coefficients of the Planck function derived from physical constants (i.e., the speed of light, the Boltzmann constant, and the Planck constant) and the bandpass central wavenumber, and bc1 and bc2 are the spectral response function offset and scale correction terms.” This is on p.93 of the pdf.
The coefficients are given for the emissive bands in a table on page 101 of that same pdf document.
I used the equation and the coefficients for Band 16 in R to compute the “13 times” factor in the post that hiskorr referred to. (I was comparing the radiance value at 50C brightness temperature to the value at -90C.)
Interestingly, the equation is not based on a fourth-power exponential term. It is an empirical formula using a natural log function.
One of the files I generated for interpreting the Band 16 images pasted NOAA’s color scale for “brightness temperature” onto a plot of radiance vs brightness temperature in deg C using the equation and coefficients.
https://drive.google.com/file/d/1qy4QnSkaJZeLIeC4R7-600ZuctPEUwaz/view?usp=drive_link
This may be way more than you ever thought you needed to know. But in any case it appears that the atmospheric properties do not enter into how the Band 16 images apply a BT color scale for visualizing the strength of the longwave emission received at the imager. But in the use of the images for estimating cloud top altitude, or for approximate radiating height, one would need to relate BT to altitude somehow – perhaps using the US 1976 Standard Atmosphere or some other model.
I’m sorry. In my reading of the original post with the pretty IR picture, I thought you were reporting a measured ratio of IR intensities. It was, instead, an implied value. My bad!
“I thought you were reporting a measured ratio of IR intensities”
The satellite imager measures and transmits a radiance value. The data files, which I have used but not posted about, give these numerical radiance values. Once you know the computation for how the visualization is generated through the use of a color scale of “brightness temperatures” the radiance (i.e. IR intensity) is back-calculated. I would not say “implied.” Or you might say implied by the colors, but it is a direct computation. The ratio I gave is strictly from the computation itself.
Kevin, an observant, wise, relevant and prescient comment. Great write-up by the way.
Can’t read any further than this. A rise in the emission height is not possible for well mixed GHGs. The entire concept is pseudoscience and ignores basic physics and Kirchhoff’s Law of Radiation.
Once a person recognizes this reality it becomes obvious the warming from the greenhouse effect is a fixed value once saturation of surface absorption is reached.
Uncertainties add, always. Many here disagree, but they misunderstand what is being combined and end up trying to use the CLT to show how a combined uncertainty reduces by showing a functional relationship as an average of independent measurements of the same quantity.
Nice assessment.
I have shown some of your references to uncertainty of measurement. It is refreshing to see this discussed. These are real problems and should be addressed in any scientific investigation including models.
Very well stated.
Article says:”…will lead to an increase in water vapor pressure at saturation of about 7%.”
The lapse rate is dependent on WV and the Cp of air. If both of these change what direction and magnitude will the new lapse rate be?
The approximately 40 gigatonnes of CO2 added every year require about 34 exajoules of energy to increase temperature 1 C. Is that available?
The increased mass will effect pressure to some amount which will effect temperature. What amount what direction?
Increasing water vapor at saturation by 7% per 1 K temperature rise, is true only if the surface atmosphere follows Clausius-Clapeyron scaling. My data in figure 3 shows it does not. Cp for water vapor is 1.850 KJ/kg K, which is near twice that of dry air. Yet, the heat capacity of moist air doesn’t vary by much from that of dry air simply because even at saturation we are speaking of no more than 30-35 grams of water vapor per Kg of dry air.
Air quite saturated with water vapor is less dense than dry air, so a column of it would exhibit a lower surface pressure. The effect of this buoyancy is provided by the virtual temperature of air. In fact, when very dry air from the desert Southwest is placed adjacent moist air from the Gulf of America or Mexico, as is your preference, the contrast in density leads to dry-line thunderstorms above the Western Plains from Texas to Wyoming.
H&S are fundamentally wrong on this one, and it is a mistake you can not subsume as simplification. Top of the troposphere doubling CO2 will reduce upwelling radiation by only 2.7W/m2. To this “consensus science” adds another 1W/m2 for increased downwelling radiation from the stratosphere, again due to doubled CO2. Only this results in 2.7 + 1 = 3.7W/m2. One can find this for instance in Myhre, Stordal 1997
https://agupubs.onlinelibrary.wiley.com/doi/epdf/10.1029/97JD00148
If these scheme is right is of course a totally different question.
WV feedback on the other side has far more immediate and fundamental issues than just the question on WV concentration. The belief there was a positive WV is based on the observed dOLR/dTs relation and the assumption the lapse rate would shrink with temperature increase, or vice verse. Climate science thinks it sees this:
In reality they were looking at this..
Positive WV feedback is purely based on an erroneous assumption. Those variations in Ts (by latitude, season, interannual) are mainly a thing of the surface, the troposphere shows smaller variations. The lapse rate does the opposite of what they think it would.
https://greenhousedefect.com/the-holy-grail-of-ecs/the-incredibly-stupid-case-of-water-vapor-feedback
E. Schaffer wrote, “Top of the troposphere doubling CO2 will reduce upwelling radiation by only 2.7W/m2. To this “consensus science” adds another 1W/m2 for increased downwelling radiation from the stratosphere, again due to doubled CO2. Only this results in 2.7 + 1 = 3.7W/m2. One can find this for instance in Myhre, Stordal 1997: https://agupubs.onlinelibrary.wiley.com/doi/epdf/10.1029/97JD00148“
Where did you find that in their paper? (Please provide an exact quote which I can search for!)
Perhaps I missed it, but I did not find a statement like that in either their 1997 paper, which you linked to, or their 1998 paper, which is here:
https://agupubs.onlinelibrary.wiley.com/doi/abs/10.1029/98GL01908
The formula for estimating radiative forcing (RF) from a change in atmospheric CO2 concentration is usually given as:
ΔF = 𝞪·ln(C/C₀) W/m²
ΔF = ERF·log2(C/C₀) W/m²
where:
C/C₀ is the ratio of new to old CO2 concentrations, and
ERF = 𝞪·ln(2) = “Effective Radiative Forcing” per doubling of CO2 level
The most common estimate for 𝞪 is:
𝞪 = 5.35 ±0.58
For a doubling of CO2 concentration (C/C₀ = 2) that yields:
ERF = 𝞪·ln(2) = 3.7 ±0.4 W/m² per doubling of CO2 concentration
That’s the figure mostly used by the IPCC (TAR & later). It is from Myhre 1998 (pdf), though Myhre preposterously claimed an uncertainty of only 1%.
The more realistic ±0.4 W/m² confidence interval (per doubling of CO2) is from ‘Step 4’ of Gavin Schmidt’s 2007 RealClimate post. (That would be about ±0.58 for 𝞪.) AR5 gives a similar uncertainty of “10%”.
That represented about a 15% reduction from an earlier (FAR Table 2.2 p.52, and SAR §6.3.2 p.320) IPCC estimate of:
𝞪 = 6.3 (which is ERF=4.4 W/m² per doubling)
Etminan, Myhre, Highwood & Shine (2016) reported a more complex formula which is similar to Myhre (1998), but with 𝞪 very slightly smaller for small CO2 level changes, and 𝞪 slightly larger for large future CO2 level changes; see details here. They claimed a 10% uncertainty.
van Wijngaarden & Happer (2020, 2021 & 2022) reported calculating CO2’s ERF at the mesopause (similar to TOA) to be 3 W/m² per doubling (see their Table 2, rightmost column). That makes:
𝞪 = 4.33
Kevin, I have a simple problem with the simple theory, which I’d be grateful if you can resolve.
That is, in the simple model, if the height of the 5.1 km, 255 K, emission surface increases by 150 m, the surface area of the emitting sphere increases by 2.63%.
A 2.63% larger surface area, everything else unchanged, means the initial energy flux density diminishes from 240 W/m^2 to 233.7 W/m^2. The 233.7 W/m^2 equates to S-B 253.4 K, down from 255 K.
Now add back 4 W/m^2 of doubled CO2, and the emitted flux goes to 237.7 W/m^2 at the same 2.63% larger surface area. The S-B temperature becomes 254.4 K, or 0.6 K lower than the original emission surface temperature.
On the other hand, with the additional 4 W/m^2 of doubled CO2, the emission surface area need only increase by 1.67%, corresponding to a height increase of 95 m, to retain total emission flux density at 240 W/m^2.
If that happens, the 255 K height is 95 m higher, and the same lapse rate causes a decrease in the surface temperature by 0.62 K. That is, 0.62 K cooler, on doubled CO2.
Have modelers or others factored in the change in emission surface area with emission height? Is the change in emission surface area somehow compensated out?
Thanks so much.
The relative change in area is 2dr/r and is smaller than you have calculated (r is Earth radius). Yet, what you say brings up other issues. The constraint is energy and not really energy per unit area. I’d say from their focus on unit area that they never considered other than a flat Earth. It makes sense. It fits in with the rest of their simple story and zero-dimensional models of energy balance are where this whole worry began. However, they themselves admit that the model is simplistic.
In reality there is no upper surface. How radiant energy finally escapes Earth is very complicated.
Once a climate models takes the place of the simplistic explanation, then the arikawa grid chosen takes care of geometrical problems, but there are still so many other non-trivial issues. I have collected quite a few articles on parametrizations and hope to dig into that problem at some time. The simple model doesn’t account for energy being transported toward the poles everywhere outside the tropics. If you read the Held/Soden series of articles they are very tropics centered and climate models just take care of many details.
William Gray was pretty convinced that the climate models didn’t fully handle mass balance correctly. I wonder if there aren’t little problems all over.
The formula is dr^2/r^2, but you’re right.
I made a careless math error. The increase in surface area is only 0.0047%. Urk.
Thanks very much for your discussion.
Your exposition is very informative. Lots of stuff I didn’t know and should think about,
Very interesting article…
One error encountered:
“However, the invariant gradient of 6.5K/km means the temperature at Ze+150m is lower by about 1K, and according to the Stefan-Boltzmann law this amounts to a reduction in outgoing radiation by about 4W/m2”
The problem: the atmosphere is not a black body, 99% is a nobody and completely transparent to any IR photon. Only GHGs interact in very specific wavelengths, far from any continuity spectrum, thus the S-B equation doesn’t hold at all for gases (and vapors)…
The GHG effect doesn’t depend of reducing the outgoing radiation, it depends of the radiation energy back to the surface, which is larger than the incoming sunlight energy. Not new energy, but recycled energy, measured at a lot of places:
https://scienceofdoom.com/2010/07/17/the-amazing-case-of-back-radiation/
and following chapters…
Agree. It’s why my first criticism is with the so called emission surface.
The problem I have with back radiation is the collisional decay of CO2* is 29,000 times faster than radiative decay, at 1 atm. Radiative decay of CO2* is negligible in the troposphere.
I suppose back-radiation can be the thermalized IR, but the 15u band is absent.
‘The problem I have with back radiation is the collisional decay of CO2* is 29,000 times faster than radiative decay, at 1 atm.’
The idea that thermal radiation from the Earth’s surface initially absorbed by GHG molecules is overwhelmingly converted to sensible heat within meters of the surface by collisions with non-GHG molecules seems to be highly suppressed. If true, then the application of Schwarzschild’s radiative-centric energy transfer model over the entirety of the troposphere is in error, along with the alarm-o-sphere’s characterization of CO2 as the ‘control knob’ of the climate.
Given the huge role that back-radiation, aka downward long-wave radiation, plays in the alarmist narrative, it came as a huge surprise to me that this is largely a ‘parameterized’ input, the details of which don’t instill much confidence in the accuracy of the estimates:
:https://agupubs.onlinelibrary.wiley.com/doi/full/10.1029/2010JD013888
That is a very complete and, in my view, correct presentation. Thanks for the reference.
Pat and Frank, the energy transfer between gas molecules is in both directions, high thermal energy N2 and O2 molecules can excite CO2 by collisions too…
CO2 lasers use that principle by exciting N2 molecules that transfer their extra energy by collisions with CO2 molecules:
https://www.iqsdirectory.com/articles/laser/co2-lasers.html
The specific back radiation from CO2 was measured with line by line spectroscopy in the period 2000-2010 at two stations:
https://escholarship.org/content/qt3428v1r6/qt3428v1r6.pdf
They even could detect the changes in back radiation from the small change in seasonal CO2 levels…
Ferdinand, Feldman (2015) was discussed here at WUWT 6 months ago.
Stevekj had this to say to Anthony Banton. The linked discussion is worth following.
“Anthony, you may have failed to grasp how radiometers work, and what the results mean, as well as the difference between “energy” and “power”. The only way to measure positive downwelling IR power from the sky is to cool your radiometer far below ambient surface temperature (and therefore below the temperature of the sky as well). But this is now a different physical system than the one we all live in, isn’t it? Where I live, the surface temperature is not 77 K. So you can’t make any conclusions about the real world from the artificial environment of a liquid-nitrogen-temperature radiometer.”
Steve’s point seems fair to me. If the radiometer is measuring radiance relative to a LN2 reference, one will always find intensity from an object warmer than 77K.
Pat, indeed, I missed that discussion, but I don’t see how Stevekj answer is relevant…
The only reason to cool down the radiometers to extreme low temperatures is to minimize radiation (“noise”) of the instrument itself to the sensor.
The amount of back radiation is not influenced by the fact that one compares it to 2 K or 280 K ambient temperature: the amount of back radiation and thus downward energy is exactly the same in both cases and that is what the radiation balance, which is an energy balance, is about.
In the case of the instruments used at the two stations, these measured the absolute incoming energy line by line over a wide IR range, no matter its own temperature, which is cooled down to cryogenic lows.
The calibrations before and during use are very impressive:
https://journals.ametsoc.org/view/journals/atot/21/12/jtech-1663_1.xml
Ferdinand, you can say “minimize radiation noise” while I can say “obey the 2nd law of thermodynamics”. 6 of one, half a dozen of the other. You are never going to measure positive power coming from a colder target. No one can.
‘The specific back radiation from CO2 was measured with line by line spectroscopy in the period 2000-2010 at two stations’
Here’s the rub – ‘back radiation’ has been the deus ex machina of climate alarmism ever since Manabe and his successors began modeling the Earth’s climate by assuming that Schwarzschild’s radiative model for a non-convective Sun (a bad assumption, as it turns out) was applicable to the Earth’s convective troposphere. However, as even the authors of your second paper duly point out, back radiation had never actually been measured prior to the publication of their paper in 2015, and even they relied on extensive radiative modeling to tease out their results. Not very inspiring, and as shown in the paper I linked to previously, current research is still looking at ways to more effectively ‘parameterize’ back radiation for purposes of climate modeling.
As Pat said, near the Earth’s surface, the ratio of excited GHG molecules that are thermalized by collisions with non-GHG molecules to those that spontaneously emit photons is immense. While instruments can ‘see’ these residual emissions, they originate within meters of the surface and NOT from higher altitudes. This is because the sensible heat created by the thermalization process is convected aloft, thereby ‘decoupling’ radiative heat transfer at the surface from radiative emission into space at altitude. So-called back radiation, then, is simply a measure of the extent to which near surface air parcels have been heated by thermalization.
Frank, it doesn’t matter that the measured back radiation is from a few meters above ground or from 30 km height: it’s energy content is measured (and even long before Feldman et al). That energy content reaches the surface and adds to the energy received from the sun as SW energy. That is what heats the surface to comfortable temperatures for living creatures.
N2 and O2 don’t emit thermal IR photons (they do emit at much longer wavelengths), Thus all what is measured as back radiation in specific wavelengths is from GHGs, hardly influenced by the temperature or air pressure where they reside.
‘…it doesn’t matter that the measured back radiation is from a few meters above ground or from 30 km height…’
It’s from a few meters above the surface:
The Earth’s surface, being composed of condensed matter, emits thermal radiation, with some frequencies going directly to space and others absorbed by GHG molecules, mainly water vapor. However, due to the very long half lives of photon emissions from excited GHG molecules relative to the frequency with which these collide with non-GHG molecules, the vast majority of the thermal energy emitted by the surface is converted into sensible heat via this process of thermalization within meters of the surface. While a modicum of this energy does return to the surface via the emission of photons, the vast majority is convected away from the surface as sensible heat until a non-GHG molecule is eventually able to collide with and excite a GHG molecule whose subsequently emitted photon is able to escape into space.
What is supposedly ‘measured’ as back radiation is simply the miniscule amount of emitted energy in near-surface air parcels that doesn’t get convected upwards.
Frank, it really doesn’t matter if back radiation comes from two meters above surface (one meter above the instrument) or from 10 km above the surface.
The measured energy (or power) is what it is and far from minuscule: over 300 W/m2 continuously hitting the surface. Compare that to the average around 200 W/m2 remaining from daily sunlight that warms the surface (to snowball earth) if there was no back radiation…
The direct sunlight plus the back radiation is what makes the earth comfortable for its inhabitants…
It’s direct sunlight plus the kinetic energy of tropospheric gases that makes the earth comfortable.
I don’t think that the kinetic energy of tropospheric gases will last long, when sunlight is the only source of energy hitting and heating the surface… 255 K sounds not very warm…
Except if you have invented a new perpetuum mobile…
The mechanism is sunlight warms the surface. The warm surface emits IR radiation. I believe we agree on that much, Ferdinand.
Focusing on CO2:
In your radiative scheme, all the up-welling IR is absorbed by CO2 (within 100 m) and then re-radiated. Half the re-radiated IR is down-welling, warming the physical (solid) surface. The other half is up-welling, entering the next higher layer of air.
This mechanism implies a 0.43 sec. half-life for the rate of decay of the radiative field of each parcel of radiation up-welling from the warm surface.
A given photon field then takes 4.3 sec. (10 half-lives) to escape the lowest 100 m of the atmosphere. The energy retained in the lowest 100 m is the entire IR intensity up-welling over 4.3 sec., assuming the CO2 absorption cross-section is not diminished.
In this scheme, physical objects (plants, animals, automobiles and buildings) are warmed by IR irradiation, not by any K.E. transfer from the atmospheric gases; warmed as though in a microwave oven.
In fact, no K.E. is transferred to the gases of the lowest atmosphere, so atmospheric gases themselves are cold at 255 K. We feel warm from radiation alone.
—-
In the scheme including collisional decay, all the up-welling IR is absorbed by CO2 (within 100 m), which transmits that energy to N2 and O2 by collision. The K.E. of the gases is increased, warming the surface atmosphere.
Physical objects (plants, animals, automobiles and buildings) are warmed by K.E. transfer from the atmospheric gases (like the Hg in a thermometer). The upper atmosphere is warmed by convective mixing.
The latter scheme seems physically much more reasonable, and has the benefit of explaining why the surface air itself is warm.
Pat, in my opinion, it is both…
If there was no back radiation, it is near impossible for air to warm the surface by K.E. from the atmosphere. Especially not the ocean surface, while back radiation has no problems to do that: directly or indirectly (by reducing the heat loss by the upper fraction of a mm of the oceans waters with IR back radiation).
The heat content of the atmosphere is only a fraction of the heat content of the upper part of the oceans (around 2% if I remember well). Thus a warmer air (with more GHGs) will need a lot of time to warm the ocean surface, while the opposite is very fast…
Ferdinand, as I understand it, SW solar irradiance warms the surface. LW IR is then radiated up by the surface, warming the air.
The GHGs present in the air, water vapor and CO2, absorb some of the surface IR and enter an excited vibrational state. They then, by collision, covert the vibrational energy into K.E., further warming the atmosphere.
A small amount of the vibrational energy is emitted as radiation. But the very large difference in collisional and radiative decay rates means the re-emitted radiation is negligible.
The only mechanism I can think of to change this, which occurred to me yesterday, is if the surface radiation field stimulates CO2* to emit radiation, analogous to the mechanism of a laser. I’ve no idea whether this happens. Perhaps Steve or Tom could weigh in on this possibility,
Absent stimulated emission, there just is no obvious mechanism by which re-emitted back-radiation plays any significant part in surface warming.
‘Absent stimulated emission, there just is no obvious mechanism by which re-emitted back-radiation plays any significant part in surface warming.’
This seems a very reasonable conclusion, but I don’t have the physics ‘chops’ that you, Kevin, Tom and many of the others here do.
But I can read, and any fair review of section 5.4 [Harde (2013)] by itself would seem to put a serious damper on climate alarmism. I mean, they do a bottoms-up derivation of the Schwarzschild model, assumptions of applicability and all, and then come up with a very plausible worst-case CO2 impact that is 5x smaller than the IPCC’s. I’m just amazed this got through peer review.
Pat, not my best field of knowledge, but if the sun in average gives less than 200 W/m2 incoming energy to the surface, then no more than 200 W/m2 can be sent out to space without GHGs.
Fully thermalized over at least the troposphere, thanks to GHGs, that too can’t heat the surface to more than 255 K, as that is the original surface temperature and the air above the surface only gets colder than the surface itself.
What is measured is over 300 W/m2 back radiation, no matter if its main origin is from 2 meter above ground or from the whole troposphere. Measured, not calculated or guessed.
Given that the heat content of the air column is much smaller than of the ocean’s mixed layer (the upper few hundred meters in close contact with the atmosphere), I doubt that the K.E. of the atmosphere can heat the ocean’s surface layer. The opposite doesn’t have any problem to do that.
Ferdinand, the global mean insolation is about 245 W/m^2. Most of the heating is in the tropics.
On a clear summer day in Arizona, for example, solar irradiance can be 1000 W/m^2. The IR rising from the heated surface continually excites GHG molecules, which continually decay by collision, which continually puts K.E. into the troposphere.
All the 15u radiant energy rising from the surface is absorbed in the first 100 m of the atmosphere. This is where collisional transfer of K.E. occurs.
Local equilibrium is continually driven, but probably never established, between radiance, excited GHG molecules, and collisional transfer to K.E. Convection brings heated surface air (higher K.E. molecules) to altitude.
Given heat transfer from the surface to the atmosphere by way of GHGs (especially water vapor), there may be no great problem to achieve a 300 W/m^2 K.E. radiation bath.
Pat & Ferdinand, not sure if either of you have seen this short written synopsis of why (Tom) Shula & Ott take issue with the consensus view of radiant heat transfer in the troposphere. It’s a very easy read, at least compared to Harde [2013], and it references many other sources that support their position.
https://andymaypetrophysicist.com/wp-content/uploads/2025/01/Shula_Ott_Collaboration_Rev_5_Multipart_For_Wuwt_16jul2024.pdf
Thank-you, Frank. That analysis looks very useful. Tom’s comments here have been very helpful. So have Steve’s and Kevin’s for that matter.
The whole discussion here has been very high-level, with a minimum of lapses.
Having read the first part, I must say that I am not convinced by their reasoning.
At ground level and 15°C, some 3% of all (inert) molecules have high enough energy to excite CO2 (and water vapor) molecules with collisions. That is enormous. Even if the rate between the excited molecule to radiate vs. thermalise is minuscule, I wonder what the ratio between upward and downward radiation gets.
After all, we are not on Venus, the lapse rate is quite modest in the earth’s troposphere, which points to a rather small difference between outgoing and downgoing radiation for each layer up to the tropopause.
Then picture 9 right part can’t be true:
“Thermalisation prevents back radiation from GHGs.”
If GHGs convert heat into IR-radiation, as the second from right arrow shows, that is in every layer of the atmosphere, including near ground and in every direction, including back to the surface.
With a much higher probability near ground for collisions between inert molecules and GHG molecules ánd a higher percentage of inert molecules that have sufficient kinetic energy to excite a GHG molecule.
Thus GHGs don’t prevent back radiation, they are an active part of it.
There’s a big difference between a few percent (molecules with sufficient energy to excite IR active gases) and 1/50,000 (photons that can spontaneously emitted at STP).
I suppose there are two ways to ‘model’ the lapse rate: One would be a convective mechanism driven by a gradient of near-surface warming (thermalization) to upper-atmospheric cooling (reverse thermalization), which is what makes sense to me.
The other would be a continuum of “n” atmospheric layers (shells), each of which absorbs (n+1)w units of radiation from ‘below’ and (n-1)w units of radiation from above and emits nw units of radiation upward and downward, respectively. The math works, but, c’mon, really?
‘I don’t think that the kinetic energy of tropospheric gases will last long, when sunlight is the only source of energy hitting and heating the surface.’
Lucky for us, we have a diurnal cycle of about 24hrs.
All kidding aside, I think Pat’s description of the ‘scheme including collisional decay’ is pertinent to how radiant home heating systems actually work.
Specifically, IR from a heated floor (condensed matter) heats all objects (condensed matter) in the room by direct line-of-sight radiant transfer, as well as the room air itself via the excitation of GHG molecules which then transfer their energy to non-GHG molecules via collision.
Having lived with both radiant and forced hot air systems, I will tell you the former provides far more comfort for less fuel, not only because hot air stratifies towards the ceiling and is a lousy conductor of heat to boot, but because ‘back radiation’ isn’t really a thing.
There are so many possible translational and rotational states that greenhouse gases in excited states can interact with that the atmosphere is essentially thermalized despite it being nothing but broadened lines. It is tenuous for sure at some wavelengths. It takes no path length at all to become black at 15u.
First, there is no single “emission surface”. The regions in which each GHG species emits, however, are quite distinct.
Back to Harde (2013) Figure 17 where he models water vapor emission only, the multitudinous water vapor bands emit over a range of altitudes from about 2.9-6.6 km for those subtropical conditions in his model. Emission to space will occur roughly when the rate of spontaneous emission exceeds the rate of thermalization in the atmospheric radiation pool. It is a function not only of temperature and pressure, but also of the emission cross section and mean excited state lifetime for the individual peak. This is why the water vapor emission spectrum is so broad and jagged.
in the region where water vapor is in emission, CO2 and ozone are still in absorption. The “troughs” in the spectrum around those peaks are due to partial absorption of the water vapor emissions by CO2 and ozone.
Ozone emits in the stratosphere and that emission is represented by the sharp spiked peak at the bottom of its absorption “trough”.
The CO2 emission height is at the mesopause, typically stated as 83 km. There is very little energy remaining to drive emission and we see the tiny peak at the center of the CO2 “trough.”
There is no such thing as “recycled energy”, Ferdinand. And downward atmospheric radiant power has never been measured. I explained your faulty physics misconceptions to you two years ago, remember? That was when you found yourself backed into a contradictory corner due to your false assumptions. Not only did you apparently forget this entire physics lesson, but you even tried to “recycle” your complete ignorance of how AERI instruments work, just a few comments above in this thread, too. That’s not very scientific or intelligent of you.
https://tallbloke.wordpress.com/2022/07/11/ned-nikolov-does-a-surface-solar-radiation-dataset-expose-a-major-manipulation-of-global-temperature-records/comment-page-1/#comment-182952
Steve, that’s a terrific conversation. Thanks so much for linking it here. I plan to spend some time to study it Your insight on the question to CO2 ‘down-welling’ radiance is critically important for understanding.
I found a 2006 experimental measurement of surface CO2 emission by Evans and Puckrin (pdf; cf Figure 1), relative to a LN2 spectrometer reference. It shows specific radiance bands assignable to CO2 and O3.
The units are power, not energy, though, an important difference you strongly establish.
Also, the intensities seem extremely weak. So, I’m wondering if they’re measuring the radiant power of the very small fraction of CO2* that do decay radiatively.
If you have any thoughts concerning the meaning of their result, I’d be very happy to receive them.
Thanks for taking the time to present such a detailed exposition (starting here).
‘Also, the intensities seem extremely weak. So, I’m wondering if they’re measuring the radiant power of the very small fraction of CO2* that do decay radiatively.’
That’s what Shula and Ott believe. FWIW, I’d like to see their ideas brought into the open for discussion, but given the importance of ‘back radiation’ to the CAGW camp, and the fact that the current Administration is sniffing around the EPA’s Endangerment Finding looking for issues, I don’t see much chance of the science media or the climate / modeling community allowing that to happen.
Thanks for the “promo”, Frank. We would like to see this discussion in the open as well. Unfortunately, it has become clear that the “establishment” has no interest in pivoting from the “radiative transfer” narrative despite the fact that energy transport via radiation in the dense troposphere is impossible.
I posted a brief summary (in two parts) of the alternative model in this discussion that pertinent to the thread above I’ve you are interested.
Markus and I have also been working with Andy May and he has posted a number of articles on his blog.
https://andymaypetrophysicist.com/2025/02/01/energy-and-matter/?amp=1
https://andymaypetrophysicist.com/2025/02/15/schwarzschild-about-the-equilibrium-of-the-solar-atmosphere/?amp=1
https://andymaypetrophysicist.com/2025/02/10/the-climate-catastrophe-a-spectroscopic-artifact/?amp=1
Kudos to Andy – I find the written articles on his site add a lot of clarity to the videos. Also thanks to Kevin, there’s a lot of good discussion on this post from both sides of the debate.
Thanks Pat! If you do have any more questions, I’ll be happy to clarify.
I took a quick look at the Evans and Puckrin study you linked, and just like Ferdinand’s reference above, these two are using liquid-nitrogen-cooled spectrometers. So they are able to measure power (energy transferred) from the atmosphere (warmer than liquid nitrogen, fortunately for us) to their liquid-nitrogen-temperature sensor – which makes sense from a physics perspective. But you should be careful not to conclude from this that “greenhouse” gases are developing power (transferring energy) to any other object on the surface of the Earth, all of which are much warmer than liquid nitrogen – and warmer than the atmosphere directly above, too, as a general rule.
(There are occasional exceptions when the ground can be colder than the air, and then power can be developed downwards. I’m thinking of foehn winds and other similar phenomena. In these cases, though, the temperature difference is still only going to be a few degrees, and the resulting power will be measured in milliwatts. I haven’t seen anyone try to actually measure this in such conditions though.)
Pat, if you believe that Steve is right and that back radiation doesn’t exist, despite of tens of stations in this world doing exactly that, then sorry, that is simply ignoring what real scientists do.
IR radiation measurements are not “relative to” LN2 temperatures, the instrument counts incoming photons as voltage over a chip, whatever its own temperature. The cooling is only to reduce noise (photons) from the instrument itself.
Table 2 in your reference shows 26 W/m2 (continuous) downwelling radiation by CO2, which makes it the most important GHG (after water vapor, which is not shown).
The EPLAB Precision Infrared pyrgeometer is a thermopile instrument that measures infrared irradiance without cryogenics:
http://www.eppleylab.com/instrument-list/precision-infared-radiometer/
What does it show, pointed at the sky?
I don’t know, Pat; here is a continuous horizontal PIP measurement:
https://midcdmz.nrel.gov/apps/gdisplay.pl?BMS
The ~200 W/m2 level varies with air temperature, and increases slightly with cloud cover.
I have a small IR thermometer that pointed to the sky at night shows some -10°C, if I remember well.
Dr. Spencer did the same and it also showed a negative “temperature” not far from zero °C, while one would expect -273 °C, if there was no back radiation…
You can see and correlate it against weather at this site. There aren’t many SURFRAD sites, but enough to get an idea of what goes on. As Karlomonte says, downwelling IR usuually rises with increasing day temperature and also with low cloud cover. Not hugely, not varying like solar downwelling, but enough to convince a person that not only does thermal IR convey heat in the troposphere, but some of the downwelling IR originates at the warm surface — thence absorbed in the atmosphere and clouds, and finally a portion is redirected toward the ground.
How does one differentiate between down-welling IR re-radiated from CO2, and IR of the same frequency representative of the 288 K thermal radiation field?
I was awake a lot last night, myself, pondering this entire discussion. I’m going out on a limb here ’cause I haven’t thought this out, but as long as condensed materials do not get into the view of the spectrometer, then there is no 288K radiation field — no continuum (I know people have spoken of a continuum from water vapor dimers and trimers, but I’ll ignore that for now). There are just lines until the lines are so thick that limited resolution of the instrument can make them look continuous. The view is just like that of figures 21 and 22. And you’ll note that the magnitude of these lines relative to one another, produce a sort of digitization of the black-body thermal field of whatever temperature energizes them.
Look at figure 21 downward looking view of the polar ice cap. In the atmospheric window what one sees is measurements that show a segment of the Planck curve for something very near 268K — ice surface radiating as a grey body, not perfectly black, with no species available to interrupt the radiant flux. Look over on the spectrum at 20um and longer, lines from H2O so closely spaced that they have obscured the direct surface but come from the top of the water vapor rich surface air. This is the polar region so maybe the water vapor is mainly a km and below. The spectrum looks cooler, but not much.
Now look at 22. No condensed matter in background at any temperature to produce a thermal spectrum. However the dense forest of lines mimicks segments of various Planck curves, slightly below the surface temperature, the radiation field of which excites the whole scene. The few places where figure 22 looks like there is a continuous spectrum is mainly around 15u. But that is the CO2 line and its P and R branches which have an optical depth of 1 for each 10m of path. Follows a surface temperature curve cause it comes from near surface.
There is more to think about and work out, like how the kinetic energy of the diatomic molecules can energize some emission through collisions, but can you see what I am trying to convey?
I think I see your point, Kevin. There’s no dispute that collisions can activate emission. The question is, how much emission?
Raising the interesting comparison with BB radiation caused me to think about that a little (always hazardous). A classical blackbody radiator — an oven with a pin hole, say — is solid. All the oscillators are strongly coupled, and so there’s a continuum of states and of radiation.
Gas molecules are discrete oscillators. So one gets the distribution of states predicted by Statistical Thermodynamics, but discrete oscillators produce discrete lines.
I was struck by your comment that the CO2 emission in Figure 22 derives from the surface. Its intensity is right at the 288 K BB line. Can this mean it’s mostly the emission of the BB radiation field at the surface? Augmented with whatever collision-produced CO2 emissions as occur?
It’s also interesting that the water lines in Figure 22 step closer to the surface with increasing cloud cover.
I haven’t tried to find the rates of collisional and radiative decay for water molecules. But one clearly needs to know those number to get an idea about the efficiency of collisional delivery of K.E. to atmospheric N2 and O2.
The answer to your question regarding how much emission in the atmosphere is generated by collisions is quite simple. ALL OF IT. 100%.
This is explained in my two part post of Feb 25. near the end of the comments. If you have not read it, it will explain much of this.
None of the surface radiation from the GHG frequencies escapes directly to space. All of the radiation at GHG frequencies that escapes to space is generated by collisions in atmosphere. At low altitudes there is a lot of pressure broadening which diminished at higher altitudes. This can be seen in the narrow (but tiny) Q-branch peak of CO2 at the mesopause.
But Kevin, you already told us that downwelling IR as you measured it yourself is negative. Why are you now lying and claiming it is positive?
Just to say, Steve, I have never seen Kevin to be dishonest.
It is human to be careless at times, or mistaken. Best to infer those events as the default when there’s a contradiction.
I wondered if “lying” might be too strong a word, and I’m prepared to admit that it might have been. Apologies. But he is definitely contradicting himself, deliberately, presumably only through innocent ignorance, while being completely impervious to physics instruction. That’s not a whole lot better…
Thank-you. No complaints about vigorous debate. 🙂
After a bit more reflection, I think I will stick by “lying” after all. What Kevin is doing is extremely dishonest. He is pretending to be a physicist without having studied the subject in any formal way from professionals at all. And when his mistakes are pointed out, he is not humbly asking intelligent questions like a real scientist – he just doubles down on the nonsense. That makes him an arrogant liar. There are no two ways about it. The phrase “Dunning-Kruger” would be applicable too.
What kind of respectable, humble, and intelligent human being pretends to know something he has never studied, Pat? Would you wander into a chemistry forum without having studied any chemistry, and then start spouting random baloney, and hope to be taken seriously? Of course not. What about astronomy? Biology? Rocket science? Railway engineering? No way. Yet something about physics seems to lure people into thinking that it’s easy, and so of course they know all about it, just like everyone else does, right? (Well, I expect the chemists and rocket scientists have their own arrogant ignorant kooks too – I just haven’t met them because I don’t hang out there.) But physics is a bit more complex than just guessing and stringing physicsy-sounding words together into grammatical sentences. It takes years to master the fundamentals, and Kevin hasn’t even started. He apparently thinks he doesn’t need to. That is a whopper of self-deception, at best.
Sorry to see that, Steve, I know Kevin from prior conversations. He’s always honest.
Also, he’s very well trained – and better than I am in many subjects.
So, I’ll have to disagree with you about the lying business. .
A good while ago, during conversations with a mathematician and a physicist about the foundational meaning of science, they said things that I found very strange. For example, “Theory is primary.” And that the universe is an unneeded assumption.
Trusting these guys, I had to figure out how they were conceiving things in order for their statements to make sense.
I finally did so, and in so doing my understanding of what science is changed.
I’m not taking sides in the dispute between you and Kevin. But can suggest that presuming honesty and then trying to understand the point of view that results in one stating as they do, might lead to some new understanding. Perhaps even the nature of the mistake, if there is one. Or perhaps why there is not.
There are people here who lie — mostly climate alarmists. But most people here are educated and/or intelligent. So, the lies are clever, typically lies of omission.
Kevin apparently either has a different understanding or the same understanding differently expressed. In either case, it’s worth the discovery.
I know where you’re coming from, Pat, and I try very hard to assume people are being honest and forthright until proven otherwise. Generally I do see Kevin behaving like that. He is much more honest than the lying climate grifters. And I gave him every opportunity to defend his false claims to the best of his ability. But it very quickly became clear that he is pretending to know physics without having studied it. How honest is that? Do you pretend to know chemistry without studying it? Of course not. (Let’s assume you haven’t studied chemistry for the purpose of this analogy, I don’t know if you have)
If I had to guess, and I’m fairly confident about this, I believe Kevin’s problem is that everything he thinks he knows about physics comes from those lying climate grifters. Who told him that that was a reliable way to learn the subject?
Steve, Kevin has a faculty slot at the Dept. of Mechanical Engineering, University of Wyoming, Laramie.
He did the physical methods forensics for published study of the Jerusalem Ossuary. He’s very well-trained and must certainly have studied physics for his degrees.
Again, I can’t speak to the substance of the debate, but have no doubt that Kevin is honest in the discussion.
As to me, I’m PhD Chemistry, and spent most of my career as scientific staff at the Dept. of Chem. and the SLAC National Accelerator Lab, Stanford University, now Emeritus. So, I know some chemistry, anyway. 🙂
Hi Pat, well, I obviously picked the wrong random subject out of a hat for my analogy, then 🙂
I am not surprised that Kevin is an Engineer. There are lots of engineers around here who don’t know the first thing about physics, despite what you (as a non-physicist) may have assumed. It’s actually quite common. Engineers don’t actually study physics, as it turns out. They don’t need to. The educational approaches for Engineering and Theoretical Physics are very different. Engineers (yes, I took engineering courses too) are taught like this: “Here’s a formula. Never mind what any of these concepts mean in any theoretical sense, it doesn’t matter. Now go make some money with it.” Physicists are taught very differently, though. We need to have a solid grasp of each fundamental concept before learning the next one, and then of course how each concept is related to all the others. It takes years to nail these things down, and engineers simply don’t have that kind of time. There are too many formulas to learn and lab projects to complete to be bothered with the theoretical underpinnings. So they don’t actually learn them. At all. Sadly 🙁
You can tell that Kevin hasn’t learned any of the fundamentals, because when I asked him to define any of the words he uses, he either refuses to answer, or gives the wrong answer.
And of course the other dead giveaway that he has no clue what he is talking about is that his claims are not backed up by experiment. Never mind being backed up by other people’s experiments, which is of course a fundamental requirement in any scientific endeavour, but his claims aren’t even backed up by his own experiments. He said so. That should be acutely embarrassing for him, but he doesn’t seem to be embarrassed. I can only speculate that he’s not smart enough to realize how little he knows, or how uninformed he looks in a field he hasn’t studied.
And yes, I could insert various stereotypical jokes here about the intelligence of engineers, but I won’t stoop that low, and I’m sure you’ve heard them before 🙂
Hi again Pat,
We’re going to run out of time on this article thread in a few days, but I wanted to mention one more analogy I came up with for how Kevin is approaching his physics. To use chemistry terms that you might be more familiar with, he is behaving approximately like this: imagine that I come up to you and claim to know my chemistry, spouting a bunch of chemical words in grammatical English, like “methane” and “reactions”, and yet, when pressed, I can’t tell you what a beaker is for, how to do a titration, or even that atoms can be combined to form different molecules. That is the level of misunderstanding that Kevin is dealing with in his physics. (Along with every other engineer, lawyer, fisherman, and electronic measurement apparatus specialist around here that I’ve talked to.) You can’t see that, because you’re not a physicist either. But every physicist can see it immediately.
You can’t pass a chemistry course without knowing that atoms can combine to form different molecules, and you’ll never pass a physics course without knowing what “energy” means. Yet Kevin has no idea.
Thanks, Steve. Your insights are very welcome.
There’s no problem with incorrect views honestly stated. Ensuing collegial discussions with an expert (e.g., you) will clear up misunderstandings.
The only distressing part for me is that, especially in climate, conversations can descend very quickly into abusive language and accusations of personal failures of honesty and ethics. That happened a bit here.
Personal derogation is unnecessary, but turns out to be the standard repertoire of the ideologically bound and the politically fixated.
I cut my teeth in such arenas arguing science and creationism online back in the 1990s. Keeping control of feelings and language was the only way to be effective — particularly in retaining credibility among those who read but do not post. Doing so became a conscious effort for me (and it is an effort), and remains so.
That doesn’t mean I don’t reply sharply. But it’s always of the, ‘that was…’ sort, not the ‘you are a…’ sort, thereby eschewing insult.
Sane people respond well. Nutcases remain nutcases.
I know a little physics, knowing what energy is, and power, and how they’re different. But I’d never have been able to respond with knowledge about the IR detectors and what they measure, as you have done. In fact, I’d not have been able to respond at all in that conversation. But now, as you’ve weighed in, I can respond a bit in a way I could not before. My sincere thanks to you for that.
You referenced titrations — something rarely done by someone who’s never taken a chemistry lab. Cross-discipline dabbling?
When this thread closes, I plan to download the whole thing for my reference. I’ll do the same with your conversation at Tallbloke’s. They’re invaluable.
And now, if you like, something completely different.
Hi Pat,
Well, I’m not a chemist, but I try to learn as much as I can about everything. Chemistry is fascinating too! I have a little chemistry set here that I got when I was a kid, but sadly all of the volatiles have long since evaporated away. Might have to buy some more! I had lots of fun doing digital titrations on a simulator on the old Commodore PETs back in the day, too.
If you know what energy is, then you know more than Kevin does, because he can’t define that word correctly. Nothing else about this subject will make sense for him until he can, and he will continue to hallucinate power where there isn’t any, because he doesn’t know any better. That’s his own business, of course, but it’s really not healthy for him to hallucinate.
That psychology article is definitely something completely different!
Stevekj, I said the down welling IR produces a negative voltage. Do you know how a thermopile works? One set of junctions, measurement junctions, are tied to a black body which exchanges heat with its view of the sky indirectly though an IR filter (dome). The cold junction of the thermopile is tied, thermally, to the case of the instrument. If the sky would happen to be warmer than the environment then measurement junctions are warmer than the case and we get a positive voltage as a reading. Generally the sky is cooler than the instrument and the raw readings from the thermopile are negative. Radiation is coming from the sky in either case. In fact radiation is passing both directions–to and from the thermopile.
The thermopile is not perfectly insulated from its surroundings especially the dome and so a few corrections have to be made for that fact. The Eppley instrument has an internal circuit that compensates for these influences, but people more often use the output from two internal thermistors (dome and case) to effect those corrections.
Kevin, where is the source point (the ‘bulb’) of the IR radiance, when the instrument is pointing up?
Is it immediately at the aperture?
The vertically down radiant flux of the K.E. BB bath will always be less than the total isotropic radiance of that bath. So, the detection Voltage will always be negative.
If CO2 15u re-emission is significant, then the detected downward radiance should be greater than the calculated vertically downward radiance intrinsic to the 288 K BB bath.
Is that reasonable?
Your final question throws me for a loop.
First, the sum total of all contributions to the thermopile measurement junction: 1) radiant energy from the sky — the signal of interest, 2) some radiant BB energy from the dome to the measurement junction because the dome is likely at a different temperature, 3) the measurement junction has a temperature above 0K and will radiate as a BB at this temperature through the dome back to the sky — this temperature is the case temperature less some small temperature difference caused by heat conducted through a precision mounting. It is item 3) in this list that the internal Eppley circuitry tries to adjust to provide a positive output for the instrument even when the sky is cold and the thermopile has a negative output.
Let’s talk about item 1) as I see it. This is why I can’t answer your final question, because I am stating this as I see it. There is a thermal bath in the sky which has a temperature only by way of the distribution of energy among all degrees of freedom (the diatomic molecules have only translational KE, others have rotational and some vibrational). It isn’t a BB because the material is not condensed isn’t anything like a cavity. How is the atmosphere temperature maintained? The diatomic molecules gain energy by interaction with the ground surface, by collisions with the IR active species, by some input from solar visible and IR, by some process where latent heat gets returned to sensible heat and this is the one case where we are possibly looking at BB in some sense — clouds. The IR contribution is only through IR active species. The diatomic molecules do not radiate.
What gets sent toward the radiometer sensor is nothing but photons from whatever radiant species are in the atmosphere. 15u radiation from the very nearest part of the atmosphere which is also true for the dominant water vapor bands. Some radiant energy is integrated over a great depth of the sky because the sky is quite transparent in parts of the spectrum. Up where I live, above 2km, the sky is over 30% transparent. You can tell it plainly at night. When the Sun goes down the sky feels cold as space itself almost immediately even as the temperature has hardly changed.
Did this help? This thread has become long because the subject is very complex and involves quantum physics, statistical physics, instrumentation, … and there are people here who believe no radiant power comes from the sky back to earth. Part of the problem here is that while we have quantized the atmosphere, we haven’t really quantized the EM field but are rather thinking about it as more of an EM continuum.
Oh, and the radiometer just integrates energy from 4 to 50um or such.
It does help, thanks Kevin. Some understanding is emerging from the haze for me, from the comments you, Steve, and Tom have provided here.
I’m unfamiliar with the instruments and the experiment, so I’m starting at about zero. I know some spectroscopy, but power flux is new.
I appreciate your patience and consideration in providing thoughtful answers to my perhaps naive questions.
I know how thermopiles work, Kevin, but thanks for the refresher.
“corrections”
And are these “corrections” an order of magnitude larger than the signal being measured, and furthermore of the opposite sign? Are they generated, as I said before, via an invalid physics operation which involves converting ambient temperature directly into power? Does any of this ring any alarm bells for you? Even if you don’t know anything about physics, which is pretty clear, this sort of “correction” should raise dozens of giant red flags for any scientist.
No, Kevin, you didn’t apply any “corrections”. Here is what you (and the pyrgeometer “scientists”) did:
1) you took a measurement you don’t understand,
2) plugged that into a formula you also don’t understand, in order to
3) generate a physically invalid “fudge factor” that is, as I said, both an order of magnitude larger than the original signal, and of the opposite sign (!!), followed by
4) blithely adding these two numbers together without a care in the world, and publishing the result.
That’s not “science”, Kevin. It’s something else entirely.
“the raw readings from the thermopile are negative.”
This part is true. It is the only part that is true.
“ Radiation is coming from the sky in either case”
What do you think “radiation” means, Kevin? And what units should we measure it in?
Yes, and it measures negative “downwelling” IR power (at the surface, at night, when pointed upwards). In other words, upwelling. Like every other ambient temperature pyrgeometer. Kevin told us this himself, farther down in the comments.
You seem to not understand that flux is in both directions, up and down. Please keep in mind that flux and net flux are not the same.
There is not an “up” and “down” flux as in the image the radiative transfer equation creates. All of the GHG emissions throughout the lower atmosphere are generated by collisions. This creates a random isotopic radiation field that is ubiquitous from the surface upwards in the atmosphere. The intensity of the field decreases with altitude, and the spectral content changes as well in accordance with the relative concentrations of GHG species.
When the pyrgeometer faces upward, it is detecting a combination of the GHG emissions that originated within a few meters of the instrument plus scattered atmospheric window radiation that is directed toward the surface. This is why the output changes in the presence of haze, and most notably clouds. These scatter window radiation back to the surface.
When it is facing downward, it is responding to a combination of the surface field plus the atmospheric GHG emissions within the same range as when upward facing.
it would be an interesting experiment to see how the signal changes in downward facing mode as a function of the distance from the surface. Very close to the surface, a few cm perhaps, it would be mostly the surface emissions. As the distance increases, the surface emissions of GHGs will be quickly attenuated while the surface emissions from the window portion of the spectrum will remain relatively constant.
FWIW, I concur with many of stevekj’s concerns regarding what the pyrgeometer is really telling us.
When one understands the atmospheric field which manifests exclusively from collisions, explaining the appearance of spectra under varying conditions becomes fairly straightforward. One must take into account that a spectrometer is highly collimated with a limited field of view, so the interpretation is somewhat different than for a pyrgeometer which has a wide FOV but no spectral information.
Thanks Tom. It is very difficult to explain physics to non-physicists, that’s for sure.
Thank you, Steve. I couldn’t have understated that better myself.
What do you think “flux” means, Kevin? And how do you think it relates to entropy and the 2nd Law?
No, I am not the one who does “not understand”, nor am I the one who is making up fake physics apparently to advance a “climate agenda”. That would be you.
You have never studied physics and you are simply spouting nonsense that you heard from “climate scientists”. Sit down, please. Physics is not something you can just make up as you go along and hope to get it right. No one does. It is a complex subject, and much of it is highly counterintuitive. You have gotten all of the fundamentals wrong, because no one taught them to you. I can teach you, if you like, but you are going to have to stop spouting nonsense first. Are you prepared to do that?
measures negative voltage at the thermocouple. This is a net value I.e. difference between up and down flux.
“This is a net value I.e. difference between up and down flux.”
You have no idea what you are talking about. Who taught you your physics? What do you think is the “down” flux? You told us that you didn’t measure it. So where did it come from?
Thermopiles measure power transferred from A to B. That’s it. There is no “net” or “gross”.
I’m explaining this as simply as I can. Think about two plates one above the other at different temperatures. They exchange energy per unit of time. In between the two is a field of radiant flux. We generally refer to this as radiosity because it involves not only emitted power but also reflected power. We can simplify by assuming both are black surfaces — no reflection. Radiance going from the upper plate to the lower one is a downward flux. That from the lower to upper is upward. These two streams occupy the space between plates simultaneously. There is a net flux that carries energy per unit time from the hotter to the cooler plate. It involves view factors and emissivities and temperatures. This is called heat transfer. Without two fluxes, up and down, you cannot conserve energy.
I have no doubts at all about your physics knowledge. I don’t care how you gained it.
“They exchange energy per unit of time.”
That’s not how energy works. It only flows (performs work) in one direction across a given entropy gradient – and not at all if there is no gradient. (The direction of flow, of course, is the direction of increasing overall entropy.) This is a direct consequence of the 2nd law, which is itself a statement of statistics. I will ask you again: who taught you your physics? Not because it matters how you learned it, but it sure sounds to me like you didn’t.
“downward flux”
You didn’t measure that. You specifically told us as much. So why do you assert that it exists? Are you imagining things that aren’t there? Are you hallucinating, Kevin?
Ferdinand, I can’t get around the relative decay rates. The emission rate is 3.4E-5 of the collisional rate.
These rates have been measured by scientists as far back as 1956. So, I’m not ignoring what scientists do.
Given these relative rates, I just don’t see how back-radiation is important.
Nevertheless we have the measurements. But they’re power spectra in units mW/cm^2 str-cm per wavenumber, not emission spectra, which is what I would have (perhaps naively) expected.
Just now I’m trying to figure out what they mean.
My main point is that the collisions are bidirectional, thus while the emission-collision rate is extremely small, the possibility of collisions between CO2 and high energy N2 or O2 increases with temperature (and pressure).
Here discussed by Ian F:
https://tallbloke.wordpress.com/2022/07/11/ned-nikolov-does-a-surface-solar-radiation-dataset-expose-a-major-manipulation-of-global-temperature-records/comment-page-1/#comment-182876
The claim by Ian F is that at temperatures above 288 K, CO2 excitation by collisions with other molecules makes that CO2 act as a coolant, below 288 K as a warmer of the atmosphere.
While rereading that, I observed two flaws in the reasoning of Ian F:
Thus the remaining question is, what is the balance at what height in the atmosphere… As far as I know, that balance is warming the surface and the atmosphere up to the tropopause…
“it heats the surface.”
No it doesn’t. Sit down, Ferdinand. This is not your field, and you are just spouting BS.
Steve, a photon is a package of energy, if it is absorbed by any surface at any temperature, that will increase the energy content of that object. If that was not the case, where gets the energy of that photon? Just disappears?
If the net result of all incoming and outgoing radiation leads to warming or cooling, depends of the total energy balance of all incoming and outgoing radiation.
It seems that you don’t see the difference between conduction and radiation in energy transfer, or the difference between absolute energy fluxes and the overall net flux…
“that will increase the energy content of that object”
No it won’t. Prove it.
“net result of all incoming and outgoing radiation”
This is not physics, it is pure baloney, but you wouldn’t know that, would you? What do you think “radiation” means?
“difference between conduction and radiation in energy transfer”
Who told you that there is a difference? More baloney. Sit down, Ferdinand, until you have completed your physics degree.
The spectra that we see in the literature from IR spectrometers are units of spectral radiance. All they show us is what the detected radiation is in a narrow field of view, typically a full come angle of 7 degrees or less. This is what the radiative transfer models produce. They do not tell us anything about the net magnitude and direction of radiative energy flow at a point. In order to do that, one must sample from all directions, (an infinite number according to Planck) in order to determine the magnitude and direction of the flow of spectral energy.
The spectrometer on Nimbus 4, for example,
covered an area equivalent to about a 100 km diameter circle on the earth surface. Only the radiation traveling from that circle and close enough to the axis of the spectrometer to remain in that cone is detected. Any emissions that deviate from radial by more than half the cone angle are not detected. It is a very small sample.
This is explained in great detail in the 2014 summary paper by Michael Mishchenko, link here:
https://ntrs.nasa.gov/api/citations/20140012672/downloads/20140012672.pdf
As Mishchenko notes, there is no currently existing instrument that can provide a complete measurement of spectral energy flow, and it is unlikely that it is possible to create one.
Mishchenko’s paper looks terrific, thanks. Your comments have been very transparent and easy to follow. They’re very appreciated.
Your comment above that a pyrgeometer detects a combination of the GHG emissions that originated within a few meters of the instrument plus some radiation scattered toward the surface was very helpful.
Thanks for reminding me to that discussion… Was completely forgotten. Seems that what I did write there still is completely right in many aspects, especially where I did react on the writings of Nikolov… Complying that CO2 measurement data are manipulated. Shame on him for such a bloody insult to hard working scientists to give the best data available.
I didn’t see that I was “cornered” by your physical lessons, even when radiation is not my best part of knowledge…
If you still insists that back-radiation never has been measured, while tens of stations all over the world do that continuous every minute of the day, then sorry, your physics knowledge seems rather strange…
If I take IR temperatures of my house in winter, I can see where the heat leaks are, even from parts where the temperature is (much) lower than of the instrument I have in my hands. Impossible in your concept.
When a CO2 cutter melts steel at above 1200°C, the IR beam of around 10 micron starts from an instrument cooled to 80°C and at a peak frequency for an object at -80°C. Completely ad odds with your theory that a cold object can’t heat a warmer object…
No, Ferdinand, no one has measured downwelling radiant power. It has never been done. Your self-contradiction, in case you forgot, was when you wrote first “The outgoing radiation power for any object only depends of its own temperature” and then followed that by “Only if there is a sufficient [temperature] difference, that can do practical work”. These two statements are contradictory.
This of course followed your claim that an AERI device was measuring positive downward power, while forgetting that they are cooled to liquid nitrogen temperatures, which is, shall we say, kind of important. Along with several other errors involving confusing energy, work, power, and radiation, and what the S-B law means.
“Impossible in your concept.”
No, that is false. I told you this before, and you ignored me. So I’ll tell you again: IR thermometers can measure both positive and negative power. This does not violate the 2nd law. They can then adjust for their own temperature to give you the temperature of the target.
“When a CO2 cutter melts steel at above 1200°C, the IR beam of around 10 micron starts from an instrument cooled to 80°C”
They are playing around with quantum effects. Laser light is not characterized the same way as normal thermal radiation, and from what I understand it has a “temperature” of approximately negative infinity, which is indeed weird, but the amount of power supplied to the cutter is definitely enough to melt the steel. No violations of physics are taking place. You are not ready to worry about lasers if you can’t grasp the difference between energy and power in the first place.
Steve, I don’t see any contradiction between the two statements: that every solid or liquid object emits radiation to the fourth power of its temperature above 0 K is simply true and measured.
And you can’t have any practical power performance from zero difference in temperature of two objects. So where is the contradiction?
Again, the AERI instrument doesn’t measure energy directly. It counts photons. That is all. Counting photons is completely independent of the temperature of the sensor. Thus completely irrelevant in measuring the incoming radiant energy (or power).
One can discuss the fact that the hand held devices work differential or simply measures what is coming in as radiation… That is a matter of interpretation of the S-B law:
P = σA (T1^4 – T2^4).
If there is vacuum between the two objects, then only radiative transfer is possible and the formula must split into:
P = σA (T1^4) – σA (T2^4)
Exact the same result as in the first formula, but now caused by two completely independent energy/power streams…
“Laser light is not characterized the same way as normal thermal radiation”.
Neither is the IR coming back from the atmosphere. The back radiation is not normal thermal radiation…
“that every solid or liquid object emits radiation”
energy, yes, not power
“you can’t have any practical power performance from zero difference in temperature of two objects”
Correct
“So where is the contradiction?”
It is here: “adds to the total energy of that black body, no matter the the temperature” (which you wrote in a comment below). This is a contradiction because “Adding energy” (transferring energy) means doing work, which means power. This depends on the temperature difference, as you just told us. So you cannot write “no matter the temperature” when talking about energy transfer, i.e. work. If you do, you are contradicting yourself.
“AERI instrument doesn’t measure energy directly. It counts photons”
No it doesn’t. Who told you that?
“The back radiation is not normal thermal radiation…”
Sure it is. Who told you it wasn’t? (it is radiation energy, of course, not power, just in case anyone gets even more confused by your vague statement)
You are just making up BS as you go along. Science doesn’t work that way. Maybe you should just sit this one out…
Steve, from the makers of the sensor:
https://www.teledynejudson.com/products/photoconductive-mercury-cadmium-telluride-detectors
“Photons with energy greater than the semiconductor band-gap energy excite electrons into the conduction band, thereby increasing the conductivity of the material.”
No matter if the ratio photon to excited electron(s) is 10:1 or 1:10, the instrument counts photons, it doesn’t measure power, in contrast to pyrgeometers. The translation into total incoming energy is by comparing the change in conduction of the sensor to two black bodies at different temperatures (ambient and fixed) for the same wavelengths.
It is the same principle as is the case of solar cells for visible light: more photons hitting the panel gives more electrons that are pushed over the barrier between the two layers of silicon.
Thus the temperature of the sensor has zero influence on the absolute reading of the incoming energy, it only helps to reduce noise induced by the instrument itself.
And back radiation is not “normal” thermal radiation, it is discrete radiation in specific wavelengths, compared to the Planck curve from solids and liquids.
““Photons with energy greater than the semiconductor band-gap energy excite electrons into the conduction band, thereby increasing the conductivity of the material.””
Yes, and that isn’t going to happen if the semiconductor is already at the temperature of whatever object emitted the photons, is it? Its electrons will already be excited into the conduction band by its own internal energy. That’s why I said you need a temperature difference. Remember, the “responsivity” of a photodiode is defined as “ratio of photocurrent generated from incident light, to that incident light power“.
“the instrument counts photons”
No it doesn’t. Who told you that? Photomultiplier tubes count individual photons. They require external energy input in order to do this. Photodiodes, however, convert incoming radiant power (which can only be developed across a temperature difference) into electrical current, voltage, or change in conductance, via the photoelectric effect.
“absolute reading of the incoming energy”
No, photodiodes such as these do not measure “absolute incoming energy”. They convert electromagnetic power (work) into electric current. That’s different. Thermometers measure absolute energy (e.g. temperature in this case).
“It is the same principle as is the case of solar cells for visible light”
Yes, and how much power do you think a solar cell will produce if it is at the same temperature as the object emitting the visible light – such as the sun? (Be very careful if you actually try this experiment.)
Steve, it is clear that you have no idea how a semiconductor works.
The instrument counts photons. Not individual photons, but the total of photons that hit the surface of the semiconductor upper layer.
Every photon with sufficient energy can push an electron over the electric barrier between the two layers of the semiconductor, no matter its energy content. That changes the voltage of the second layer for e.g. solar cells or the resistance of the second layer for the AERI sensor. That sensor is a so called LDR (light dependent resistance).
By measuring the change in resistance of the second layer, one measures the number of photons hitting the surface of the sensor. Not the energy of these photons. Largely independent of the temperature of the sensor.
By comparing the resistance change at different wavelengths from the air with the resistance change of two built-in black bodies at different temperatures, one can calculate the absolute energy of the down-welling radiation for the spectrum of interest.
That is absolute down-welling energy, not relative to the sensor’s own temperature.
The temperature of the sensor has little influence on what is measured as change in resistance with the number of photons hitting the surface. Higher temperatures will give more noise, both by changing the resistance of the second layer, more electrons moving in the wrong direction (“dark current”) between the layers and more IR from the instrument itself on the sensor. That is the only reason to go to cryogenic temperatures.
Even so, detectors with temperatures up to 140 K are already on the market:
https://www.researching.cn/articles/OJ4407912f9efc8d65
About the first part:
“This is a contradiction because “Adding energy” (transferring energy) means doing work, which means power. This depends on the temperature difference, as you just told us.”
A photon that hits a black body adds energy to that black body, no matter the temperature of that black body or what the temperature was of its origin. Or you are destroying energy.
That means that “work” is done in both directions. The net work difference is a matter of temperature of the sender and receiver (for black bodies)…
“A photon that hits a black body adds energy to that black body”
Not in the classical thermodynamic description, it doesn’t. Don’t confuse quantum mechanics with classical thermodynamics, without having understood either one.
“That means that “work” is done in both directions”
No it isn’t. Who told you that? What do you think “entropy” means? Where do we need to take it into account?
Steve, a photon is a dedicated package of energy. If it hits a black body, it is absorbed and adds energy to that black body. No matter the temperature of where it comes from or the temperature of the black body. Energy must be conserved, no matter its form.
Adding energy to a black body is “work”.
The net transfer of energy, or net work is the difference between total radiant energy transferred from one object to another and reverse and that depends of the temperature difference.
“Adding energy to a black body is “work”.”
Yes. And you told us that this can only be done in the presence of a temperature difference.
“net transfer of energy”
Baloney. Sit down until you have finished your physics degree, please.
Steve, where did I say that it is only in the presence of a temperature difference?
Absorbing one photon by a black body is work done, no matter the temperature of where it starts or the temperature of the black body.
Any solid or liquid object emits energy proportional to their temperature to the fourth power. Each object on its own, the same amount of energy loss at the same temperature, no matter the presence or absence of other objects in the neighborhood.
I have the impression that your physics knowledge ended with conduction and that radiation is obviously not you field of knowledge…
“where did I say that it is only in the presence of a temperature difference”
You wrote that here: “A solid or liquid body will generally lose energy if its temperature is above 0 K, as long as there is a temperature difference” in your comment below. And in the other thread on Ned’s site you wrote “work can only be done in the presence of a temperature difference”.
“radiation is obviously not you field of knowledge”
What do you think “radiation” means, Ferdinand?
“ And downward atmospheric radiant power has never been measured. ”
I admit to being baffled by this claim. I have worked with radiometers of the thermopile variety. I own a few. I assure you, even at ambient temperature (not cooled), they respond to downward directed LWIR. Make corrections for case temperature and they will reproduce the expected greenhouse effect pretty accurately.
If it’s not CO2 emission, what is it?
Sure, Kevin, and what does that “correction for case temperature” look like? By any chance does it involve a mathematical formula that apparently converts temperature directly into power? If so, you know that’s illegal, right? (By which I mean that it isn’t valid physics in the slightest)
If you manage to avoid the temptation to apply any invalid mathematics-disguised-as-physics, your direct physical readings from the thermopile will always indicate that positive voltage is developed from the hot side to the cold side, indicating the direction of energy transfer (and therefore power). Never the other way around. That is what I explained to Ferdinand and Pat. It is a strict consequence (or restatement) of the 2nd Law. No one can evade it. If the hot side is the same temperature as the cold side, you get a voltage of 0. This indicates that no energy is flowing, and no power is being developed.
The corrections come from a thorough energy balance on the control volume that encompasses the thermopile. Nothing illegal about it at all, notwithstanding the charge you are making about having to use the Stefan-Boltzmann law in the correction itself. This correction doesn’t involve any sky signal. It is purely a function of temperatures on the radiometer measured with precision thermistors.
The raw thermopile readings on an infrared radiometer are negative — exactly as they should be — because the atmosphere is generally colder than the surface. The thermopile is losing net heat to the atmophere. But watch the raw readings go up (less negative) as clouds move over and so forth. The thermopile is responding exactly as it should to changes in downward welling IR from the sky and clouds.
“having to use the Stefan-Boltzmann law in the correction itself”
Yes, as I said, you are using the S-B law incorrectly (illegally!) to convert ambient temperature directly into power, and then adding that to your original reading. Right? Who told you that it was legitimate to do that?
Don’t be confusing temperature (energy) with power. They are very different. You can’t just convert one into the other whenever you want, or add them together. That’s nonsense.
You are correct that the raw thermopile reading shows negative power. This was my entire point. You should stop there, though, because up to that point, and only up to that point, you are doing physics correctly.
Steve, why is it incorrect to use the S-B law to correct the reading for the instrument’s temperature?
Ferdinand, as I told Kevin, this is not a “correction” in any way. It is a “fudge factor”, and it is generated via an illegal operation. Since neither you nor Kevin knows the difference between “energy” and “power”, this will not be obvious to either of you. However, it is obvious to every physicist.
Steve, the formula for transferred power by radiation is:
P = σA (T1^4 – T2^4)
A pyrgeometer measures P and compensates for its own radiation by measuring T2 of the sensor. That gives:
σA (T1^4) = σA (T2^4) + P
to calculate T1, where P can be positive, zero or negative.
Why is that introducing a “fudge factor” or “illegal”?
Ferdinand, you are correct that that formula (the first one you listed) measures power transferred by radiation. But the rest of your description is completely false.
First, the pyrgeometer measures power across its thermopile, which is pointed outside at the sky. This number will usually be negative, as Kevin told us, because the “warm” side of the thermopile is at approximately ground temperature, and the “cold” side is supposed to be radiatively connected to the “sky” temperature (which varies a lot depending on humidity etc.)
What the pyrgeometer “scientists” (including Kevin) (note: not the pyrgeometer itself) do next is to measure the case temperature, then plug that into the first equation, but with T2 set to 0 Kelvin. That is fake. There is no object inside the thermopile at a temperature of 0 Kelvin. Then they take that false P number and add it to the one that they got from the thermopile. Why would anyone do this?
There is no fudge factor needed. There is no “self radiation power”, that is a pure hallucination. The thermopile provides the correct answer all by itself – which is the power transferred from the ground to the sky.
Steve, the crux of the matter is in your idea that the radiation of the instrument itself depends of what surrounds it:
“then plug that into the first equation, but with T2 set to 0 Kelvin”.
There is not the slightest need for the formula to compare it to their surroundings, no matter of that is at 0 K or 288 K.
The power sent out by the pyrgeometer sensor is P2 = σA (T2^4)
The power received by the sensor is P1 = σA (T1^4) and that gives the net power transfer:
P = P1 – P2 or:
P = σA (T1^4) – σA (T2^4)
The power of any object sent out as IR is exactly the same if it is in empty space or surrounded by other objects, no matter if these are colder or hotter than that object.
The net power transfer is the difference in power sent by the two objects, in this case the sensor and the sky.
“There is not the slightest need for the formula to compare it to their surroundings, no matter of that is at 0 K or 288 K.”
Who told you that? Because it is false.
“The power sent out”
Power is not something that can be “sent out”.
This is simply bizarre. Power is energy transferred or expended per unit time. Energy is the integral of power over some time period. I cannot see the point you are trying to make.
The reason I said that is that, as you wrote above, you seem to think that energy can be transferred between objects willy-nilly, and power is constantly flowing around all over the place without regard to any entropy gradients whatsoever. Neither of those is true.
“Energy is the integral of power over some time period.”
Well, energy accumulated is a consequence of power developed over time, yes, but that’s not the base concept, it’s not the standard definition, and with this “backwards” view, you have no way to develop power to begin with. Can you think of a different definition for “energy”? One that involves the word “work”, perhaps? Along with the word “capacity”, or “potential”?
Steve, the AERI meters are no thermopiles. They count photons, no matter their wavelength or the temperature of the sensor. Each photon reaching the chip gives a discrete voltage pulse. The summed voltage is the sum of the photons hitting the sensor.
Each photon has a fixed energy content, depending of its wavelength. By measuring the voltage at discrete wavelengths, one can calculate the incoming energy for each wavelength and for the total incoming energy.
The temperature of the sensor has zero influence on the count, thus zero influence on the calculated incoming energy.
I didn’t say AERI meters were thermopiles. Kevin was talking about pyrgeometers (as I infer from his description, although he is welcome to correct me if he’s talking about something else) which operate at ambient temperature.
In discussions with Andy May, I was quite surprised to learn how prevalent was the belief that IR thermometers can demonstrate the GHE. In a nutshell, general purpose IR thermometers have a spectral bandwidth of ~8-14 μm, in the “atmospheric window”. This is to avoid interference by CO2 and water vapor which would attenuate the signal at short distances. When one points the thermometer directly upward at a clear sky, it will indicate the lowest “temperature.” This is radiation from the atmospheric window that is scattered by aerosols/particulates. As one moves lower in the sky toward the horizon, the path length increases, there are more scattering centers, hence more scattered radiation and a higher “temperature.” If one points it at a cloud, there will be much more scattered radiation, and one will se the highest “temperatures” for the densest clouds. The “temperature” is not real. It is the calculated result based on the thermopile signal.
This, and other topics are discussed in my joint article with Andy May
https://andymaypetrophysicist.com/2025/02/01/energy-and-matter/?amp=1
I also have a curiosity regarding pyrgeometers. Both Kipp-Zonen and Eppley utilize silicon domes and claim bandwidth of ~4-40 μm. Silicon is virtually opaque from ~10-30 μm, as shown here: https://www.witoptics.com/Silicon-Si.html
I have been corresponding with Kipp-Zonen for over three weeks now, having requested a graph of transmission vs wavelength for their silicon domes. It has been “escalated” to the engineering department but I am still waiting. One would think that they would have this readily available to support their claimed specification.
I performed similar “experiments” to Roy Spencer’s with the handheld IR thermometer about 8 years ago out of curiosity. Intrigued by the results, I decided that I needed to know exactly what it was measuring. It did not take much research to understand what I explained above.
I suspect that the pyrgeometers are primarily measuring scattered radiation as well. That would explain the signals they generate when clouds pass over.
‘ In a nutshell, general purpose IR thermometers have a spectral bandwidth of ~8-14 μm, in the “atmospheric window”.’
In other words, good enough to locate pex pipes in radiant flooring, wiring in walls, bad home insulation, etc., but maybe not up to the task of demonstrating the concept of back radiation?
Yes. They are not “fit for purpose” with respect to measuring radiation in the atmosphere.
They typically have an effective range specification as well, usually limited to a few meters though some specialized units are longer. A common field of view is about a 15 degree cone.
Transmission is a function of thickness. You can get silicon windows less than 1.0mm thickness with useful transmission above 50% in the 7-14um region. There are oxygen and carbon absorption features in silicon, but these too become a non-issue in thin samples. I don’t know how Eppley makes their silicon dome, but one of my instruments has a thin film coating that is not silicon.
I am baffled by “scattered radiation”. Greenhouse emission toward the ground is blackbody radiation originating in the condensed material on the surface, which is then selectively absorbed, converted perhapsin ways, then re-radiated back toward ground. It may or may not be isotropic, and some of the atmosphere’s heat is contributed by convection from the surface, but a fair amount of it is scattered radiation.
Coincidentally, about 30 minutes after my previous post I received a rather difficult to read transmission spectrum from Kipp-Zonen that I assume was from testing one of their domes. It’s definitely an improvement over the basic silicon. I found the company that probably manufactures them and their brochure contains a spectrum that’s a good match to the one Kipp-Zonen sent. You can see it in their brochure here:
https://www.topsil.com/wp-content/uploads/2023/05/hitran_application_note_october2013.pdf
Scattering, regarding the IR thermometer or pyrgeometer, is related to how all light interacts with aerosols and particulates (including cloud droplets/ice crystals) in the atmosphere. I think we have all experienced seeing dust particles either in a high intensity beam from directed light source. It could be a flashlight, spotlight, or a beam of sunlight piecing a shaded room. We see the particles because they are scattering light from the beam. This is macroscopic scattering as opposed to molecular scattering.
The atmosphere is full of particulates at varying concentrations, and they all scatter light including IR radiation. The IR thermometer as described specifically excludes everything outside the atmospheric window. In the case of the pyrgeometer, if it is ground based and looking up it can only see radiation outside the atmospheric window within a range of a few meters. This is because the GHG species absorb these frequencies and are immediately thermalized.
The clouds and aerosols scatter all frequencies, but any radiation that originates more than a few meters away is absorbed unless it is in the “window.” Clouds are much farther away, so the increased downwelling radiation from clouds detected by the pyrgeometer is only from the atmospheric window as well.
That is not to say that there is no GHG radiation detected by the upward facing pyrgeometer. There are always GHG frequencies present from the self-generated thermal radiation field that is present everywhere in the atmosphere, as recognized by Harde, and explained both in my original post and in my reply to your comment on that post. That radiation is always present and part of the “clear sky background” for the pyrgeometer.
Your perception regarding what happens to the radiation emitted at the surface is not uncommon but it is incorrect as explained. The surface field is completely annihilated and converted into sensible heat. The thermal atmospheric field is produced exclusively by collisional excitation and exists throughout the atmosphere all the way down to the surface.
They are concurrent processes that are radiatively independent of each other as explained in my original post. The surface radiation does not propagate through the atmosphere, though the use of radiative transfer theory produces that illusion in the mind.
Interesting. The spectrum (Figure 3 in the brochure) shows a sharp dip in CZ silicon at 9um which is a typical oxygen (interstitial I think) contaminant problem. The CZ they used for comparison is probably a 5mm thickness window. Below 0.5mm the CZ spectrum will be surprisingly flat, this material in the brochure a little more flat probably. It looks like this silicon is greatly processed to carefully strip any remaining oxygen and carbon — carbon coming most likely from the production of metallurgical grade silicon which is the first step in going to electronic grade which is what I am most familiar with.
You and I will have to agree to disagree about whether or not photons can leave even the surface (particularly up where I live at 2200m) and pass beyond the tropopause. I simply don’t see how certain wavelengths become “thermalized” immediately in the atmosphere when there is no species to absorb them. Now 15um radiation? Yes, the mean free path at 400ppm is less than 10m I suppose.
My point in bringing up Figure 17 in the Harde paper is to bring attention to the water vapor spectrum. Water vapor is active across the entire surface IR spectrum, even some frequencies in the atmospheric window. It is responsible for almost all of the absorption of surface radiation as well as emission of radiation to space. Its spectrum completely overlaps the 15 μm band of CO2 and in most places is far more abundant than CO2. The myopic focus on CO2 obfuscates this.
I agree entirely that water vapor in bands where there is a significant cross-section for absorption prevents IR from entering the instrument directly from any significant distance in the atmosphere. Yet, in clear sky bands, and the “window” is the most obvious, a downward viewing spectrometer notices segments of the stefan-boltzmann relationship at the ground temperature, or near thereto. Is this a grand coincidence, or did those photons travel from the only known place with that temperature?
I think that you may have misinterpreted the purpose of my comment. To help me understand your perspective, when you look at the satellite spectrum, which is a plot of spectral intensity versus wave number, how much of the area under the curve do you think is attributed to CO2 emission vs water vapor emission?
Scattering of long wavelengths needs large particles in the atmosphere like smoke or clouds; without them, there is very little scattering for wavelengths greater than 2-3 um.
That is a rather vague and broad generalization. Despite that, there are plenty of particles in most long atmospheric paths to produce the type of scattering as described. It doesn’t require a visible haze.
Scattering at any single wavelength is proportional to the particle size.
Rayleigh scattering diminishes as wavelength increases because of the sizes of nitrogen and oxygen molecules. This is why clear sky is blue, very little Rayleigh scattering of red visible light..
Rayleigh scattering is a different phenomenon from Mie scattering, which is scattering by particulates that are both huge and massive relative to individual molecules.
Tom, I sent your essay to John Parmentola. He noted that you state,
“Thermal Radiation is a property of condensed matter, i.e., solids and liquids. Gases do not emit thermal radiation.”
in your definitions, and of course took immediate issue with it.
His comment was: ‘Gases do not emit thermal radiation?
“What law of nature prevents thermal emission from gases?
“There is less emission from gases because of density but stating the above is not true.
Collisions within gases or gases with solids and liquids can excite vibrational states that result in IR emissions.”
Gases do emit thermal radiation. They can be collisionally activated to higher vibrational or rotational states, and can return to the ground state by emission of a photon.
Your comment above also states the case that there’s background GHG radiation, due to the collision/radiative decay process.
So, it would be good to remove that comment from your definitions.
Pat, hopefully Tom weighs in, but I think the perhaps unclear distinction is that ‘condensed’ matter, e.g., solids and liquids, absorb and emit along the entire electromagnetic (EMR) spectrum, whereas gases only absorb and emit at discrete frequencies. Stated differently, one could say that all thermal radiation is EMR, but not all EMR, and hence not emissions from gases, is thermal radiation.
Coming from a non-physicist, I presume the impact of all this is that the Planck function can (should?) only be applicable to surfaces, including clouds, but not to atmospheric layers, which I think often happens in climate science, but, again, I could be wrong here.
PS – Although he does mention cloud error in his criticism of GCMs, they could really beef uo this section by citing your work on error propagation.
Thanks, Frank. Citing my paper would broaden the focus of Tom’s critique.
You may be right about meaning, but the way it stands, that direct statement is at best very misleading. I wish I’d noticed it myself early on, and brought it up.
Kevin Kilty,
From your paper –
‘Invoking the Clausius-Clapeyron (hereafter CC) relationship means that each 1K rise in surface temperature adds 7% more water vapor into the lower troposphere – it’s a geometrical increase of the most powerful greenhouse gas.’
‘How well do we know the underlying physics?’ – My guess is not very well at all.
I would like to refer you to Willis Eschenbach’s post ‘Rainergy’ – WUWT – May 22, 2024. In that paper Figure 5 presents a graph of ‘total cloud cooling – radiative plus rainfall’ over the tropical oceans vs temperature. From that graph the cooling rate at 25 C averages about 85 W/m2, while at 30C it is about 500 W/M2. This represents an increase of more than 40% per degree C, not the 7% in the above equation. So obviously the physics are wrong.
What is forgotten is that at temperatures above 26 – 28 C, the amount of water vapor in saturated air is sufficient that the density differences, caused by this water vapor (40% lighter than dry air), generate wind, which increases evaporation rates, driving higher winds further increasing evaporation rates, in a self-reinforcing feed-back loop. When the winds are sufficient to cause waves with broken surface the surface area available for evaporation increases dramatically.
The result is that tropical sea surface temperatures are not in a state of thermal equilibrium, as the ‘underlying physics’ imply. But rather the tropical sea surface temperatures oscillate between two states of instability. At temperatures less than 25C there is insufficient evaporative cooling, while at temperatures greater than about 28C there is excess evaporative cooling. This oscillation between two unstable states is what is behind ENSO, as well as tropical storms.
The above described oscillation between two unstable states of thermal equilibrium, due to the high sensitivity of water evaporation to the temperature of the tropical oceans, provides a very strong anchor to tropical ocean temperatures, and thus global temperatures as a whole, no matter how strong variations in energy inputs might be. This anchoring is shown by David Shelley in the graph ‘Pole to Equator Temperature Gradients, from his post ‘The Geological Record of Climate Change’, WUWT Nov 2, 2024.
The simple model of transport leading to CC scaling works only in the lab at small scale. I have been a critic of it for a long time. I must have missed Willis’s article. So, I’ll go have a read. Thanks.
I went to read Willis’s two papers on the subject, the second one adding the effect of Virga. They were interesting reads, but the very thing I cautioned about — that these huge cooling effects are what maintains the mean state; they are not the essence of climate sensitivity — was exhibited plainly. Commenter Izaak Walton generated a long subthread. He said at one point
That is the fundamental rift here. The climate scientists do not deny that there are huge cooling effects. They deny that these are anything but maintenance of the mean state, and that climate sensitivity is something else. I doubt we can get past this divide very easily.
‘All it does is explain how the current climate system responses’
Yes, it explains how the current climate system responds. It explains how the tropical oceans, oscillating between two conditions of instability, insufficient cooling at temperatures below 25-27C and excessive cooling at temperatures above 28-30C, maintains the earth’s climate in a ‘meta-stable’ state.
Shelley’s paper shows that the ‘current climate system’ response has been in place for hundreds of millions of years, and has survived forcings that are orders of magnitude more important than CO2.
I submit that a fundamental flaw of the CO2 theory is a presumption of stability. That the climate system is inherently stable, and that even minor deviations can lead to dramatic consequences. Only in a system of stability can a minor forcing like CO2 be important.
However the opposite is true. The climate system is fundamentally chaotic, it is constantly in a state of flux. And it is the unique combination of the properties of water that has maintained our ‘water planet’ it in a meta-stable state suitable for life for hundreds of millions of years.
‘That is the fundamental rift here.’
I’ve often run into that myself here. The true believers have no discomfort with the disparity between the ‘canonical narrative’ that CO2 heats the surface by decreasing OLR and actual observations that the current warming is concurrent with both increasing OLR and ASR, i.e., the ‘response’ doesn’t have to agree with theory.
OLR = Outward Long-wave Radiation
ASR = Absorbed Solar Radiation
Frank, I don’t know of anybody who claims that CO2 heats the surface by decreasing OLR, the “true believers” claim that increasing DLW (downwelling long wave) energy heats the surface, an important difference…
If ASR increases, there is more OLR at the surface, thus also increasing DLW for the same GHG level in the atmosphere and it is the combination of both increased ASR and DLW that increases the earth’s temperature.
If GHGs increase, then for a constant ASR, DLW increases, adding to the total incoming energy at the surface, thus increasing its temperature and increasing OLR, until a new equilibrium is reached.
Ferdinand, I’ve explained to you why your faulty physics assumptions lead to self-contradiction… why are you still spouting this nonsense without knowing anything about it? There is no downwelling power from the atmosphere. At all.
Stevekj, I can be wrong, as this is a part of science that I haven’t studied in depth, only had some experiences with detection of chlorine and humidity in the atmosphere (and some processes), based on visible and infrared radiation…
There is certainly downwelling energy or power (contained in a continuous stream of photons) from the atmosphere to the earth’s surface. That is what is measured at a lot of places on earth.
Denying that there is downwelling radiation (thus energy or power) from the atmosphere back to the surface makes you completely unbelievable in the same category as the “Slayers”: denying that photons exist or that these are discrete packages of energy (or power, or whatever definition you prefer).
Ferdinand, I spent weeks trying to explain to you that “energy” and “power” are different, and now you write “downwelling energy or power”. Why would you write that? These are not interchangeable concepts.
Yes, downwelling energy is a thing. Downwelling power, not so much. Remember to specify which one you are talking about at any given moment.
Steve, sorry as non native English speaker, I do struggle with the difference, but will try to use the definitions as told in:
https://energyeducation.ca/encyclopedia/Energy_vs_power
So, a photon is a discrete package of energy in that definition. and photons originating from GHGs that hit the surface (or the sensor of any instrument) are adding to the energy balance of the surface (or the sensor).
If that leads to warming or cooling or no change in temperature of the surface, depends of the sum of all incoming and outgoing energy…
As the measured downwelling energy is already larger than the incoming solar energy, the temperature of the surface needs to go up to get the energy balance in equilibrium again…
Ferdinand, I am glad you are trying to follow the correct definitions. That is a good start. Let’s see how far we get before we go off the rails:
“So, a photon is a discrete package of energy in that definition.”
Correct. Remember, energy is the “ability to do work”, and you already told us that work requires a temperature difference. (Then you contradicted yourself by claiming that it didn’t, but we’ll let that go for now, and assume that you have realized your error.)
“photons originating from GHGs that hit the surface (or the sensor of any instrument) are adding to the energy balance of the surface”
Nope. There is only going to be “work” (transfer of energy) if there is a temperature difference (and that can only be in one direction) between where the photon started, and where it ended up. You aren’t going to be thinking about this correctly if you imagine that a photon is carrying “work” with it. It doesn’t. It is only “energy”, i.e. “potential to do work”. Nothing more.
Steve, here we are at the essence of the difference in opinion…
A photon is a package of energy. Any photon hitting a black body will be absorbed and adds to the total energy of that black body, no matter the the temperature of the origin or the end point of that photon.
There is no information in a photon that shows that it comes from the sun or from a GHG in the cold stratosphere.
A lot of photons of any wavelength transport energy from one object to another, including from a cold(er) object to a warm(er) object.
If that will give “work” depends of the difference in temperature: higher temperatures will emit more photons per m2 than colder temperatures and it is the result of that bidirectional transfer of energy that can do
“work”, depending of the difference in temperature.
Or the difference in interpretation between:
P = σA (T1^4 – T2^4)
and
P = σA (T1^4) – σA (T2^4)
The first formula can be used for power transfer by conduction.
The second must be used for power transfer by radiation.
Ferdinand, you wrote “no matter the the temperature”
But earlier you told us that work (transfer of energy) depends on a temperature difference. Which is it? Please pick one claim and stick to it. These two claims cannot both be correct at the same time. And self-contradiction does not make you look well-informed or intelligent.
Steve, the amount of energy carried by an individual photon is the same for the same wavelength, no matter the temperature of the gas molecule or object where it starts from.
It is the same amount of energy for an individual photon of the same wavelength, starting from an excited CO2 molecule at 30 km high or from a water drop in a cloud or from the hot lava out of a volcano.
The total energy contained in all photons sent by a solid or liquid object to space or another object, depends of its own temperature to the fourth power. No matter the presence or absence of other objects in its neighborhood. Exactly the same total energy is leaving the object.
If two objects in each neighborhood have different temperatures, then the total energy reaching the colder temperature object will be larger than the total energy that the warmer object receives from the colder object. That is what gives power…
“Steve, the amount of energy carried by an individual photon is the same for the same wavelength, no matter the temperature of the gas molecule or object where it starts from.”
That is correct.
“The total energy contained in all photons sent by a solid or liquid object to space or another object, depends of its own temperature to the fourth power.”
Also correct.
“energy is leaving the object.”
No, you’ve come off the rails now. Energy does not “leave” until it has a temperature difference against which it can perform “work”, like you said before. “Work” means “transfer of energy”, i.e. “energy leaving”.
Objects emit radiant energy depending on their temperature, but that is not the same as “energy leaving and being transferred to something else” – which implies one object getting colder and the other one getting warmer. This is very tricky for non-physicists to grasp, but it’s true. Remember that you yourself told us that work (energy transfer) requires a temperature difference. Don’t forget that, because it’s very important, and you already know it, so you don’t even have to learn it from scratch.
Think of it like this, if it helps: I can say to the world, out loud, “I am available to do work”. In other words, I am publicly “emitting” the “capacity to do work”. But of course, I’m not going to start doing actual work until you start paying me to do it. That’s what radiant energy is. It is “broadcasting the ability to do work, at the speed of light”. Nothing more.
Steve,
“Energy does not “leave” until it has a temperature difference against which it can perform “work”, like you said before. “Work” means “transfer of energy”, i.e. “energy leaving”
Any solid or liquid body loses energy when its temperature is above 0 K. Even with nothing in its neighborhood, thus nothing to do with “work” of another object. Only negative “work” on its own.
The amount of energy leaving the object only depends of its own temperature, not of the absence or presence of objects in its neighborhood or their temperature.
That is an absolute loss of energy for any object above 0 K.
The net transfer of energy depends of how much energy is lost by some object and how much it receives from other objects. That depends of their resp. temperatures to the fourth power. Thus a warmer object receives less energy from a colder than reverse, giving a net energy transfer from a warmer to a colder object.
The difference in opinion is about absolute radiant energy transfer between two separated bodies, which is measurable and calculatable and net energy transfer…
“Any solid or liquid body loses energy when its temperature is above 0 K”
No it doesn’t. This is pure baloney. Sit down, Ferdinand. This is not your field of expertise.
“Any solid or liquid body loses energy when its temperature is above 0 K”
Let’s see what ChatGPT has to say about this baloney:
Steve I don’t know which ChatGPT you asked that question, but here a far more complete answer to a more complete question:
Any solid or liquid body loses energy when its temperature is above 0 K, is that true?
The answer:
Yes, that’s true! A solid or liquid body will generally lose energy if its temperature is above 0 K, as long as there is a temperature difference between it and its surroundings. This energy loss can occur through several mechanisms, such as radiation, conduction, or convection, depending on the environment.
At absolute zero (0 K), the object would theoretically have no thermal energy and would not lose or gain energy. However, since absolute zero is unattainable in practice, objects above 0 K will always experience some form of energy loss when exposed to a cooler environment.
For radiation, the answer is clear: the energy lost by any object, no matter what is in the neighborhood, is proportional to its own temperature to the fourth power.
If there is another object in the surroundings, then the net transfer of energy depends of the difference temperatures.
And another one on my question:
“What is the energy loss for any object in space?”
Radiation: An object in space loses energy by emitting electromagnetic radiation, primarily in the form of infrared radiation due to its temperature. All objects, regardless of temperature, emit radiation according to their temperature and the Stefan-Boltzmann law. For instance, a hot object will radiate more energy than a cold one. This energy loss is continuous unless the object is actively absorbing radiation from another source (such as the Sun).
——–
Every object in space loses energy… according to their temperature…
“Radiation: An object in space loses energy by emitting electromagnetic radiation”
No it doesn’t. Not unless it is warmer than its surroundings. Just like you wrote above. Don’t forget to include the temperature difference in all your statements about energy gain or loss.
This illustrates your complete misunderstanding of the subject. The temperature of an excited CO2 molecule is not the average temperature of the surrounding atmosphere. It is the vibrational temperature of the excited state, in the case of a vibrationally excited CO2 molecule ~1000K.
Temperature is translational kinetic energy, Phil.
One can make the calculation, but I’m not sure what that temperature means.
No. In physics, translational temperature refers to the average kinetic energy of particles moving through space, while rotational temperature describes the average kinetic energy of molecules rotating, and vibrational temperature relates to the average kinetic energy of atoms vibrating within a molecule. When a molecule is in equilibrium with its surroundings they’re all the same, however when a CO2 molecule is vibrationally excited the vibrational temperature is much higher than the others. That’s where Steve gets it wrong he doesn’t understand that the emission of the photon is effectively from a much hotter source than its surroundings.
Got it, thanks.
Ferdinand, just guessing here, but I suspect the problem Steve had with your comment is that you were very vague about the surroundings of your 0K example.
I’d guess mostly this bit, “nothing in its neighborhood, … etc.”
An object at 2.7 K temperature, even if isolated and suspended in a vacuum, e.g., an atom isolated in interstellar space, is in radiant equilibrium with the surrounding isothermal vacuum.
No work can be done, but the radiant equilibrium is dynamic.
When ChatGPT presented this, “as long as there is a temperature difference between it and its surroundings.” it qualified its statement in an explicit way that is absent from your comment.
Something to keep in mind is that photons are identical (Wheeler thought there’s only one). One cannot distinguish among them, except by energy (i.e., X-rays or IR).
In an isothermal object pair, it’s impossible to say that photons have left one and arrived at the other, because there’s no change of state in either one.
One can’t demonstrate that a different suite of photons occupies one of the objects after some time has passed.
Finally, apologies, but this statement, “The amount of energy leaving the object only depends of its own temperature, not of the absence or presence of objects in its neighborhood or their temperature.” is not correctly formulated.
The way you described the system, i,e., “energy leaving the object” sounds as though the energy state of the object were diminishing. But it’s not.
When an object is in equilibrium with its surroundings, its energy state is constant. No energy is leaving. No work is done.
Given a dynamic radiative equilibrium, an object is radiating energy and absorbing an equal amount of radiative energy. Its energy state is constant. No change is detectable. It may be possible to measure the equilibrium radiant intensity, but that is constant everywhere.
Steve is very careful with his language when specifying physics. One should be likewise careful in a discussion.
Steve & Kevin, if you’re still around, please take a look at Harde & Schnell “Verification of the Greenhouse Effect in the Laboratory” (pdf)
It seems to show that if one sets up an experiment to produce radiative forcing, one can find radiative forcing.
I’m not surprised that they found two-way radiant heat transfer between two plates 1.1 meter apart. However, one problem is that they set up the experiment to eliminate convection, which I understand is one of the requirements for Schwarzschild’s model of radiative heat transfer to be applicable to tropospheric heat transfer.
However, although they are steadfast in their support of Schwarzschild’s model of radiant transport, they maintain that adding additional IR active gases to the atmosphere poses absolutely no threat to the climate, which I presume is why this paper hasn’t been widely touted by alarmists.
“I’m not surprised that they found two-way radiant heat transfer between two plates 1.1 meter apart”
No they didn’t. In their apparatus, energy only flows from hotter sources to colder sinks in all cases, as required by the 2nd Law. “Heat” is defined as “energy transfer”, therefore there is no such thing as “bidirectional heat”. Not for them, and not for anyone else either. The closest they got to correct physics is their observation that if the surroundings (gas) warm up, the rate of energy loss from their hot plate is reduced. They measured this as a reduced amount of energy input required to keep the hot plate at a specified temperature.
I came by just to pick up a couple of thoughts for an addendum I am putting together and happened to see this. The paper, at 33 pages length, will take a bit of time to absorb, and hopefully I can reconnect with you later.
I wouldn’t bother, Kevin, it’s only going to confuse you, not enlighten, and you are way too confused about physics as it is…
I finished the addendum and sent it to Charles; so I started this paper.
I have reached page 10, and their apparatus looks pretty good. They have avoided nearly all of the problems with the Seim&Olson apparatus which I discussed on this post: https://wattsupwiththat.com/2021/04/18/review-of-seim-and-olsen-paper/
They even recognize that they are dealing with Radiosity although they do not use the word. Yet they discuss the repeated reflections the stainless tank enclosing the guts of the setup will cause, which is radiosity…
I am not convinced yet that they will excite the gas in quite the manner of the atmosphere.
That paper is making the same false assumptions that Kevin makes, which is that objects can somehow emit “power” without regard to their environment.
For example, they made this claim: “Compared to the total radiated intensity of the cold plate with Ic = 266 W/m^2”
But nowhere in their apparatus is 266 W/m^2 being developed from one surface to another. They never measured any such thing. That’s fictional.
They are trying to avoid having to abide by the 2nd Law by using a 150-year-old usage of the word “heat” from Clausius: “the simultaneous double heat exchange by radiation”. The word “heat” in modern usage does not mean the same thing Clausius used it for. Nowadays it means “energy transfer”, and that is a synonym for “work” in this context, and naturally two objects cannot both perform “work” upon each other at the same time. That’s nonsense.
This paper is fundamentally an attempt to get around the laws of physics by introducing extra sources of heating and cooling into a system of two objects separated by various gases. They claim the cooler plate can increase the temperature of the warmer one in the presence of CO2, but it’s not the cooler gas that’s increasing the temperature of the warmer plate – it’s their external heating element that’s doing that. I would call that very disingenuous on their part.
Pat, my problem with Steve is that he confuses net energy transfer (“power”) with absolute energy transfer.
The problem is somewhere in the definitions, as net energy transfer in conduction is:
P = σA (T1^4 – T2^4)
That means that energy only is transferred, thus giving power, when there is a difference in temperature between two objects that are contacting each other.
For objects at a distance in empty space one must use the split formula:
P = σA (T1^4) – σA (T2^4)
or
P = P1 – P2
Because there is no direct contact between the two objects and all energy transfer is by radiation.
My point is that the radiation of energy (“power” loss) P1 of object one is independent of the presence or absence of object two and only depends of its own temperature T1. Not of the presence or absence or the temperature of object two.
The same is true for object two.
The net transfer of energy between the two objects then is P = P1 – P2.
If P1 = P2, there is no net transfer of energy and thus no net power loss or gain of the any of the two objects. Still there is a lot of energy transfer between the two objects, but that is equal in both directions. That is a dynamic equilibrium of radiation in two directions, compared to a static equilibrium for conduction.
That fulfills all physical laws. Energy is conserved and no energy is lost or created.
And the AERI instruments measure absolute down-welling radiation by transferring photons to electrons to a change in resistance of an LDR sensor and calculating that backwards to incoming total photon energy, compared to two black bodies at different temperatures for the same wavelengths. Without any influence of the temperature of the sensor on the calculation.
“net energy transfer”
Who taught you that? There’s no such thing. Either you have energy transfer, or you don’t. There’s no “net” or “gross”.
“For objects at a distance in empty space one must use the split formula:
P = σA (T1^4) – σA (T2^4)”
Who taught you that? What difference do you think it makes physically to split the terms apart mathematically? The two formulae are exactly the same. You are making no sense at all, Ferdinand. At least not in English. Maybe you make more sense in Dutch… maybe all your confusions are just translation errors…
OK, this is my last reaction, as you obviously don’t understand the difference between conduction and radiation.
For conduction, the first formula:
P = σA (T1^4 – T2^4) can be used, as that is physically ánd mathematically true.
For radiation, that formula still is mathematically true, but physically wrong, as there is no direct contact between the objects. Thus one must use the split formula:
P = σA (T1^4) – σA (T2^4)
The first object radiates energy in direct ratio to its own temperature T1 to the fourth power. No matter the presence or absence of another object in its neighborhood at any temperature.
The second object radiates its energy in direct ratio to its own temperature T2 to the fourth power.
That is what happens physically: each object loses energy (thus power), depending of its own temperature above zero K, no matter the absence or presence of other objects in its surroundings. That is an absolute loss of energy, thus loss of power: the object cools down.
The net transfer is a matter of making the sum of all incoming and outgoing energy and that gives a net loss or gain of power of an object.
If T1 = T2, then there is no net loss of energy, thus both objects send and receive the same amount of radiant energy and nothing happens with both temperatures: there is no net transfer of energy, still there is a lot of radiant energy emitted, but equal in both directions.
Or the difference between a static transfer (conduction) and a dynamic transfer of energy (radiation).
Nothing to do with language or translation, just physics…
“you obviously don’t understand the difference between conduction and radiation.”
Who taught you that there was a difference, when it comes to the 2nd law of thermodynamics? You are spouting baloney. Maybe try speaking in Dutch, maybe you make more sense in your own language…
“static transfer (conduction) and a dynamic transfer of energy (radiation)”
Rubbish, Ferdinand. Sit down.
Good clarification, Pat. I’m trying hard but I’m not getting through to Ferdinand 🙂
“as long as there is a temperature difference”
This is the part I’ve been trying to teach you, and you keep ignoring it. Pay attention, Ferdinand. You are contradicting yourself again.
Not at all: net zero energy transfer doesn’t imply that there is zero transfer of radiant energy between two objects, it only implies that the amount of radiant energy transferred is equal in both directions…
And still not convinced that the AERI device does measure absolute incoming energy, not relative to the temperature of the sensor?
“net zero energy transfer”
Rubbish.
“And still not convinced that the AERI device does measure absolute incoming energy, not relative to the temperature of the sensor?”
Why don’t you try to operate an AERI device at room temperature and see what measurement you get?
“‘How well do we know the underlying physics?’ – My guess is not very well at all.”
That part is correct.
“I would like to refer you to Willis Eschenbach’s post ‘Rainergy’”
Unfortunately Willis doesn’t know his physics either. If you think you are going to learn radiation physics from a fisherman, I have news for you. Why don’t you ask Willis what he thinks “radiation” means? Because he has no clue.
Sorry, the question addressed in Willis’ post is not about radiation physics, but rather evaporative cooling. The domain is chemical engineering.
It is not a chemical engineering post. It is a radiative physics post, as I said, one of many, and he got it wrong, as always. You can tell it is about radiative physics because he wrote these statements in it: “warming by increased downwelling longwave radiation”, as well as “The current central paradigm of mainstream climate science is that the change in global temperature is a lagged linear function of the change in total downwelling solar and longwave (thermal) radiation.”
The “downwelling longwave radiant [power]” part is fictional, of course, but you are never going to learn that from Willis. He has no clue.
Steve, the “downwelling longwave radiant [power]” part is alive and kicking… Measured at a lot of stations and especially with the AERI method, which counts photons, not a direct energy/temperature measurement, but far more detailed and accurate than any other type of measurement available.
I have the impression that your knowledge of IR instruments is not up to date…
Ferdinand, AERI devices do not count individual photons. Who told you that they did? That would require the use of photomultipliers, which are not part of these instruments, and not necessary. (Also those would require extra energy to be added in order to function properly.) Instead, the AERI meters use liquid nitrogen cooled MCT and InSb radiometers to measure aggregate incoming radiant power, in different spectral bands, much like thermopiles do. (Of course you don’t understand those either.)
No, I am not the one who doesn’t understand how these measurement instruments work. You are the one who had no idea that AERI devices were liquid nitrogen cooled to begin with, and nor do you have any idea how IR thermometers work. Since you are obviously extremely poorly informed about all of this, and can’t back any of your false statements up, maybe you should make fewer obviously-false statements and ask more intelligent questions instead?
Steve, the AERI detector counts total incoming photons line by line over the spectrum of interest. Not one by one (even that is possible nowadays), but they measure the electrons that were pushed over the two-layer barrier by the incoming photons, thus reducing the resistance of the receiving layer. The change in resistance is measured and back calculated towards incoming energy from the photons by comparing that to two built-in black bodies at different temperatures. Here for the sensor:
https://www.teledynejudson.com/products/photoconductive-mercury-cadmium-telluride-detectors
Thus please refrain from assuming that I don’t know where I am talking about, I have worked with electronics for over 50 years…
‘Steve, the AERI detector counts total incoming photons”
No it doesn’t.
“Not one by one”
That’s what I said. But it’s not what you said, which was: “which counts photons”
How do you think it can “count photons” if not “one by one”? You are very confused. How do you yourself count things? Do you count them all at once, or one by one?
“measure the electrons”
Not one by one, though.
“The change in resistance”
This is a function of work being done. That depends on a temperature difference, as you said yourself. If your sensor is the same temperature as the target, no work will be done, and no change in resistance will be measured.
You may know your electronics, but you don’t know the first thing about physics. Not yet. Not until you can explain why you said that work depends on temperature differences, but power somehow doesn’t.
Steve, again, the sensor in the AERI instrument count the total number of photons, not the energy content of these photons. The semi-conductor’s temperature plays zero role in that process, except for reducing the noise and enhancing its sensitivity.
All photo sensitive semiconductors that work at ambient temperature: (IR) camera’s, LDR’s, photo transistors/diodes, react on total amount of incoming (IR) photons, thus absolute incoming energy, no matter the temperature of the semiconductor itself. Thus not on the energy difference between sender and sensor.
And work or power in my language (Dutch) means the same. Transfer of energy is work/power, thus down-welling photons absorbed by the earth’s surface do “work”, completely independent of the temperature of their origin or destination.
“count the total number of photons”
No it doesn’t.
“work or power in my language (Dutch) means the same”
Well, I don’t know Dutch, but in English, they are different. Maybe you need to learn English better, followed by some actual physics.
Steve, you are much better in physics than I ever will be, but you are completely mistaken by how the AERI sensor works.
The sensor is a semi-conductor which is made of two layers. The layers provide an electrical barrier (of around 1 V) between the layers.
If a photon of sufficient energy hits the upper layer, it can push an electron over the barrier. That is what is measured as a drop in resistance of the second layer.
The drop in resistance is directly proportional to the number of photons that hit the sensor.
The temperature of the sensor has nothing to do with the number of electrons pushed over the barrier and only plays a role in reduction of the “noise”: IR radiation of the instrument itself. “black currents” of resistance changes with temperature, electrons going over the barrier without photons hitting the sensor or in opposite direction, etc.
As far as I have read in the manuals, all photons that hit the sensor in the observed narrow wavelength bands have sufficient energy to push electrons to pass the barrier. Independent of the temperature of the sensor.
Thus what is measured as a resistance drop is in ratio to the total number of photons reaching the sensor for each wavelength of interest, not the energy content of these photons. The temperature of the sensor plays zero role in that context.
“The temperature of the sensor […] only plays a role in reduction of the “noise””
Somebody told you that, and you fell for it, because you don’t know anything about physics. You need a temperature difference to do useful work, which includes generating voltage or current with a photodiode. You told us this yourself, remember?
Here’s an experiment you can try, Ferdinand: take one of these photodiodes and place it in an environment that is in equilibrium, with no extra energy sources. (If you are working with an InSb photodiode like the ones in AERI, sensitive to longwave infrared photons, then the environment will need to be dark. Alternately, if you are working with a solar cell, which is sensitive to visible light photons, then the entire environment including the photodiode needs to be at around 5000 K or more – this may be a bit rough on the photodiode, and you, so beware)
Then see how much voltage or current you get out of it. If the answer is greater than 0, I will believe you, but something will be wrong with the 2nd law of thermodynamics. Until you try that, you are just spouting nonsense. At least, in English it is nonsense… maybe it makes more sense in Dutch…
Steve, as already said many times, you have no idea of how a photo diode/transistor/resistance works.
A photon is a dedicated package of energy. It doesn’t contain any information about the temperature of the object where it originates.
It may have started from a CO2 molecule at – 80°C high in the stratosphere or from CO2 at +50 in the desert air at 2 meter high or from hydrogen in the sun at 6.000°C.
If such a photon hits a solar cell, it may push an electron over the electrical barrier between the two layer of the sensor.
For photocells, that is about 1 electron for 5 photons that hit the surface with sufficient energy (20% yield). Nothing to do with the temperature of the solar cells, only with the minimum energy content of the photon that must be high enough to push the electron over the barrier.
The rest of the incoming radiation is heating up the solar cells, reducing the yield. Not because the difference between 20°C and 80°C of the cells does make any significant difference for solar energy originating from hot gases at 6000°C, but the energy leak by random free electrons increases:
https://www.solarnplus.com/how-temperature-impacts-solar-cell-efficiency/
For the AERI sensor that probably is one electron for each photon hitting the surface. Not even of importance: even if it was 1:10 or 10:1, as long as the ratio electrons to photons is fixed for a given wavelength, the device measures the total number of electrons pushed over the barrier, thus the total number of photons hitting the sensor, no matter its own temperature.
It doesn’t measure the energy of the incoming photons, it measures the number of hits. Its own temperature plays zero role in that count, except by minimizing false readings.
The AERI sensor thus measures absolute incoming radiant IR energy in specific wavelengths, not relative to its own temperature.
From the above link to the influence of temperature on solar cells:
“This means that at 25°C above the ideal operating temperature, the cell’s efficiency could drop by 10-12.5%.”
The solar cells have their maximum yield around 25°C, thus the impact of temperature on the cell’s performance by the change in temperature of the cells themselves gets:
P(298 K) = σA (6273 – 298) ^4 for the “ideal” solar cells performance.
P(323 K) = σA (6273 – 323) ^4 for an observed drop of 10-12.5% in performance.
According to the difference in temperature of the solar cells, the power drop should be not more than 1.7% if the change in temperature of the cells themselves was the main cause…
“The solar cells have their maximum yield around 25°C,”
Yes, and the source of light that generates their photocurrent is around 5000 C (or K, doesn’t make much difference). This is an important observation. You swept it under the rug, though, didn’t you?
If you don’t understand that for solar cells it doesn’t matter if a photon in the visible light wavelengths comes from the sun at 5000°C or from a LED light at 40°C, then you have no idea where you are talking about.
Farmers in Spain were generating electricity from their solar cell fields at night, by a generator and LED spots, earning (stealing) a lot of subsidy money from the state…
“A photon is a dedicated package of energy”
Yes. Therefore it contains the ability to do work. Work requires a temperature difference, as you told us several times now.
A photon doesn’t contain any information about the temperature of the object where it was generated. Is that so difficult to understand?
It always will add its energy to the object where it is absorbed, no matter the temperature of the object where it originates or the temperature of the object where it is absorbed.
If that will give a change in total energy (called “temperature”) of the object where it is absorbed, depends of the sum of all incoming and outgoing energy of that object. Including its own loss of energy caused by its own temperature.
And a dynamic equilibrium of two equal streams of energy by two objects at the same temperature doesn’t violate any physical law.
That is where it goes wrong in your reasoning: radiation takes place in any direction, only depending on an object’s own temperature, no matter the presence or absence of other objects in the neighborhood or their temperature.
Then there is the Eschenbach Effect, that the Earth’s climate is controlled by thunderstorms in the Intertropical Convergence Zone.
I happened to experience a double-blind confirmation of this Effect one afternoon on a November day in Aussieland just south of Darwin. The clouds piled up in the afternoon and all of a sudden the heavens opened and the temperature dropped by 20 degrees. More research is needed.
Part 1 (Apparently my complete comment is too long.)
Outside of the “atmospheric window” where the radiation escapes directly to space, there is NO PATH for radiation from the surface to get to space. The Planck radiation field generated by the surface is completely annihilated via absorption by IR active species, primarily water vapor and CO2, which are immediately thermalized completing the conversion of the surface generated field into sensible heat. This is not controversial.
The primary radiation field in the atmosphere is self-generated by collisions. The energy for these collisions is maintained by the sensible heat from thermalization and direct conduction from the surface. This sensible heat also drives convection. The self-generated field is radiatively independent of the surface radiation.
Within this self-generated field, there is a balance of collision excitation (aka “reverse thermalization), collisional de-excitation (aka “thermalization”), absorption, and spontaneous emission.
Until conditions allow some of the radiation to escape this field, there is a continuous exchange of energy at the molecular level but no net change of energy or energy transport. The intensity of the field decreases with altitude due to energy lass from convecting parcels. The intensity and spectral content of the field is a function of temperature, pressure, and atmospheric composition, and one can observe a spectrum of the random radiation field with a spectrometer pointed in any direction.
This field generated by collisions exists all the way down to the surface. This is the source of the “back radiation” that is observed. It is the downward component of the isotropic, random, self-generated field.
The surface of the Earth is in convective “balance” with the troposphere. Outside of the atmospheric window, as a practical matter, no surface radiation escapes to space. All of the radiation that escapes to space is generated by collisions.
Convection transports this energy via global circulation. There is no reason to expect “radiative equilibrium” in any single atmospheric column as modeled in the one-dimensional plane-parallel models commonly used to demonstrate this phenomenon.
Schwarzschild himself recognized that the Earth’s atmosphere is dominated by convection. For those that have not read his paper, Andy May has posted a translation with the assistance of my colleague, Markus Ott. You can find it at:
https://andymaypetrophysicist.com/2025/02/15/schwarzschild-about-the-equilibrium-of-the-solar-atmosphere/?amp=1
The principle from Schwarzschild’s paper, cited at the beginning of the article, is a fundamental principle of radiative transfer theory. You can learn more about the evolution of radiative transfer theory and the radiative transfer equation by reading Curtis Mobley’s book “A Short History of Radiative Transfer Theory” published last year, available from Amazon here:
https://a.co/d/jcnVrmm
(I receive no benefit from this.)
Radiation to space occurs when the spontaneous emission rate from collisional excitation exceeds the rate of collisional de-excitation (thermalization). For water vapor this occurs in the troposphere over a wide range of altitudes, roughly 2.8 – 6.6 km as shown in Figure 17 by Harde (2013).
https://onlinelibrary.wiley.com/doi/10.1155/2013/503727
For CO2, emissions to space do not occur until ~83 km at the mesopause, and they are insignificant insofar as “energy balance” is concerned.
The presence of the tropopause is the indicator of the altitude where the radiation to space via water vapor is complete.
Other aspects of this are discussed in another article on Andy May’s site, “Energy and Matter”:
https://andymaypetrophysicist.com/2025/02/01/energy-and-matter/?amp=1
The Harde paper is quite good. Thanks much for that reference. Some of it is repeated independently and more recently by Happer and Wijngaarden, but Harde adds a few unique insights as well. He cleans up a few misconceptions, too.
Someone has come along and downvoted a few people for no good reason — vandals.
Thank you for the thoughtful comment, Kevin.
I think it’s important to note that Harde’s 2013 paper preceded van Wijngaarden and Happer’s (vW&H) 2020 paper on the five most important GHGs by over seven years. It was also published in a peer reviewed journal. To vW&H’s credit, Harde’s 2013 paper was cited in the references of their 2020 paper.
My reference to Harde in my comment was to his modeled spectrum of water vapor emission. Harde had important insights into the atmospheric processes, but made a fundamental error which others, including vW&H continue to make.
If you read Harde’s introduction carefully, in describing section 2 and section 3 he correctly describes “…the interaction of molecules with their own thermal background radiation under the influence of molecular collisions…”, and he distinguishes that background radiation from the Planck radiation field generated by the Earth’s surface, discussed in section 3.
In section 2, he does the complete derivation of Einstein’s “Theory of Quantum Radiation” (1917), where Einstein shows the relationship between the Maxwell-Boltzmann distribution of particle energies and the Planck distribution of the radiation generated by the radiatively active molecules.
Einstein recognized that these two distributions are intimately related by the factor exp(ε/kT), where ε=kinetic energy for the particles and ε=hν for the radiative quanta. Locally, the radiation field is in equilibrium with the energy distribution of the particles. It is also locally random and isotropic, meaning that it does not transport any energy. It is simply a continuous exchange of energy between the IR active molecules and the radiation field.
Because of this exp(ε/kT) relationship, the frequency distribution of this radiation field will have the shape of a Planck curve conforming to the local temperature and composition, i.e., the concentration of IR active species.
This is where the subtlety and choices made by modelers creates confusion. In the following, with reference to the Earth, we are discussing radiation outside the “atmospheric window”.
In radiative transfer theory, the quantity that is propagated through the atmosphere is spectral radiance, a volume element of “radiance” (which is not a fundamental physical quantity) which radiates uniformly in all directions according the Stefan-Boltzmann law and which exchanges radiation with neighboring volume elements according to Kirchhoff’s law. This was fine in Schwarzschild’s conjecture regarding the Sun’s radiative equilibrium because the Sun’s atmosphere is about four orders of magnitude less dense than ours, and the radiation field was assumed to be generated exclusively by absorption and emission. I’d suggest you read the translation of Schwarzschild’s 1906 paper, linked in my original post.
In the Earth’s atmosphere, the thermal radiation field is not generated by absorption and emission, but exclusively by collisions. Kirchhoff’s law no longer applies. The confusion arises because the radiative spectrum aligns with Kirchhoff’s law. The spectrum is the same as that produced by radiative transfer theory, but for different reasons.
Harde recognized this alignment, and decided that radiative transfer theory would produce the spectrum he was looking for and so ignored the difference. VW&H do the same, though they do not explicitly discuss this conundrum as Harde does.
The difference is important because Schwarzschild’s radiative equilibrium model is based on Schuster’s two-stream radiative transfer equation that balances “upwelling” and “downwelling” radiance in the solar atmosphere.
When applied to the Earth’s atmosphere, and applying the human imposed constraint of “radiative balance” in a single one-dimensional hypothetical atmospheric column free of convection, a “radiative imbalance” appears. It also creates the illusion that radiation propagates from the surface to the “emission altitude, which it does not. The emitted radiation is what escapes the thermal pool as described in my post. There is no mechanism for a “greenhouse effect.”
The reality, asserted and charted but not modeled by vW&H, is that all energy transport in the troposphere is via convection. When the nature of the radiation in the troposphere is properly understood, and convection which redistributes sensible heat across the globe is taken into account, there is no need for a GHE or “radiative forcing” to understand atmospheric dynamics, we simply don’t have the tools to model convection in detail.
Part 2 (Please read Part 1 below, first)
There is no physical mechanism whereby IR active molecules can inhibit the release of radiation to space. This is a concept that is an artifact of applying radiative transfer theory to a convecting atmosphere. This has been largely ignored, because the focus has always been on the absorptive properties of the molecules rather than the emissive properties. Excited molecules, by their nature, are driven to return to the ground state. This is why they cool the atmosphere.
The application of the radiative transfer equation to a convecting atmosphere is misguided and misleading. It creates the illusion of radiative transfer that is not occurring in the dense troposphere. It can duplicate the satellite spectrum but cannot provide a complete picture of energy transport. An explanation of that is beyond the scope of this comment, but careful reading of Mobley’s book referenced above as well as the summary papers of Michael Mishchenko referenced in that book make this clear.
As the Earth transitions from winter to summer and back, it experiences a change in total solar irradiance of ~+/- 90 Watts/m^2, or about 0.5 Watts/m^2-day. That’s 3.5 Watts/m^2-week. This does not create a catastrophe.
The climate is driven by the hydrologic cycle. The energy arrives from the sun at the speed of light, but the release of energy to the atmosphere and then to space is limited by the atmospheric speed limit of convection. The so called “greenhouse gases” are conduits that convert the Earth’s radiation to sensible heat at the surface, and then convert the stable heat to radiation in the middle and upper troposphere.
Typo in last sentence. “Stable heat” should be “sensible heat.”’
comments first appeared out of order, hence my notes at the beginning of each.
Thank you for providing this concise summary of what is obviously a large body of work. The ideas therein (Shula & Ott) certainly deserve to be made available to, and discussed by, much larger audiences than they have to date.
Tom, I’m trying to understand Harde, Figures 22 (a) & 22 (b).
I’m supposing that the measurements are looking up from the surface. So, the top of the Figures, showing ~130 mW/m^2/sr/cm^-1, reflect the power density at the surface.
Presumably, though, if the horizons were clear (at sea for example), one would get the same or similar radiant power profile pointing the radiometer in any direction, even near horizontal, so long as the aperture saw only sky.
If this is true, the observed radiant power is the isotropic thermal bath of the atmosphere at the surface, not necessarily arriving at the surface from emission at altitude.
If so, then, I am left to wonder why the radiant power of the CO2 band so uniquely intense.
Does the population of vibrationally excited CO2 produce some emission, in excess over and above the general thermal radiant background?
Does the intensity at 667 cm^-1 just reflect the localized emission by CO2*?
If so why is power spectrum so intense? After all, the collisional decay is some 29,000 times faster than emissive decay. Vibrationally excited CO2 should produce a negligible signature of radiant emission.
Also, if the radiometric observation is all just the isotropic radiant power of the surface K.E. thermal bath, then calling it “downwelling” radiation is a misnomer.
I may not be expressing this properly, so I hope you get the notion I’m trying to express and the questions I’m asking.
Thanks for any thoughts.
I spent half the night laying awake thinking on this problem.
The insight came when I realized that Harde Figure 22(a,b) is the inverse of Harde Figure 21(a,b).
The usual depiction of the terrestrial BB radiative emission as seen from space, with the CO2 notch and the H2O vapor valley, is visually misleading.
The CO2 and H2O vapor areas are not relatively bereft of emissive radiation. They are actually wavelengths where radiation is more intense because the emission height is greater. About 7 km for water vapor emission, and 13 km for CO2.
So, an emission spectrum versus height, instead of temperature, would show an altitude bump around 667 cm^-1 (CO2) and a hump around 1600 cm^-1 (H2O) — the inverse of the usual notch depiction.
This means the CO2 and water vapor bands are radiation-rich, compared to the other wavelengths where the atmosphere is transparent, because these molecules continuously absorb IR radiating up from the surface. A population of vibrationally excited molecules is retained, in local equilibrium with the IR radiation field.
That is, these two molecules are IR-pumped.
CO2 is also in energetic equilibrium with 288 K tropospheric kinetic energy field. A Boltzmann calculation yields an equilibrium fraction of about 3.6% of the CO2 is always vibrationally excited at 288 K..
425 ppmv of CO2 = 7.3E21 molecules/m^3 of which 2.6E20 are in a vibrationally excited state, equivalent to having absorbed a 15u photon.
Given 1/29,000 decay radiatively, every m^3 produces 9E15 ~15u photons/sec.
The 15u attenuation length of 425 ppm CO2 is about 9.3 m. So, 99.9995% of the 15u surface radiation is absorbed within 93 m.
99.9997% of that is offloaded into the K.E. of N2 and O, producing (with water vapor) the 288 K tropospheric K.E. field.
The general surface 288 K BB emission also has significant native intensity at 15 u. To this native 288 K BB spectrum, 425 ppm of CO2 adds 9E15 15u photons/sec/m^3.
This is what is detected by radiometer, even using a room temperature radiometer: the native 15u intensity of the 288 K BB radiation field plus the Boltzmann population 9E15 photons/sec/m^3 of 15u CO2 radiation.
This radiation is isotropic.
So, the CO2 radiant power spectrum is not downwelling back-radiation. It’s the total intensity of 15u radiation of the 288 K BB radiation field plus the 9E15 photons/sec/m^3, everywhere in the lower troposphere.
This combination produces the lower atmosphere background of isotropic CO2 667 cm^-1 radiation, which can be detected and is canonically interpreted as downwelling.
Wow, Frank. As I finally get around to responding to you, I’m impressed that you’ve figured so much of it out.
I’ll add a few comments, which you may already understand.
A well-collimated radiometer is a highly directional instrument with a limited field of view, and one cannot determine the total energy flow based on that measurement.
As Planck said, “Radiation of heat, however, is in itself entirely independent of the temperature of the medium through which it passes. It is possible, for example, to concentrate the solar rays at a focus by passing them through a converging lens of ice, the latter remaining at a constant temperature of 0C, and so to ignite an inflammable body. Generally speaking, radiation is a far more complicated phenomenon than conduction of heat. The reason for this is that the state of the radiation at a given instant and at a given point of the medium cannot be represented, as can the flow of heat by conduction, by a single vector (that is, a single directed quantity). All heat rays which at a given instant pass through the same point of the medium are perfectly independent of one another, and in order to specify completely the state of the radiation the intensity of radiation must be known in all the directions, infinite in number, which pass through the point in question; for this purpose two opposite directions must be considered as distinct, because the radiation in one of them is quite independent of the radiation in the other.” (Emphasis added)
In the upwelling spectrum, what you described as the CO2 “peak” is actually the sum of emissions of both CO2 and water vapor. The CO2 emissions are represented by the tiny central peak at 15 μm and the flat “wings” representing the rotovibrational sidebands. The spectrometer defects emission and while there is no net transport of energy the exchange between the molecules and the radiation field is quite furious in the dense troposphere and there is always radiation present. Water vapor accounts for the majority due to its abundance of bands, many at relatively low energies. Conversely, in the emission spectrum, the CO2 “notch” represents partial absorption of water vapor emissions by CO2. At that altitude the CO2 is immediately thermalized returning some of the sensible heat to the atmosphere. It will be transported by global circulation and weather and radiated to space in cooler regions. The CO2 emissions occur much higher in the atmosphere at the mesopause, ~83 km. They are represented by the tiny peak at the bottom of the “notch.”
The upwelling (from space) spectrum is not misleading, it has simply been misinterpreted. Of the radiation released to space almost all of it comes from water vapor. The area under the “notch” is emission of water vapor that was not absorbed by CO2.
Thanks for the added “number crunching” as well.
‘So, the CO2 radiant power spectrum is not downwelling back-radiation.’
Nice thought process. I feel like a day laborer in the orchard at the time Newton had his epiphany about falling apples.
Tom may weigh-in, but I am going to take the liberty of making a comment.
If the IR down welling radiation were truly isotropic at its point of emission, then at a receiver (radiometer) the radiation at zenith will still not look like the radiation just above the horizon for a number of reasons. 1) refraction, 2) the weighting of near and far contributions to the total irradiance will change. You can observe some of this if you look at Band 16 on the GEOS images, if you’ve never done so, the image looks bluer (colder) at low viewing angles because the radiometer is looking, on average, higher in the atmosphere.
There many little issues like this that complicate turning a radiant intensity or radiance (units of into a value of irradiance (
 ). MODTRAN just multiplies radiance by 3.14 (which is their version of Pi) just as though the arriving radiation is isotropic.
Low angles from the ground surface would oversample low elevations and would seem warmer than a higher viewing angle.
Interesting. Regarding the Band 16 images, I’ve taken a look at those as well as some of the adjacent bands and the production information. It seems to be a combination of atmospheric window and a minor CO2 peak with a dash of water vapor at 13.3 μm if I look at the HITRAN peak distribution.
The limb darkening you describe is highly reminiscent of the limb darkening of the image of the solar disk which prompted Schwarzschild’s investigation of radiative vs adiabatic equilibrium in the solar atmosphere. It occurs because as one approaches the periphery of the disk image looking from a distance, the radiant intensity is coming from more extreme oblique angles and is understandably diminished.
comparing this to what is happening near the surface is a case of “apples and oranges”. In the lower troposphere, there is no point source. As our bodies are being bombarded by 100 lbs of air molecules per square meter of surface area, they are also colliding with each other in a cacophony of exciting and de-exciting collisions that is producing the ubiquitous radiation field which surrounds everything.
If we place a radiometer in the field, we can only see the contributions that are in the direction of the limited field of view of the radiometer. With respect emission from GHGs, primarily CO2 and water vapor, the range of these emissions is limited to ~10 m at best. Scattered radiation from the atmospheric window die not have this range limitation.
This, again, is why using an IR thermometer you will read a higher “temperature” at a low elevation as compared to a higher elevation as you point out.
I agree with your point regarding the conversion of spectral intensity to radiance.
Tom, I have looked at Harde’s work and encountered a quite fundamental error already in the beginning:
“Like any matter at a given temperature, which is in unison with its surrounding, it is also a source of gray or blackbody radiation as part of the environmental thermal bath.”
Which is completely wrong. There is (near) zero thermal radiation from the atmosphere. Gases don’t make dipoles like is the case for solids and liquids, which induces thermal radiation. Only when they collide there is a probability of emitting thermal induced radiation, which gets more significant at higher temperatures, increased pressure or in plasma’s.
A nice definition of why there is very little thermal radiation in gases can be seen as first answer to a question about the difference in radiation between gases and solids:
https://physics.stackexchange.com/questions/222092/blackbody-or-characteristic-emission-of-radiation
Then your sentences:
“There is no physical mechanism whereby IR active molecules can inhibit the release of radiation to space.”
and
” Excited molecules, by their nature, are driven to return to the ground state. This is why they cool the atmosphere.”
Sorry, but the “excited molecules” only can emit energy to space, that was first captured by itself or from other excited molecules and transferred to “inert” molecules to vibrational energy by collisions and back.
No more energy can be transferred from these molecules to space than was absorbed first by similar molecules from the earth’s surface radiation, or one would see ever more cooling of the atmosphere, while we observe increasing air temperatures at every height in the troposphere.
Moreover, half the energy absorbed by GHGs and released directly or indirectly after collisions, is back to the surface, increasing the total energy input to the surface…
The radiation from half of 1/29,000 of the collisionally excited CO2 molecules.
99.999% energy from the surface via absorption towards collisions, 49.999% back to the surface from collisions to emissions, 49.999% from collisions to space.
Thus 50% of the outgoing energy is returned to the surface as back-radiation.
Relative decay rates tell us that only (1/29,000)*49.999% = 0.0017% is re-remitted toward the surface or toward the sky.
The rest is collisionally thermalized.
Depends of how fast the opposite, from collisions to radiation, occurs… What is the chance that a collision results in a radiation?
1 in 29,000.
Thank you for your patience as I have been responding to a number of comments.
I would take issue with Harde’s sloppy use of “black body” in that context, but there is a radiation field in the atmosphere that is self-generated and decoupled from the surface radiation as explained in my original post and in and earlier reply on this thread to Kevin Kilty.
I would refer you to that rather than rewriting it here. If you would like to continue the discussion reviewing that, I’ll get notified when you reply.
“Moreover, half the energy absorbed by GHGs and released directly or indirectly after collisions, is back to the surface, increasing the total energy input to the surface…”
NO ! 68% has more horizontal vector than downward vector.. much of the tiny amount of radiation will never reach the surface.
Not only that, but CO2 molecules will absorb a lot of that tiny amount (1:29000) of radiation on the way.
A standard upward face pyrgeometer reading (range some 25m) over the relevant band has a distinct dip in the CO2 band
Kevin, I believe this is a misstatement of the Clausius-Clapeyron relationship. What it should say is that the potential for an increase of 7% in the absolute humidity exists for for each degree increase in temperature. The two statements are essentially equivalent over much of the ocean surfaces, albeit a recent paper [ https://agupubs.onlinelibrary.wiley.com/doi/10.1029/2024GL114256 ] suggests that the potential isn’t achieved even over water unless there is sufficient wind to strip away the surface layer of air above the water that is saturated with water vapor.
However, the situation is different over land. Orographic uplift will cool an air mass moving with the prevailing winds and cause most of the water to precipitate out as it passes over the barrier. (It is generally accepted that water vapor, a condensing gas, typically precipitates out in about a week, regardless of the terrain.) As the now ‘dry’ air mass comes back down on the leeward side and heats from compression — the rain shadow region — the Clausius-Clapeyron relationship of your definition should cause the air mass to again become saturated. However, if there is little or no water vapor, it can’t happen. The air mass remains under-saturated. Therefore, much of the interior of large continents doesn’t follow your definition. The determining factor is the availability of water vapor from evaporation and transpiration, not the temperature. That is, the Clausius-Clapeyron relationship serves as an upper-bound on saturation, not the actual condition for the lower troposphere over land.
I know what you are saying, and I agree, but CC scaling has been a fundamental part of the panic for a long time now. At least we are in a position to use data to now point out that the changes in water vapor are well below CC scaling.
I have the feeling that people have misread what I write as being somehow factual, or what I think, rather than just paraphrasing a stance I plan to counter.
Kevin,
Belatedly, nicely said! Is it now time to go for the jugular – ALR and convective equilibria?
Looking forward to KIII.
Very nice Kevin, written clearly but the science and processes can be a bear to wrap a guys head around.
Low cloud cover follows the AMO envelope, with reduced low cloud during a warm AMO phase. The AMO is a negative feedback to indirect solar forcing, it is warmer when the solar wind is weaker, making the cloud feedback also negative.
Correlations of global sea surface temperatures with the solar wind speed:
https://www.sciencedirect.com/science/article/pii/S1364682616300360
Thanks for the reference.
Clouds and the AMO:
https://notrickszone.com/2025/01/29/nature-study-sunshine-hours-cloud-cover-in-europe-follow-atlantic-cycles-not-co2/
This thread is nearing 192 comments, and I may bail-out at this point to think about this discussion, read fully the references provided, and I gotta’ work on part III at some point. Plus an addendum to this essay is probably needed.
Thanks to all.
Thank you. Looking forward to Part 3 of the series!
Thanks, Kevin. The conversation has been terrific!