Geoff Sherrington.
There were 10 significant weather station/city sites explored for their heatwave properties in the first article of this series, 5 days ago.
Australian Heatwave Stories Cop Severe Criticism – Watts Up With That?
That first article shows 160 graphs of hottest heatwave temperatures over the years when records have been kept, for Adelaide, Alice Springs, Brisbane, Cape Leeuwin, Darwin, Hobart, Longreach, Melbourne, Sydney and Perth. This second article deals with some patterns of interest.
I wrote the articles because many Establishment sources make claims like this one from the Climate Council of Australia, 2014:
“Climate change is already increasing the intensity and frequency of heatwaves in Australia. Heatwaves are becoming hotter, lasting longer and occurring more often.”
HEATWAVES: HOTTER, LONGER, MORE OFTEN
An Internet search using “heatwaves longer hotter more often” returns these 6 hits and more.
Climate change study: Australia is in the crucible of slower, longer heatwaves | SBS News
Heatwaves: hotter, longer, more often – Macquarie University
Heatwaves: hotter, longer, more often – Environmental Health Australia (Western Australia) Inc
Australian heatwaves more frequent, hotter and longer: Climate Council report – ABC News
nationalacademies.org/based-on-science/global-warming-makes-heat-waves-hotter-longer-and-more-common
Heatwaves to be hotter, longer and more frequent, climate change report says – ABC News
HOTTER?
Using practically all years of data recorded, I examined each of 4 heatwave durations of 1, 3, 5 and 10 days. The raw data are from the Climate Data Online CDO source by the Bureau of Meteorology.
The first half of the heatwave numbers is compared to the last half. The first half numbers are subtracted from the second half numbers. If there is warming, the difference is positive. If there is cooling, the difference is negative.
This example summarises the method by a graph.

The first half average equals the second half average, so in this simple case no 5-day heatwave warming is shown for Adelaide.
These results summarise all 40 cases.
| ADELAIDE | DIFF LAST MINUS FIRST | |||||||
| FIRST HALF 1-DAY | 41.42 | SECOND HALF 1-DAY | 41.68 | 0.26 | ||||
| FIRST HALF 3-DAY | 39.14 | SECOND HALF 3-DAY | 39.19 | 0.06 | ||||
| FIRST HALF 5-DAY | 37.43 | SECOND HALF 5-DAY | 37.37 | -0.07 | ||||
| FIRST HALF 10-DAY | 34.57 | SECOND HALF 10-DAY | 34.54 | -0.03 | ||||
| ALICE SPRINGS | DIFF LAST MINUS FIRST | |||||||
| FIRST HALF 1-DAY | 43.08 | SECOND HALF 1-DAY | 42.94 | -0.15 | ||||
| FIRST HALF 3-DAY | 41.16 | SECOND HALF 3-DAY | 41.37 | 0.21 | ||||
| FIRST HALF 5-DAY | 40.22 | SECOND HALF 5-DAY | 40.54 | 0.32 | ||||
| FIRST HALF 10-DAY | 39.90 | SECOND HALF 10-DAY | 40.27 | 0.37 | ||||
| BRISBANE | DIFF LAST MINUS FIRST | |||||||
| FIRST HALF 1-DAY | 37.45 | SECOND HALF 1-DAY | 36.04 | -1.41 | ||||
| FIRST HALF 3-DAY | 34.08 | SECOND HALF 3-DAY | 32.77 | -1.32 | ||||
| FIRST HALF 5-DAY | 33.78 | SECOND HALF 5-DAY | 32.52 | -1.26 | ||||
| FIRST HALF 10-DAY | 32.42 | SECOND HALF 10-DAY | 31.43 | -1.00 | ||||
| C_LEEUWIN | DIFF LAST MINUS FIRST | |||||||
| FIRST HALF 1-DAY | 33.88 | SECOND HALF 1-DAY | 34.91 | 1.03 | ||||
| FIRST HALF 3-DAY | 28.92 | SECOND HALF 3-DAY | 30.07 | 1.15 | ||||
| FIRST HALF 5-DAY | 27.06 | SECOND HALF 5-DAY | 27.92 | 0.86 | ||||
| FIRST HALF 10-DAY | 25.32 | SECOND HALF 10-DAY | 25.99 | 0.67 | ||||
| DARWIN | DIFF LAST MINUS FIRST | |||||||
| FIRST HALF 1-DAY | 36.95 | SECOND HALF 1-DAY | 36.67 | -0.28 | ||||
| FIRST HALF 3-DAY | 35.97 | SECOND HALF 3-DAY | 35.64 | -0.33 | ||||
| FIRST HALF 5-DAY | 36.94 | SECOND HALF 5-DAY | 36.67 | -0.27 | ||||
| FIRST HALF 10-DAY | 35.12 | SECOND HALF 10-DAY | 34.66 | -0.46 | ||||
| HOBART | DIFF LAST MINUS FIRST | |||||||
| FIRST HALF 1-DAY | 34.86 | SECOND HALF 1-DAY | 36.49 | 1.62 | ||||
| FIRST HALF 3-DAY | 29.68 | SECOND HALF 3-DAY | 30.62 | 0.94 | ||||
| FIRST HALF 5-DAY | 27.15 | SECOND HALF 5-DAY | 28.04 | 0.89 | ||||
| FIRST HALF 10-DAY | 24.86 | SECOND HALF 10-DAY | 25.86 | 1.00 | ||||
| LONGREACH | DIFF LAST MINUS FIRST | |||||||
| FIRST HALF 1-DAY | 44.12 | SECOND HALF 1-DAY | 43.94 | -0.18 | ||||
| FIRST HALF 3-DAY | 43.18 | SECOND HALF 3-DAY | 42.85 | -0.33 | ||||
| FIRST HALF 5-DAY | 42.44 | SECOND HALF 5-DAY | 42.17 | -0.27 | ||||
| FIRST HALF 10-DAY | 41.33 | SECOND HALF 10-DAY | 41.13 | -0.20 | ||||
| MELBOURNE | DIFF LAST MINUS FIRST | |||||||
| FIRST HALF 1-DAY | 40.55 | SECOND HALF 1-DAY | 40.46 | -0.10 | ||||
| FIRST HALF 3-DAY | 36.58 | SECOND HALF 3-DAY | 36.93 | 0.35 | ||||
| FIRST HALF 5-DAY | 34.00 | SECOND HALF 5-DAY | 34.18 | 0.17 | ||||
| FIRST HALF 10-DAY | 30.69 | SECOND HALF 10-DAY | 30.99 | 0.30 | ||||
| PERTH | DIFF LAST MINUS FIRST | |||||||
| FIRST HALF 1-DAY | 40.58 | SECOND HALF 1-DAY | 42.40 | 1.82 | ||||
| FIRST HALF 3-DAY | 37.90 | SECOND HALF 3-DAY | 40.17 | 2.27 | ||||
| FIRST HALF 5-DAY | 36.38 | SECOND HALF 5-DAY | 38.65 | 2.28 | ||||
| FIRST HALF 10-DAY | 34.01 | SECOND HALF 10-DAY | 36.41 | 2.40 | ||||
| SYDNEY | DIFF LAST MINUS FIRST | |||||||
| FIRST HALF 1-DAY | 38.02 | SECOND HALF 1-DAY | 38.62 | 0.60 | ||||
| FIRST HALF 3-DAY | 32.68 | SECOND HALF 3-DAY | 33.32 | 0.64 | ||||
| FIRST HALF 5-DAY | 30.72 | SECOND HALF 5-DAY | 31.35 | 0.63 | ||||
| FIRST HALF 10-DAY | 28.78 | SECOND HALF 10-DAY | 29.53 | 0.75 | ||||
| GRAND AV | 0.35 | |||||||
| POSITIVES | 24.00 | |||||||
| NEGATIVES | 16.00 | |||||||
The naïve interpretation is that overall, if there is evidence of heatwaves getting hotter, it is small. 40% of cases show cooling, 60 % show warming. The overall warming is about 0.35 ͦC, which is of similar size to the uncertainty of the numbers.
In scientific experiments, it is often the case that a simple first look will either encourage or discourage further investigation. Here, there is little enthusiasm to look further. The pattern is not indicative of future health problems, for example.
Those familiar with time series numbers such as these will question the data quality. As I noted in my first article,
NOTE 1: Many of these stations underwent a site shift, many in the middle of the study period, typically from a Post Office to an Airport. This has affected the distribution over time of these hottest heatwaves. There is no reliable method to adjust this by a single step change because the magnitude of such a step is not now knowable.
A conclusion is that those who seek to show heatwaves getting hotter need to ask how to combat these simple contrary results without the use of subjective adjustments that typically lead to disagreement about methods, motives and manipulations.
Why not accept that there is next to no simple evidence of Australian heatwaves getting hotter and leave it at that?
LONGER?
I took the Top 40 heatwave numbers for all 10 cities, CDO not ACORN-SAT, to examine 1-Day, 3-Day, 5-Day and 10-Day heatwave patterns.
In theory, if the longer 10-Day heatwave types were increasing compared to 1-Day or 3-Day, then counts of various heatwave numbers should show this. I also examined the number of days in the first half of the station history versus the last half of the total years. Adelaide, the first station examined in this way, met the change point in 1956.
| HEATWAVE | 1ST PART | 2ND PART | ||
| DAY-LENGTH | # of DAYS | # of DAYS | ||
| ADELAIDE | 1 | 19 | 21 | |
| 3 | 20 | 20 | ||
| 5 | 20 | 20 | ||
| 10 | 20 | 20 | ||
This example shows that first, the number of Top 40 heatwaves in the first part of the observations is about the same as in the second half. Second, the table shows similar counts for heatwaves of all durations, so the longer 10-Day types were not increasing compared to 1-Day etc, so the inference is that these Adelaide heatwaves were not becoming longer. (The Top 40 selection is used because if all years were examined, the split would always be equal and could not show anything of interest.)
Not all stations trend the same as Adelaide.
PERTH
| HEATWAVE | 1ST PART | 2ND PART | ||||
| DAY-LENGTH | # of DAYS | # of DAYS | ||||
| 1 | 8 | 32 | ||||
| 3 | 5 | 35 | ||||
| 5 | 6 | 34 | ||||
| 10 | 5 | 35 | ||||
Perth indicates that while the “hotter” heatwaves were more abundant in later years, the share of longer heatwaves remains much the same as shorter ones.
Here is the complete table of all ten stations. I have added the average temperature of each subset, which is a check on paperwork but does not add to understanding because the differences are so small.
| HEATWAVE | 1ST PART | 2ND PART | Average T | Average T | ||
| DAY-LENGTH | # of WAVES | # of WAVES | First Part | Second Part | HALF WAY YEAR | |
| ADELAIDE | 1 | 19 | 21 | 43.37 | 43.73 | 1956 |
| 3 | 20 | 20 | 41.61 | 41.69 | ||
| 5 | 20 | 20 | 40.4 | 39.97 | ||
| 10 | 20 | 20 | 37.24 | 37.05 | ||
| ALICE SPRINGS | 1 | 26 | 14 | 44.99 | 44.61 | 1952 |
| 3 | 23 | 17 | 43.08 | 42.96 | ||
| 5 | 22 | 18 | 42.28 | 42.07 | ||
| 10 | 21 | 19 | 41.95 | 41.85 | ||
| BRISBANE | 1 | 24 | 16 | 39.79 | 39.4 | 1956 |
| 3 | 30 | 10 | 35.47 | 35.1 | ||
| 5 | 31 | 9 | 35.04 | 34.88 | ||
| 10 | 30 | 10 | 33.48 | 33.28 | ||
| C LEEUWIN | 1 | 17 | 23 | 37.3 | 37.43 | 1966 |
| 3 | 13 | 27 | 32.03 | 32.1 | ||
| 5 | 14 | 26 | 29.35 | 29.42 | ||
| 10 | 15 | 25 | 27.05 | 26.98 | ||
| DARWIN | 1 | 27 | 13 | 37.97 | 37.77 | 1955 |
| 3 | 27 | 13 | 36.86 | 36.57 | ||
| 5 | 26 | 14 | 37.98 | 37.72 | ||
| 10 | 31 | 9 | 35.83 | 35.55 | ||
| HOBART | 1 | 15 | 25 | 38.17 | 38.74 | 1971 |
| 3 | 20 | 20 | 32.78 | 33.66 | ||
| 5 | 14 | 26 | 29.72 | 29.44 | ||
| 10 | 17 | 23 | 27.87 | 27.39 | ||
| LONGREACH | 1 | 24 | 16 | 45.74 | 45.82 | 1961 |
| 3 | 26 | 14 | 44.77 | 44.54 | ||
| 5 | 24 | 16 | 44.1 | 43.83 | ||
| 10 | 21 | 19 | 42.81 | 42.64 | ||
| MELBOURNE | 1 | 22 | 19 | 43.4 | 43.51 | 1941 |
| 3 | 19 | 21 | 39.84 | 39.78 | ||
| 5 | 21 | 19 | 37.6 | 37.23 | ||
| 10 | 19 | 21 | 33.18 | 33.6 | ||
| PERTH | 1 | 8 | 32 | 43.08 | 43.57 | 1961 |
| 3 | 5 | 35 | 41.49 | 41.39 | ||
| 5 | 6 | 34 | 39.79 | 39.94 | ||
| 10 | 5 | 35 | 37.81 | 37.39 | ||
| SYDNEY | 1 | 16 | 24 | 41.21 | 41.53 | 1942 |
| 3 | 14 | 28 | 35.87 | 35.65 | ||
| 5 | 13 | 27 | 33.48 | 33.3 | ||
| 10 | 12 | 28 | 30.89 | 31.01 | ||
| AVERAGE | 19.425 | 20.65 |
The conclusion is that by this method of analysis, there is no indication that heatwaves are becoming longer.
NOTE: This analysis used essentially all of the raw time and temperature data available. Different conclusions are possible if some adjustments are used. For example, if only data from the last 40 years is used, there might be an indication of heatwaves becoming longer. (I have not tested this).
Alternatively, a different conclusion might be reached if adjusted ACORN-SAT temperatures were used. However, these approaches open the gate to cherry picking, selective argument and subjective changes that have to date been a major cause of disagreement between groups of investigators.
MORE FREQUENT?
The data base that I have constructed produces the year in which a putative heatwave happened and the highest average maximum temperature it reached over 1, 3, 5 and 10 consecutive days. It does not sort the number or intensity of more than one heatwave each year, intense enough to be counted among competitors from other years.
Software to detect more than one heatwave a year is complex and it is dependent on the definition of a heatwave. Different countries use different definitions of “heatwave”. Some definitions are precise enough to allow computing, others are vague and can be flexibly adjusted to suit an outcome. Also, questions arise, for example, should one infill a prospective significant 10-day heatwave that has a missing value in the centre? Infill with what temperature? And, when is a 10-Day heatwave better treated as two adjacent 5-Day heatwaves?
It is possible to crawl manually through the 50,000 or so days for each of these 10 stations to detect the stronger heatwaves apart from the primary one that is there because others in the same year are excluded by the “remove duplicates” function on Excel applied to all years examined in a sorting from highest heatwave temperature to lowest. I have examined the tedium required and rejected that option.
Maybe Artificial Intelligence can provide a workable solution. Over to you, readers.
However, I know of no literature that counts the number of heatwaves over time in a manner that concludes that they are becoming more frequent. Links welcomed from readers.
DISCUSSION:
To the extent that these 10 weather station localities can represent Australian climate features, there is little to no evidence in this analysis with its limitations, that heatwaves are becoming hotter or longer with more analysis required about “more frequent”.
There is little comparable scientific literature in conflict with this conclusion. Many cited studies commence after 1950; many invoke convoluted definitions of heatwave; and many seem affected by a wrong piece of logic.
The wrong logic. There is general scientific acceptance that global temperatures have increased by 1 to 1.5 ͦ C in the last 120 years or so. Many publications contain the assertion or assumption that this temperature increase has also underlined the heatwave maximum temperature pattern, expecting it to show a similar increase. It does not, in the data studied here. The conduct of heatwaves differs from the conduct of general temperature observations. In the case of these 10 Australian stations, there is essentially no change over time demonstrated in the maximum average heatwave temperatures reached.
Remember that sea surface temperatures seldom exceed 30 ͦC . There is a mechanism of convective instability that creates an upper limit. While no mechanism appears to have been advanced for an upper limit on heatwave temperatures over land, it should not be discounted from future research.
Further, there is a widespread theme in the literature that the heatwave is an event related to the location at which it happens. The heatwave patterns of coastal Adelaide and Melbourne are strongly influenced by Hadley cells that cause hot winds from central Australia to move to the South and South-East towards the coastal cities, sometimes elevating local average temperatures by up to 15 ͦ C. How hot it gets is dictated by how hot the centre of Australia is at the time, how close to optimum is the direction of travel of hot air from the centre to the coast, how intense is the weather system that created a fast, low heat loss transport from the hot centre to the coast.
SUMMARY.
Simple raw temperature data analysis does not support the widespread global or national claim that heatwaves are becoming hotter, longer and more frequent.
Because simple analysis does not support that claim, those who continue the claim must rely on non-simple analysis. All studies about Australia use the same data set as here, so arrival at different conclusions must depend on subjective assumptions and on them being acceptable.
Acceptable to whom?
END.
Story tip – (EPA)
My Three-Letter Response to the Dems’ Caterwauling About ‘Unelected Officials’: EPA – PJ Media
Excerpt – In its earliest days, the EPA was largely focused on protecting the environment. That’s not what the 21st-century incarnation of the agency is tasked with. It’s now a climate change hysteria propaganda factory and the primary vehicle for Democrats to dole out taxpayer-funded favors to Big Green.
It’s a grift factory.
Not for long!
Oh Really? https://www.forbes.com/sites/roberthart/2024/04/17/climate-change-will-cost-global-economy-38-trillion-every-year-within-25-years-scientists-warn/
Any article which has “Scientists warn” in the title is almost certainly garbage.
Why are you so gullible?
Why of course. Why would anyone want to find out what researching scientists have to say. It’s so much more fun to invent the science yourself, or read what some half educated blogger has to say!
“Why would anyone want to find out what researching scientists have to say”
Says the CAGW zealot who thinks Richard Lindzen is irrelevant. LOL!!
The grift is that consensus climatologists are not scientists. They rely on false precision to make their case.
Reporters don’t know that because they’re not trained to differentiate an artful pseudo-science from the real thing.
As per above the article now carries a warning from nature magazine itself so perhaps you should apologize. It was a junk piece some activist put out and it will be rescinded but the activist doesn’t care because it got the desired effect the faithful like you believed it and now cite it is fact.
The paper cited in the article is a peer reviewed paper appearing in Nature. You have better data?
“Scientists “
Except they got it all WRONG. !
It is the climate change AGENDA that has destroyed EU and many other countries prosperity, and held back third world countries, not “climate change”
Fake prophecies built on fake models, built on fake assumptions and fake data.
And Potsdam !!!… seriously !!!
One of the authors is “Professor of Dynamics of the Climate System.”
No science there at all. Climate is the statistics of weather observations.
12 year old mathematics standard. Even the IPCC stated that it is not possible to predict future climate states (whatever that means!).
As Richard Feynman said “Science is belief in the ignorance of experts.”
You don’t have to agree.
Read above even nature has flagged a warning on the article.
No warning mentioned about the paper itself in Nature. Better read it.
Your post is nonsense. The climate has been researched and studied by scientists extensively for the last 125 years. Just because you aren’t aware has no relevance.
Address the issue your linked article is now even warning tagged at Nature publishing so who is posting nonsense.
You understand your credibility is the one now in question.
Why don’t you read the peer reviewed paper in Nature and let us know if you have better data.
Arrhenius used fantasy, assumption based, erroneous simplistic models that have basically zero application in the real atmosphere..
.. Not much has advanced since then.
JFC
JFC… or did you mean KFC ?
You obviously didn’t read the article the claim isn’t done by any solid scientific method and in fact the article now carries a warning … here since you are so gullible let me print what the warning now says
>>>>>>>>>>>>>>>>>>>>>.<<<<<<<<<<<<<<<<<<<<<<<<<<
06 November 2024 Editor’s Note: Readers are alerted that the reliability of data and methodology presented in this manuscript is currently in question. Appropriate editorial action will be taken once this matter is resolved.
>>>>>>>>>>>>>>>>>>>>>><<<<<<<<<<<<<<<<<<<<<<<<<
This is the problem with you climate groupies just because some climate activist publishing in some magazine says something doesn’t make it true.
Maybe he is losing USAID funding?
You might want to read the original paper in Nature.
Economic modelling coupled with climate modelling….
I wonder what their true error margins are?
They set out to “find” something that they had already decided at the start in order to please their paymasters, there’s no surprise they “found” it because it was baked in.
Forbes Magazine? A “Once Was” Business Magazine that lost it’s way and now a rag that clearly proffers the Catastrophic Climate Change Narrative. Certainly NOT a scientific magazine by any definition.
All of sudden you read Science?
This $38 trillion/year result would be news to the 2018 Nobel wineer in economics, Willaim Nordhaus, who estimated by 2100 the global GDP would be decreased by somewhere between 2.5-10% by not mitigating “climate change”. Note that the current world GDP is just over $100T. The Forbes author is way too credulous. And I wasted one of my 4 “free” article per month looking at it. 🙁
Read Bjorn Lomborg’s recent book or view anyone of several of his Youtube interviews where he reviews this subject in detail.
From Nature:
Despite the paper’s correction in June 2024, the editors are still questioning the reliability of the data and methodology. Of course, Forbes has not updated its article to ensure readers aren’t misled.
J Boles,
From the author of this WUWT article.
Thank you for alerting readers to an interesting article not really related to heatwaves.
You might contemplate that it robbed some air from my article, leading you to conclude that there is a better way to introduce topics to WUWT. If in doubt, ask Charles The Moderator.
Now, do you have a comment to make about this heatwaves article?
Geoff S
Interesting graph
Blue years vs red years
Blue years
Temps Above 42°C – 2
Temps 40°C – 42°C – 10
Temps 38°C – 40°C – 12
Red Years
Temps above 42°C – 2
Temps 40°C – 42°C – 5
Temps 38°C – 40°C – 19
While 38°C – 40°C has seen a slight increase, warmer than 40°C has seen a decrease
It is entirely clear to all REAL scientists that world temperatures are as they have always been, slight variations over the millennia but no rises in sea level (other than that we still see from the end of the last ice age).
No, the REAL ones contradict what you say. Global Temperature rise is the fastest in a few thousand years, and SLR is accelerating.
Why is this rise not seen in temperature series like this one?
Good question.
Answer: Because there is no rise in net warm temperatures. Original temperature data does not show any net temperature increases.
Putting original temperature data through computers, operated by dishonest individuals, is what makes it look like there is warming.
The written temperature record shows no net warming. It was just as warm in the recent past as it is today.
There’s more CO2 in the air today, but it is not any warmer than in the past with less CO2 in the air. Therefore, CO2 has little discernible effect on the temperatures of the Earth’s atmosphere.
Global temperature is only a degree or so above the COLDEST period in 10,000 years. We are still very much in a cold period of the Holocene.
UAH data shows that the slight warming has mostly come from natural solar effects manifesting at El Nino events. There is no warming in the UAH data except for those El Nino effects.
SLR is not “accelerating” in any tide gauge.. it is a fallacy of combining and adjusting different satellite measurement sets
“Global temperature is only a degree or so above the COLDEST period in 10,000 years.”
That’s right, and that particular temperature increase occurred from the end of the Little Ice Age around 1850 to the 1880’s.
After the 1880’s, the temperatures cooled down through the 1910’s, with a difference of about 2.0C between the warmest period and the coolest period, and then the temperatures warmed up through the 1930’s, and the temperatures reached the same level of warmth as in the 1880’s (so no net increase in warmth since the 1880’s), then the temperatures cooled again by about 2.0C down through the 1970’s (Ice Age Cometh!), and then the temperatures again warmed from the 1980’s to the present day, with the temperature high point of today being within a few tenths of a degree of the high points in the 1930’s and the 1880’s, so no net warming today, compared to the 1880’s or 1930’s, either.
We warmed up from the end of the Little Ice Age to a high point in the 1880’s, and the temperatures have not gotten significantly higher since that time, even though CO2 has been increasing throughout all that time.
So anyone claiming today is the hottest time in human history is dead wrong.
What “real ones”? Hopefully, you don’t think that Gavin Schmidt (not even a science degree), or the fraud, faker, scofflaw and deadbeat Michael Mann are “real” scientists.
That would make you look pretty gullible, not to say simple and easily led.
“not even a science degree”
Rubbish. He has a B.A (Hons) in Mathematics from Oxford. The best you can get. All Oxford undergrad degrees are called B.A. And yes, he has a PhD in Applied Maths. A very well qualified scientist.
[just don’t talk to Nick~ctm]
ROFL seriously Nick?
Maths and Science are two distinct faculties a degree in maths is in no way a degree in science … EVER?
What is next I have a degree in law or humanities so I am a scientist.
Oh wait Mosher has a degree in some religious studies so that makes him a scientist so I guess in your climate science world that is true.
Edit: I just realized something you say above BA which in Australia would be an arts degree???? Is that right he has an arts degree in Mathematics ????? I am like WTF that is in now way a scientist you might have them as a technician in your lab.
From Wiki:
“In the United Kingdom (excluding Scotland) and Ireland, the first degree course normally lasts three years, but nomenclature varies: 19th-century and later universities usually distinguish between arts and sciences subjects by awarding either a BA or BSc degree. However, some older or ancient universities, such as Oxford, Cambridge, and Trinity College Dublin traditionally award BAs to undergraduates having completed the final examinations, e.g., Part II Tripos(Cambridge), Final Honour Schools (Oxford), Moderator-ship (Dublin), in most subjects including the sciences.”
At Oxford, every successful undergraduate gets a BA degree. Can be in Chemical Engineering or whatever
Nick, you wrote –
“Rubbish. He has a B.A (Hons) in Mathematics from Oxford”
Exactly. Mathematics is not science. That’s why it’s a travesty for Gavin Schmidt to imply that he is a “scientist”. Delusional computer model runs are not “experiments”.
Maybe you could point to a testable hypothesis formulated by Gavin Schmidt to explain anything at all, but I doubt it. You certainly can’t point to any reproducible experiments carried out by Gavin Schmidt relating to the mythical temperature raising effects of CO2, because such a thing is physically impossible.
You are obviously as gullible and easily swayed as the rest of your ilk.
You might just well leap up and down and flap your arms around, hoping someone might believe you can fly! So might pigs.
Anyone who assumes an ECS for the purposes of arguing in favour of a policy is not a scientist. He is an activist.
High level physicist says ECS is basically zero
Math degree – i.e. “numbers is numbers”. The numbers don’t have to have any relationship to the real world.
College degrees doesn’t make the person it is what they do afterwards that matters, Schmidt is admittedly a mild warmist/alarmist while Mike Mann is a rabid ecoloony warmist/alarmist whackjob.
The results vary.
From 1971 to 2024 (53yrs) global temperatures have increased 1.65°C and didn’t “tip” no thermogeddon, no anthropocalypse. In fact global temperatures have dropped almost 0.5°C since 2024 (14 months)
The heating has been in the minimum not the maximums and the UHI effect is a player in this also.
A other player in that trend would be more cloudy nights especially if its linked to a increase in a milder air source.
I have read elsewhere that the effect of global warming is not to make more or hotter high temp days but to make winters a bit warmer. Anything in your data for that?
The effect is to make both daytime highs and nighttime lows hotter. But nighttime lows are rising faster than daytime highs, so the gap is closing.
I can only speak for myself but back when I was 9 (1971) we used to play outside in the summer until it got too warm, usually around 2pm then either went inside in the A/C or would go to the McCambridge public pool to cool off. So!stones we would go to the walk in for a double feature and enjoy their A/C. I certainly haven’t noticed any changes in summer warmth over the last 53 years since then. Not even the reported 1.65°C increase since then.
Hooey
Australia is not the world
Thank God! But I live in the Up Over…Northern Hemisphere… Land of opportunity and thousands of weather station thermometers indicating little if any warming anywhere outside of urbanized zones of the concrete and asphalt jungle zones.
Is it global or isn’t it?
“Australia is not the world.”
The rest of your comment seems to have been censored. Or were you trying to correct someone who claimed that Australia actually was the world?
If you can’t name that person, I might infer that you were just being snarky and stupid.
Yeah, but the rest of the world looks just like Australia when it comes to regional, original, written temperature charts: They all show it was just as warm in the recent past as it is today. They don’t show any CO2 warming.
Yet the U.S. is also not showing high temperatures in the summer months rising. Japan has similar lack of increasing temperature in different locations. Hmmmm? Is something occurring?
In the USA, which has by far the most temperature data, “hot days” have a distinct downward trend since the 1940s.
URBAn warming causes winter temperatures and night-time minimums to increase.
“These bar graphs and maps show changes in the number of heat waves per year (frequency) and the number of days between the first and last heat wave of the year (season length). These data were analyzed from 1961 to 2021 for 50 large U.S. metropolitan areas. The graphs show averages across all 50 metropolitan areas by decade. The size/color of each circle in the maps indicates the rate of change per decade. Hatching represents cities where the trend is not statistically significant.”
Only metropolitan areas?
From 1961 to 2021, there was a lot of concrete added to all those cities. So what they are measuring is the Urban Heat Island effect, not the CO2 effect.
And on the coasts where sea breezes are supposed to moderate temps.
Reference?
Geoff S
At the other side of the world, Australia also has a distinct downward trend in hottest temperatures.
“Number of days each year where the Australian area-averaged daily mean temperature for each month is extreme (extremely warm days). Extremely warm days are defined as those where daily mean temperatures are the warmest 1 per cent of days for each month, calculated for the period from 1910–2021.”
https://www.csiro.au/en/research/environmental-impacts/climate-change/State-of-the-Climate/Previous/State-of-the-Climate-2022/Australias-Changing-Climate
Bullshit
Way to respond to data, Mike. Actually understanding it is sometimes too hard
How true.
A bunch of manically homogenised URBAN and totally unfit-for-purpose sites.
This is not heatwaves data.
What is its relevance to my findings?
Geoff S
Regional charts, like the Australian one, from all around the world, show we are not experiencing unprecedented warmth today.
The Bogus, Bastardized, instrument-era Hockey Stick “global” Chart is the only thing that Climate Alarmists can point to as “evidence” of CO2 warming, but all the original, written, regional temperature charts from all around the world show it was just as warm in the recent past as it is today, which means CO2 has had little effect on temperatures.
None of the original, regional temperature data shows a “hotter and hotter and hotter” temperature profile, the way the bogus Hockey Stick chart does. Yet the bogus computer-generated Hockey Stick chart was supposedly put together using the original, written, regional temperature data.
So how do you get a “hotter and hotter and hotter” Hockey Stick temperature profile out of data that does not have such a temperature profile?
Answer: You cheat, and put your thumb on the scale.
Here is a comparison between a bogus, bastardized Hockey Stick chart (on the right) and the U.S. regional chart (on the left).
The U.S. chart is representative of every regional chart from around the world where it shows it was just as warm in the Early Twentieth Century as it is today. Which means CO2 has had little effect on the temperatures. So little we can’t measure it.
The bogus Hockey Stick chart is a bastardization of the regional charts’ temperature profiles to make it appear that the temperatures have been getting hotter and hotter and hotter, decade after decade, and are now the hottest times in human history. This is the BIG LIE of alarmist climate science.
All the regional charts from around the world have the same benign temperature profile as the U.S. chart.
None of the regional charts have the “hotter and hotter and hotter” temperature profile of the bogus Hockey Stick chart.
Without the bogus Hockey Stick chart, the Climate Alarmists would have nothing to point to. That’s why it was created, to give Climate Alarmist ammunition. But the regional chart from around the world refute the Hockey Stick trendline.
So lets say I just agree with that statement it’s getting hotter at night. So go from there how is that going to create a earth endangering problem? Lets even extend that assume that the temperature never changed between day and night now explain why this is a dangerous and bad thing?
If you can’t find a good argument then who the hell cares.
It’s the secondary effects caused by the warming: https://science.nasa.gov/climate-change/effects/
NASA is a climate propaganda site.
Your link shows nothing but mantra and pseudo-science.
Love pretty pictures now actually list a single thing that will happen. I am sure somewhere on the planet there is some creature or plant that needs cooler nights I am just struggling to think of one.
That link is even worse than your other link …. do you actually know what real science looks like?
Some trees have a “cold” requirement to set fruit.
Not to mention vernalisation in wheat.
b.
Gee, that takes me back.
Before I stopped doing real work and went into IT, we mostly grew Gatcher, Gamut and the mighty Timgalen. We were still growing a bit of Spica when I started high school, and started growing some Kite around the same time we started chick peas.
There were some of the “Sun” varieties as well – Songlen and Suneca?
They were all spring wheats, so didn’t have much of a vernalisation requirement. That’s my excuse and I’m sticking to it.
You really are a dear old cocky,
I guess you were north of Cowra, which as I recall was the climate cutoff between winter and spring wheats.
b.
We were on the plains out of Narrabri. Further out than that, really.
Last frost and first frost typically occur at night. In the US at least, the interval between the two has been increasing – longer growing seasons.
That doesn’t mean that the frosts don’t happen at all. They just happen at different dates. That is something that can be easily adapted to. It isn’t catastrophic for food production. If it was catastrophic we wouldn’t be seeing record harvests on a regular basis. It’s all part of the CAGW “people will starve” propaganda.
Just pointing out that Leon’s
“I am sure somewhere on the planet there is some creature or plant that needs cooler nights I am just struggling to think of one.”
do exist.
So far we have a few trees (cherries, apples and pears that I can think of) and winter wheat which have cold requirements. I don’t think frosts are necessary even for them.
I prefer to live somewhere that doesn’t meet the chilling requirements for apples or cherries.
I posted real science. Do you even know what the Goddard Institute for Space Sciences is?
The link you posted was not remotely “science”.
It was climate propaganda.. nothing more.
I know what the Goddard Institute of Space Studies is. Does that count?
Do you know who the founder of GISS was and why did he create it.
Yeah, it is just like what USAID was here in the U.S. Will probably have the same defunding.
Faster 😉
Denis,
I have not calculated heatwaves in Tmin because they are not what the fuss is all about. When a heatwave happens, the media sometimes add that sleep might be hard because of warm nights, but the main theme is about how hot the day will be. That is what is discussed when drains on electricity for air-conditioning and cooling fans is discussed. That is what is mentioned when hospital ability to cope with sunstroke and heat stress is mentioned, with only occasional mention of night temperatures.
By my reading, minimum temperature gained a mention in activist literature because maximum temperature analysis did not present a suitably scary story. As I show here. Geoff S
“By my reading, minimum temperature gained a mention in activist literature because maximum temperature analysis did not present a suitably scary story. As I show here.”
I think so, too.
Google search on “ausrralia cdo weather acronym meaning” turns up this:
“In Australian weather terms, “CDO” stands for “Central Dense Overcast,”
Akshully it’s Climate Data Online. from part I
Steve,
The acronym is explained in this Part Two as Climate Data Online from the BOM, just after the half dozen links to scare stories at the start. Geoff S
Thanks, my [Ctrl-F] search didn’t find it in Part 2, but pulling up Part 1 it did..
Story tip:
https://www.washingtonexaminer.com/policy/energy-and-environment/3311919/doge-enters-noaa-raising-democratic-fears-it-will-be-dismantled/
DOGE enters NOAA, raising Democratic fears it will be dismantled
GISS certainly needs kicking to the kerb !
And I wish people what stop typing “Democratic” when referring to the very non-democratic “Democrat Party”
That’s very unDemocratic of them
Members of the Democratic Party = Democratics
Members of the Democrat Party = Democrats
Democrats don’t like it when we call them the Democrat Party, and they don’t like being called Democratics.
Democrats are an unhappy bunch. Especially now. 🙂
Try DemonRats
Or Dim-O-Crats
No GISS needs to go back to its ORIGINAL mission is started with.
Geoff
If there is a close link to weather patterning and wind direction with heatwaves in Adelaide and Melbourne. Then l would suggest you consider focusing some of your attention on this matter. What l would recommend is to look for the wind direction data for these 2 cities and maybe air pressure data from Alice Springs. To see if there is any link between the number of heatwaves and this weather patterning. Because if there is then you have a link to the cause of any change in the number of heatwaves.
If this data is not available from the weather stations themselves then take a look at the weather forecast data in the newspapers, as with luck the wind direction data will be in the forecast.
Taxed,
Thanks for these suggestions.
I have taken a look at correlation coefficients between daily Tmax temperatures at Alice and Melbourne, Adelaide and Sydney. I have lagged and led these in 1 day jumps. These coefficients are larger for the cases where Alice is earlier than the others. The highest correlations are for 1 day lags. They decrease up to 10 day lags,so the analysis was stopped there. Correlation coefficients are indicative entities, not proof of much, but these preliminary results support the hypothesis of the heatwaves action starting in the centre of Australia. There are also some literature references to this.
It would be a long job to do the studies you suggest and I have other hobbies…. Geoff S
When was living in Melbourne eons ago, the weather seemed to be Perth plus 3 days.
Geaff
Do you know the year for the record temperature at each location?
Rick,
I shall report this in a few hours from now after doing some sorting. Geoff S
Rick,
Here is the year of the hottest heatwaves. Geoff S
1-DAY 3-DAY 5-DAY 10-DAY
ADELAIDE 2019 2014 2014 1939
ALICE SP 1891 2018 2018 2019
BRISBANE 1950 1940 1903 1940
C LEEUWIN 1933 1965 1965 1961
DARWIN 1892 1892 1892 1906
HOBART 2013 1892 1994 1960
LONGREACH 1947 1947 1947 1901
MELBOURNE 2009 2009 1908 1968
PERTH 1991 1933 1933 1985
SYDNEY 2013 1960 1960 1896
(Auto formats are horrible for uses like this. Sorry it took so long.)
Good info is worth waiting for
A new measurement unit is needed for temperatures used in climate studies / published papers –
a “POOFTEENTH” of 1 degree C.
poofteenth1. a unit of measurement.
2. a very small degree or amount.
3. infinitesimally small amount, smaller than a pinch.
4. two-fifths of f-ck-all.
“just add a poofteenth.”
“if only it was a poofteenth longer.”
I was taught that a poofteenth was actually three fifths of five eighths of f-ck-all, but that was a long time ago. You obviously have the benefit of more up to date research.
Thanks.
> Simple raw temperature data analysis does not support the widespread global or national claim that heatwaves are becoming hotter, longer and more frequent.
Simple raw temperature data analysis refutes global and national claim that heatwaves are becoming hotter, longer and more frequent.
Very nice Geoff. I don’t trust adjusted data, it should not be used for policy makers. Accurate raw data is what is required with an accurate history of the process, location and changes to the location.The other concern is the misuse of tenths and hundredths of a degree for the purpose of setting records or trends.
In Australia, we now have categories of “Heat Wave”, being:
Low Intensity
Severe
Extreme
Where I live, a low-intensity heat wave is just a warm day (about 30°C) by Australian standards. The less scrupulous of our weather presenters warn us of impending “heat waves” without mentioning the category, thus ramping up the warming narrative.
The category jump from low to severe is another “fear ramping” example, just as the authorities have done with bushfire risk signs, with the lowest being MODERATE.
Taken from the BOM website:
How we classify heatwavesWe use the excess heat factor (EHF) in Australian heatwave monitoring and forecasting. Using this index, we classify heatwaves by intensity.
The EHF combines:
In simple terms, the EHF measures how much of a shock to the body the forecast temperatures will be, compared to the weather over the past month.
They should also be thorough and come up with an excess cold factor (ECF)!
Good post Geoff!
The BoM mislead in other ways too jayrow.
Arguably their most powerful method is how they colour their projection maps that show forecasted temperatures for the next several days.
Another outfit called Brisbane Storm Chasers put out even more garish maps of exactly the same data/satellite images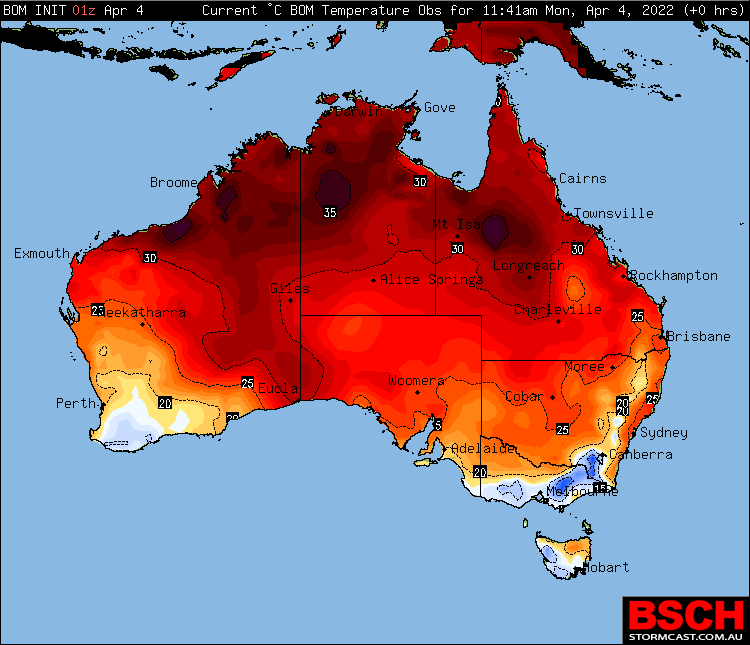 ).
).
All the best,
Dr Bill Johnston
http://www.bomwatch.com.au
Bill you might know the answer when did the BOM change the definition of heatwave. I remember in a couple of decades ago 3 days over 38C was considered a heatwave but it looks like now 3 days over 34C is a heatwave.
This came up over Australia Day weekend it was beautiful 3 days at 34-35 and the BOM was dribbling on about a heat wave and I was like WTF this is not a heatwave.
It obviously came in with that graph change the OP put up.
Dear Leon de Boer,
I don’t know exactly off the top my head, but it was several years before the 2019/2020 bushfires., possibly even a decade before. Look at the picture above – 30 to 35 DegC is not particularly warm for the Pilbara and Kimberley in summer, yet Brisbane Storm Chasers colour it as “extreme”, which is mis-information writ-large.
You could also check-out this https://www.nature.com/articles/s41467-020-16970-7.pdf; where she references herself in slot 1 as the expert (1. Perkins, S. E. & Alexander, L. V. On the measurement of heat waves. J. Clim.26, 4500–4517 (2013)).
As they often publish a science puff-piece using modelled or off-the-shelf “products” often in Nature, beforehand, I guess it was around that time.
Cheers,
Bill
See my comment above this one (8.22pm) which gives the details.
Gday Bill and Geoff
The BOM changed their heatwave methodology about 10 years ago. I wrote about it in my post https://kenskingdom.wordpress.com/2015/08/08/heatwaves-from-one-extreme-to-another/ . From the paper it was based on I was able to replicate the results for the 2014 Melbourne heatwave exactly. While the method works very well for Melbourne (where the BOM is based) it can’t find the record 1923-24 extreme heatwave at Marble Bar, the hottest town in Australia, but does find more heatwaves at Mawson base in Antarctica than Melbourne or Marble Bar. The record maximum at Mawson was on 9th January 1974, when it reached all of 10.6 degrees Celsius. My post has all the details. I concluded that “A methodology that fails to detect heatwaves at Marble Bar, and creates them in Antarctica, is worse than useless- it is dangerous.” Yet that is what is used across Australia to warn people about one day “heatwaves”.
Thanks Ken,
I forgot how busy you have been. Your audit of “wacky weather stations”, was particularly handy.
According to Nairn & Fawcett, their new system came on-line in 2015, but I think it has been modified since. I remember also that Sarah Perkins also had a website (gone or replaced now I think), called Scorcher. I think her theme was “how to convince people it is hotter than it actually is” – the usual communication BS that they were all getting high on in those days (and still do). I don’t think much of her ‘work’, mainly because she avoids real data, and that she and her merry band disregard the effect on extremes of changing from 230 to 60-litre screens.
I drove out to Marble Bar from Port Hedland in November to see the weather station. The 60-litre Stevenson screen is in its own little private gravel pit behind the motel – Google Earth Pro shows the “topsoil” was stripped probably in 2022. Hardly anything has grown back (see Figure 14 in: https://www.bomwatch.com.au/wp-content/uploads/2022/12/Marble-Bar-back-story-with-line-Nos.pdf).
All the best Ken,
Bill
Thank you Ken.
I remember how telling your conclusions about heatwaves in Antarctica but not in Marble were.
So much depends on definitions of heatwaves.
That is why I started with the simplest calculation I could envisage, an N-Day heatwave being the largest average in a year of N consecutive daily Tmax.
Geoff S
The BBC pulls the same trick with its weather maps.
Jayrow,
The 3-Day heatwave indices that I have calculated and shown here is in Parts 1and 2 are comparable with this BOM definition, which differs significantly by one word, “considered” in “considered hot for that location.”
My analysis does not involve subjective factors like “considered”. It simply uses “observed”. If you use “considered” you have to asked who considered it and if that entity was scientifically neutral (as I am here) or working to an agenda. The half dozen links I gave at the start, to me, indicate an agenda at work. The agenda is not to be trusted if it is accepted that my simple, raw analysis questions the official story. As it does. Geoff S
Did you know that in 2022, Sydney did not have a single day over 32C !!
Ah, jayrow, their change in methodology allows them to declare a roaring heatwave in the middle of winter!
All this nonsense came from the ‘work’ of Sarah Perkins-Kirkpatrick, now a professor at the the Fenner School of Environment and Society at ANU. Sarah apparently has a passion for climate extremes, particularly heatwaves (https://fennerschool.anu.edu.au/people/sarah-perkins-kirkpatrick).
Their claim that heatwaves have shot through the roof, when as Geoff shows there is nothing in it, is all due to re-badging, re-colouring, re-naming heatwaves as being due to something else.
(Notice from your comment below, that unlike Geoff, they don’t use long-term metrics as part of their definition.)
Except for Perkins-Kirkpatrick tucked-up in her air-conditioned fenner school, who does not like a nice warm day in winter, or doesn’t look forward from the depths of winter, to spring and summer, especially in the cheerless, isolated and remote community of Canberra?
All the best,
Bill Johnston
Yes Bill,
Universities as we knew them, when there were years of hard work to graduate, do not now exist in a similar form. There seems to have been a loss of the need for excellence and some would say, truth.
There are some sick things going on in academia. Look at retired politicians heading for vice-chancellor positions that pay well ( a million a year or so) and allow political fixations to be inserted into the education processes.
Geoff S
This is, in general, gaslighting. It is a deliberate strategy to instill fear in the general public. It is this fear that is key. Fear is the primary tool used to control populations through psychological warfare. Anyone telling you to be afraid or trying to instill fear in you is trying to control you. Granted, this may be warranted in very specific localised cases, like if there is actually a fire in the theatre, but it is almost always a tactic to gain control. We are now (and have been for some time, perhaps decades) in a situation where the government bureaucracies and the associated intelligence agencies of countries are waging an active psychological war on their own citizens.
Most people are highly susceptible to fear based propaganda. Of those who resist, many are then susceptible to the shame/guilt tactics used by behavioral psychologists (Nudge units). It remains unclear what set of psychological attributes are best suited to resisting psychological warfare, and if those undertaking it know (which they might), they are certainly keeping that a tightly guarded secret. I would suspect that a strong part of it is an education in critical thinking (how to think logically) and reasoning is an important part of it. This suspicion comes about by looking at what they are NOT teaching children (and adults) to do anymore. People are actively discouraged from thinking for themselves, from questioning the “experts”, that to hold certain opinions (that were widely held even a few short years ago) is a “hate crime” (yes, they have just passed hate crime legislation in Australia).
We are headed into an Orwellian nightmare at a rapid pace, for the very reasons that were warned about in 1984 (the inevitable progression of Fabian Socialism). While their various cover stories are crumbling as we go, it is not at all clear that people will come to their senses before we are rendered as serfs to some global authoritarian system.
Meaning, that on the coldest, darkest, wettest, most humid, rainiest, still night in the depths of winter, the fire risk is moderate! Lol.
Very excellent decomposition of the claims of heatwaves, Geoff. You did a lot of work to get those numbers.
The variability of the variability was interesting. Some evidently nearly unchanging across the decades, within error. Others with some real variation but nothing particularly alarming.
Have you thought to send your study to some Australian newspaper or reporter? It seems to me your finding should be widely disseminated.
Pat,
Australian newspapers have uniformly supported alarmist stories about climate change.
I shall try to get this published and will let you know.
Your work on LIG thermometer drift is relevant to this type of study. I did not mention it because some readers turn off as soon as it starts to get technical. Maybe there will be a Part 3.
My interest in more to encourage people in other countries to download their own data and do similar calculations.
It is hard to raise an objection to a simple, neutral analysis of the original, official raw numbers.
Geoff S
Geoff,
If nighttime minima are rising, this would support the hypothesis that anthropogenic heat affects thermometers more at night than during the day. One might even find that average temperatures rose after the industrial revolutions which took place in island nations such as Great Britain and Japan (quite different dates for their respective industrial revolutions).
A “national heat island” effect, so to speak.
Given that the Earth’s surface has cooled by a few thousand K over the last four and a half billion years or so, and its present core temperature is around 5000 K, the chances of the seas going back to boiling point seems remote.
Without a super-villain wielding a Galactic Blowtorch, or something equally bizarre.
Keep up the good work.
Man-made structures, including roads, etc; are much better heat sinks than natural landscapes. Nighttime temps therefore start at a higher temperature as the sun moves west. This raises the integral of the nighttime exponential decay curve. Thus nighttime appears to be warmer. It’s all UHI. UHI isn’t just a phantom, it has real world impacts. Does this mean a change in climate? Since temperature is not a good metric for climate the answer is: WHO KNOWS?
From: https://www.sciencedirect.com/science/article/pii/S0048969720340432#f0015
“Heatwaves intensification in Australia: A consistent trajectory across past, present and future”
First note that heatwaves are much ameliorated along the coastal fringes (top left).
Vis the cities that Mr Sherringham states do not show trends in heatwave intensity/duration.
The reason, of course (as I outlined in his first essay – and which is meteorologically indisputable) is the penetration inland of sea breezes
The trends in Tmax can be seen to be negligible to slight along the coastal fringes.
Even Alice Springs shows no trend (in white area bottom graphic, top left).
blob:https://wattsupwiththat.com/6cf684dd-89db-4703-bc33-128b334c428f
“Fig. 1. Averaged heatwave indices over the period 1981–2010.”
“Fig. 3. Trends in heatwaves indices for the period 1950–2016 (67 years). Trend slopes are expressed on a decadal basis. Stippling denote statistically significant trends (p ≤ 0.05).”
In addition:
This is a study of sea-breeze penetration and cooling power over Adelaide ….
https://www.sciencedirect.com/science/article/abs/pii/S0169809520313466#:~:text=The%20sea%20breeze%20has%20the,urban%20heat%20island%20monitoring%20network.
“Abstract
Extreme high-temperature events pose a threat to human beings on Earth. In coastal cities, the sea breeze is widely known as a prevailing wind that can cool the near-surface air. However, the cumulative cooling effect and its attenuation process during the sea breeze penetration have not been well investigated. In this study, we analyze sea breeze cooling capacity (SBCC) and propose a new method in estimating the penetration distance of sea breeze cooling in metropolitan Adelaide during summer using data from the Adelaide urban heat island monitoring network. The results show that during a sea breeze day, wind direction rapidly changes from southeast to southwest in the morning, and it gradually returns to southeast in the afternoon. It takes 67 min on average for the sea breeze cooling fronts to penetrate inside metropolitan Adelaide.”
“The spatial pattern and penetration distance of the cumulative sea breeze cooling effect contribute to a better understanding of this common cooling source for heat mitigation in coastal cities where a large number of people reside.”
And this study has found an increase in the strength of the SB in Adelaide.
The significance being that a SB is driven by the deltaT between the ocean and land…..
https://journals.ametsoc.org/view/journals/apme/58/2/jamc-d-17-0251.1.xml
“The annually and seasonally averaged maximum wind speeds on sea-breeze days increased significantly over the 52-yr period of the study by 0.65 m s−1 for the whole year, 0.48 m s−1 in spring, 1.02 m s−1 in summer, and 1.10 m s−1 in autumn. A comparison of hourly data for 1985–95 with those for 1996–2007 showed frequencies of sea-breeze onset times less than 4 h from sunrise increasing from 29% to 36%, durations greater than 8 h increasing from 51% to 59%, and times of maximum sea breeze between 2 and 6 h after sunrise increasing from 44% to 50%. The monthly frequency of sea breezes was found to increase by 2.8 percentage points for each degree Celsius rise in monthly average maximum air temperature at Adelaide Airport. The meridional ocean-breeze wind speed, unlike the gulf-breeze wind speed, is also correlated with maximum air temperature at Adelaide Airport.”
I know Mr Sherrington will deny all the above with extreme prejudice …. But, hey, there are peeps viewing that are interested in seeing the full and correct picture done by scientists in the field.
And for those dismissing them as frauds and/or incompetents.
The answer lies with yourselves.
These are key statements and refutes your rejection of Geoff’s study. These statements indicate that sea breezes days don’t occur daily, nor did they have a large increase in frequency (2.8%). In other words, very hot days can occur without a sea breeze.
You make large jumps in logic without any thought don’t you?
Jim,
Part 3, almost finished, has words about this. Geoff S
That’s quite interesting. Gulf of St Vincent sea breezes in Adelaide seem to behave considerably differently to Tasman Sea sea breezes along the NSW coast.
From the article: “The wrong logic. There is general scientific acceptance that global temperatures have increased by 1 to 1.5 ͦ C in the last 120 years or so.”
I beg to differ.
As any unmodified, original temperature data shows, and the charts in this article also show, it was just as warm in the Early Twentieth Century as it is today.
That being the case, the temperatures have NOT increased by 1 to 1.5C. The temperatures are the same as they were 120 years ago or thereabouts. There has been no net increase in warmth since the Early Twentieth Century. it’s not any warmer today than it was in the recent past.
That’s what the original (“raw”) temperature data from all around the world shows.
That’s what this article shows, also.