Geoff Sherrington
The daily temperature observations from many Australian weather stations have now been routinely updated by the Bureau of Meteorology, BOM, to the end of year 2024.
Year 2024 has been publicized GLOBALLY as the “hottest year evah!” so it is time to examine how Australia fared. Here, heatwaves are the medium used.
The frequent, accepted chant is that globally, heatwaves are becoming “hotter, longer and more frequent”. This chant is not supported by the following heatwave analysis which examines 10 Australian weather stations with lengthy historic observations. This study has generated 160 graphs that are linked by weather station/city that is the main part of this article for readers to examine.
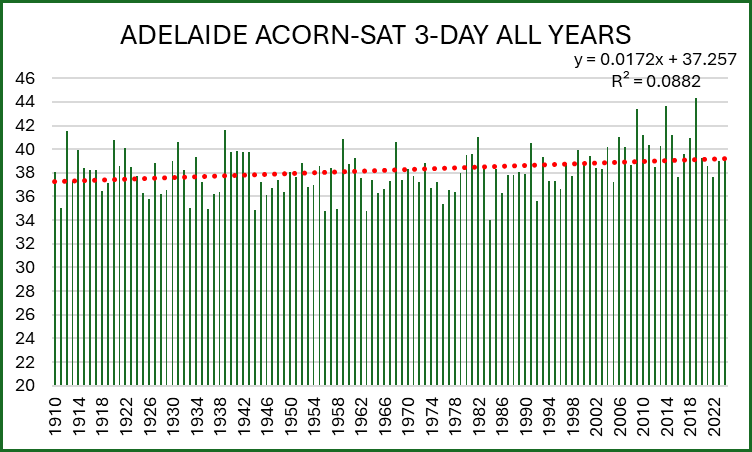
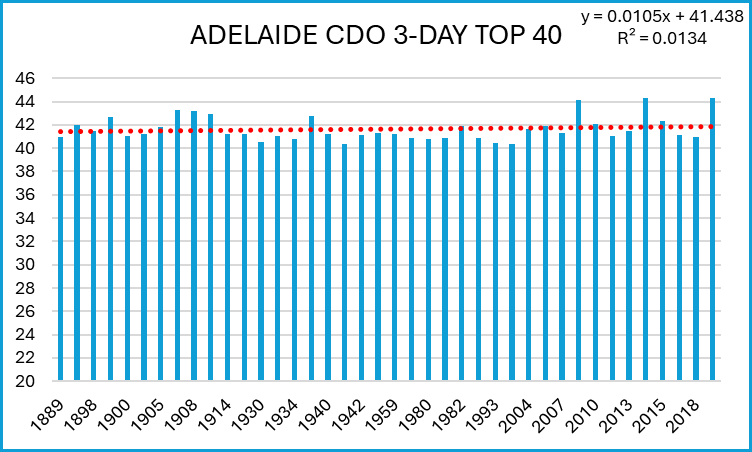
Here is a snapshot of Adelaide, using only 3-day heatwave examples, 4 graphs out of a possible 16 for Adelaide.
RAW DATA
ADJUSTED DATA
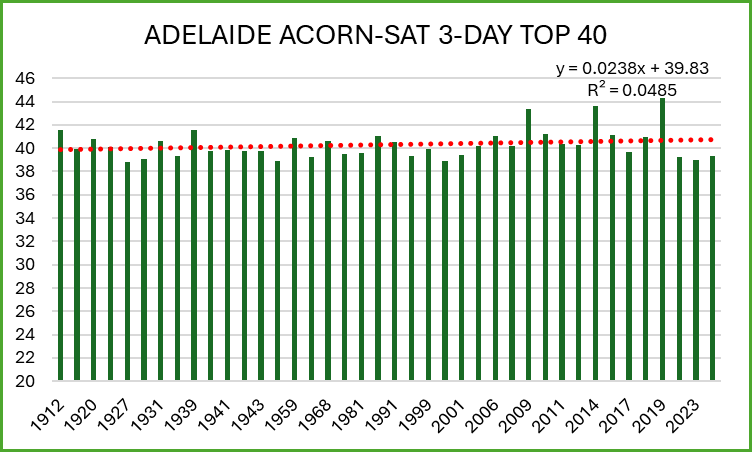
In short summary, you can read almost any answer you seek into these 4 graphs and also for the whole set of160 graphs.
Dr Roger Pielke Jr expressed a similar complication in a recent article –
“In his classic paper on “How Science Makes Environmental Controversies Worse,” science policy scholar Dan Sarewitz referred to such circumstances as an “excess of objectivity,” which he characterized as:
. . . not a lack of scientific knowledge so much as the contrary—a huge body of knowledge whose components can be legitimately assembled and interpreted in different ways to yield competing views of the “problem” and of how society should respond. Put simply, for a given value-based position in an environmental controversy, it is often possible to compile a supporting set of scientifically legitimated facts.²
Climate Science Whiplash – by Roger Pielke Jr.
Australia’s BOM issue special statements about heatwaves.
The latest on this list concerns a heatwave in S-W West Australia (including Perth and Cape Leeuwin) in November 2023. It contains these messages in its 26 pages:
“In November 2023, south-west Western Australia, including Perth, experienced a heatwave exceptional for the time of the year.
Climate factors contributing to the heatwave conditions included record warm global sea surface temperatures, El Niño in the Pacific Ocean, a positive Indian Ocean Dipole and a positive Southern Annular Mode.
Heatwave conditions can be challenging for vulnerable people, including very young children, older people, people with disability and those with medical conditions. (Elsewhere are these BOM words: “Severe and extreme heatwaves have claimed more lives than any other natural hazard in Australia.”)
The likelihood of the record warm spring 2023 in Western Australia exceeding the previous record in the current climate compared to a world without climate change was at least 50 times greater.”
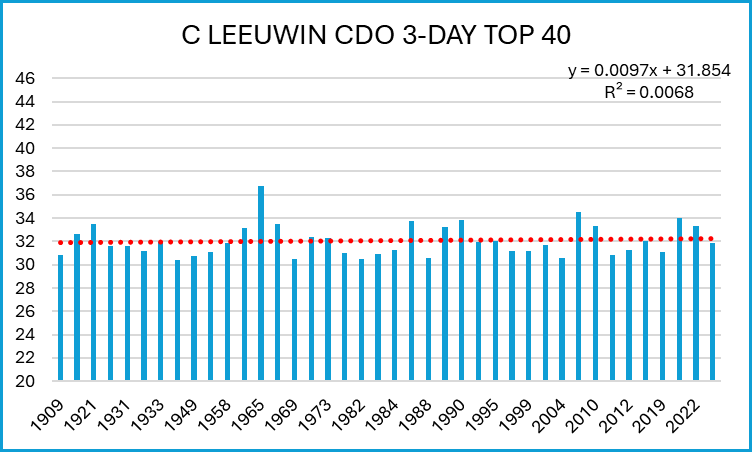
Do you see the point that Dr Pielke was making? Year 2023 does not even make the Top 40 3-day heatwave summary for Cape Leeuwin, below; nor for Perth; nor the 1-Day, 5-Day or 10-Day heatwave Top 40 list for both stations.
METHODOLOGY.
The observations reported here are of two types, both from the official Australian Bureau of Meteorology (BOM). First, there is “raw” temperature data under the shorthand “CDO” for Climate Data Online.
Climate Data Online – Map search
Second, there is adjusted data as the BOM ACORN-SAT, for Australian Climate Observations Reference Network – Surface Air Temperature at –
There is also a catalogue of 112 chosen weather stations for ACORN-SAT.
The adjustment process is described at the next link. Several more detailed articles are referenced there.
I have calculated and presented heatwave graphs over time, for both the full set of years available and the shortened “Top 40” of each of these hottest heatwave years. I have not covered stations that host 2 or more hot heatwaves in a year. Only each year and its hottest heatwave are reported here, with a choice of all recorded years or the hottest 40 heatwave years.
The heatwaves shown here are of four durations. These are 1, 3, 5 and 10 consecutive days, averaged. The hottest average for that station in that year is selected.
In simple factorial form, we have 8 weather stations, with all years and Top 40 options, with Raw and Adjusted, with 4 levels of duration, to give 10 * 2 * 2 * 4 for 160 combinations, hence 160 graphs.
The graphs are at these links:
https://www.geoffstuff.com/alicewaves.xlsx
https://www.geoffstuff.com/adelwaves.xlsx
https://www.geoffstuff.com/briswaves.xlsx
https://www.geoffstuff.com/darwaves.xlsx
https://www.geoffstuff.com/hobwaves.xlsx
https://www.geoffstuff.com/longwaves.xlsx
https://www.geoffstuff.com/leeuwaves.xlsx
https://www.geoffstuff.com/melbwaves.xlsx
https://www.geoffstuff.com/sydwaves.xlsx
https://www.geoffstuff.com/perwaves.xlsx
…….
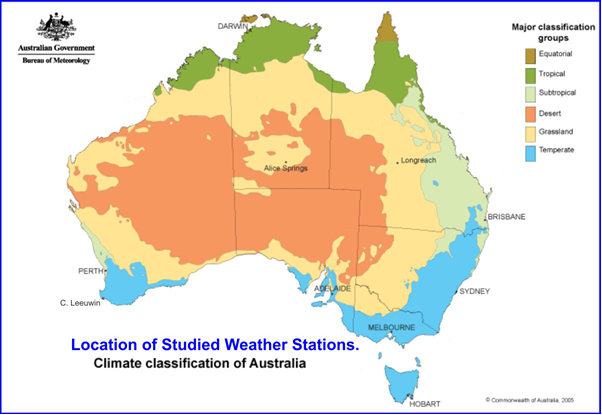
The 10 weather stations were chosen from a short list of Australian stations with earliest historic start dates and least missing data. The chosen stations are the 6 State Capitals plus Darwin and Alice Springs, the latter two to give better geographic coverage of the map of Australia, plus Longreach and Cape Leeuwin for minimal Urban Heat Island influence.
The eight examined CDO weather stations are:
Adelaide, # 23000 West Terrace start 1889, until # 23090 Kent Town starting 1979.
Alice Springs, # 15540 Regional Office start 1879, until # 15590 Airport starting 1942.
Brisbane, # 40214 Regional Office start 1879, next # 40223 starting 1986, until # 40842 Airport starting 1995.
Cape Leeuwin, # 9518 Lighthouse station start 1907, until present day.
Darwin, # 14019 Post Office start 1885, until # 04015 Airport starting 1942.
Hobart # 94029, Ellerslie Rd starting 1918, until now.
Longreach, # 36030 Regional Office starting 1897, until # 36031 Airport starting 1967.
Melbourne, # 86071 Regional Office start 1856, until # 86338 Olympic Park starting 2013.
Perth, # 9034 Regional Office start 1897, until # 9021 Airport, starting 1965.
Sydney, # 66062 Observatory start 1859, until # 66214 new Observatory starting 2018.
NOTE 1: Many of these stations underwent a site shift, many in the middle of the study period, typically from a Post Office to an Airport. This has affected the distribution over time of these hottest heatwaves. There is no reliable method to adjust this by a single step change because the magnitude of such a step is not now knowable.
Note 2: Many Australian weather station temperature results (not heatwaves) have been examined in detail by colleague Dr Bill Johnston and reported on his Bomwatch blog. By correcting for a physics-based influence of rainfall, he has deduced that most Australian stations show essentially no warming over the whole period of their observations. It should follow that heatwaves likewise have not shown increases or decreases.
Cape Leeuwin, Western Australia – www.BomWatch.com.au
….
The same 10 CDO stations were used for ACORN-SAT analysis. A major difference between CDO and ACORN_SAT is the start date of the latter, all being 1910 or later (Brisbane starts in 1950).
….
An Excel spreadsheet of one of the stations (Longreach, a short one) is found here to show the methodology in more detail It is a 24 MB file, please allow time.
https://www.geoffstuff.com/longheat.xlsx
Here is a step-by-step description of the methods I used to generate these graphs.
https://www.geoffstuff.com/myway.xlsx
Some essential points:
- A day of missing data can lead to large damage to the calculations, because that 1 day affects 9 other days in the 10-DAY analysis. Therefore, all missing values were infilled, either by a subjective guess in the ballpark of surrounding values, or with the overall average Tmax value for the station. The shortest duration station, Brisbane, has some 50,400 days analyzed, with a few hundred missing values, so the odds of induced error are small. They can be traced.
- I have made the Excel commands as simple as possible. No knowledge of macros, programming or even Pivot tables is needed. The invitation is open for you to replicate the methodology for your own locations.
- I have not cherry picked the weather stations. Together, these 10 cities/locations house more than 70% of Australian population. This has meaning when planning for heatwaves, such as where to build hospitals and how large to make them.
- The chosen cities probably suffer from the temperature distortion of Urban Heat Island effect. There have been transect studies showing UHI in excess of a couple of degrees at times in both Sydney and Melbourne. I have now included two stations unlikely to have been affected by UHI, Cape Leeuwin and Longreach.
- Rebuttal of the misunderstanding that heatwaves are becoming “hotter, longer and more frequent” lacks credibility if actual data are used such s here, for 10 stations in far off Australia. It is hard to maintain that misunderstanding when simple graphs of real data are shown to those who make such claims. I am writing a more detailed analysis of these 160 graphs, should WUWT accept it.
- You are encouraged to make similar graphs for regions elsewhere. For heatwaves, they are hard to refute, in contrast with official/IPCC type studies, which usually commence after 1950 and which rely upon arcane definitions of heatwave to arrive at conclusions.
END.
Geoff Sherrington
Scientist,
Melbourne, Australia.
I have seen accounts that the temperature records are further distorted by omitting 1800’s records, when there was a notable heat wave in the late 1800’s.
Correct Tom.
1896 – 2 weeks around 40 C over a third of the continent.
400+ deaths directly, observably attributable to heat exhaustion.
No aircon or insulation back then, and heavy woollen clothing for everyone.
Joe Biden thinks he was there and survived only by social distancing and wearing a mask.
Why so much woolen. They couldn’t grow or buy cotton?
No enough storage water in Oz for cotton growing back then Joseph.
Look at old pictures of what people in colonial countries all around the world wore back then. Heavy wool or serge materials.
Even in my army conscription spell in the late 1960s, we were issued with 100% wool battle dress uniforms. (only worn for ceremonial gigs, but that was bad enough 🙁 )
The problem with temp records in Oz prior to 1910 is the poor siting/exposure and the use of Glaisher screens at the time …
https://theconversation.com/factcheck-was-the-1896-heatwave-wiped-from-the-record-33742
“Meteorologist Clement Wragge, in an 1886 report (Wragge, C. L. 1886. Meteorological Inspection and Proposals for a New Meteorological Organisation, Report to the Colonial Secretary, Brisbane, presented to the Queensland Parliament, 14 pp.), pointed out that some thermometers:”….
“… are hung under verandahs and over wooden floors; others are placed against stone walls and fences. Such exposures (not to mention the several remarkable instances of thermometers being placed and observed indoors) give results which are not only not intercomparable and so valueless to meteorology, but which are affected by artificial and secondary conditions, giving misleading values.”
“So did the different ways of exposing the thermometers seriously bias the 19th-century observations, relative to modern readings? The answer is yes, and we have Charles Todd (of overland telegraph fame) to thank for answering this question.
In 1887, Todd set up what must be one of the longest-running scientific experiments ever, when he installed thermometers in a Stevenson Screen and on a Glaisher Stand at Adelaide Observatory (as seen in the illustration here). Observations were taken in both exposures until 1948.
The results of this 61-year experiment show that summer daytime temperatures measured using the Glaisher Stand are, on average, 1C warmer than in the Stevenson Screen. And this was at a well-maintained station – if a Glaisher Stand is not used properly, direct sunshine can fall on the thermometers, dramatically increasing the warm bias (and this was probably what happened at some stations, given that we know equipment was not always well maintained).
So, for much of Australia, temperatures recorded before Hunt’s insistence on standardising weather stations in about 1908 would be biased towards warmer temperatures, relative to modern observations. The poor maintenance noted by Hunt in 1907 would also lead to biased temperature recordings compared with a modern, well-maintained site.”
As for the mortality of the 1986 event….
“University of New South Wales climate researcher Sarah Perkins-Kirkpatrick said people in 1896 were largely unprepared for extreme heat, meaning they were more vulnerable to its effects.
Back then everyone wore a lot more clothing than what they do now, there was no air conditioning, people worked outside, they moved outside a lot,” she said.”
https://www.abc.net.au/news/2019-12-21/1896-heatwave-killed-435-climate-scientists-cant-compare-today/11809998
Go away, Anthony Banton.
All of my graphs use Stevenson screens.
No Glaisher screens.
Why the diversion?
These are among the best quality Australian sites, no thermometers hanging under tin roofs.
These are the primary data available to all researchers, including those who reach different conclusions,
Do you think that after 30 years of studying this I am unaware of your comments?
Geoff S
When defending old data, Nick has declared more than once that we have to use it, regardless of how bad it may be, because “it’s all we’ve got”.
The bit about Glaisher screens was in a reply to Mr.
Re record the heatwave of 1896.
Not you.
Go away yourself !
Perhaps you could respond to the post I did make re yours.
The selection of sites that are not useful in the determination of an increasing temperature trend.
Because they are subject to afternoon sea-breezes.
”Do you think that after 30 years of studying this I am unaware of your comments?”
Are you aware of the impact that a sea-breeze has on max temps then?
The best selection of a site to determine warming is a single site! Regardless of where it is located or how accurate it is, as long as it isn’t drifting or some other systematic problem, it provides a pretty good indication of temperature change AT THAT location. String enough single stations over a large area, as Geoff has done, then one begins to question exactly how an average anomaly is correct.
The graph from NS above shows how warming can be added into an average even though there is no warming, only instrument changes.
As more and more people begin to investigate single rural sites not subject to UHI there is going to be more and more questions about GAT. Better get your statistical ducks in a row so you can attempt to answer the questions that arise.
Banton,
Your best scientific option, I suggest, is to write something like “Evidence presented here leads to a clear conclusion that Australian heatwave variation over many years is too small to derive a useful trend.” Followed by “Please accept my error of quoting a disgraceful fact-check comment from the disgraced The Conversation in a feeble attempt to rebut clear scientific evidence. I am learning to be more scientific.” Geoff S
Lol.
Sherrinham:
My substansive poin to you is that your choice of stations in an effort to prove that GW is not thing in OZ is flawed.
Try looking at stations that have a diurnal range of temp that is not interrupted before time of max temp by a breeze from the ocean that has a temp comensurate with the fetch it took over said sea. (NB: it will, of course have warmed somewhat in the short fetch over land from point of coming onshore).
Also the Conversation bit has a quote from a Mr Wragge …
“Meteorologist Clement Wragge, in an 1886 report ..”
Are you saing that that is a lie, incorrect. What?
Your point is not substantive at all unless you are willing to admit that the GAT suffers from the same factors – i.e. it ignores geography and terrain when calculating the “global average”. Meaning the GAT is as useless as you claim Geoff’s is.
As I mentioned above, it really doesn’t matter at a single station unless the breeze you mention is a one in a hundred years occurrance.
Banton,
His name is Sherrington. I can’t tell if you’re being intentionally rude or had an auto-correct mishap.
In any case, are you familiar with the location of Alice Springs? No sea breezes there. Most of your arguments are moot because (a) they won’t substantially affect the duration of heatwaves in a location and (b) Geoff isn’t averaging locations together but looking at each location individually. Surely heat waves are only relevant in this context in human population centers?
Glad to see you understand what Geoff is trying to do. One of these days more folks are going recognize the difference between local records and the gerrymandered GAT.
+100!
I doubt they’re his personal comments, more like a cut and paste from an obscure report.
By that standards, all records prior to the most modern of sensors should be discarded.
Also all ground data should be discarded because satellite data is much better.
No.
The article I posted specifically related to the daft exposure of thermometers and the use of Glaisher screens in the 19th ct.
Which the study shows produced measured differences of 1C (in a controlled setting)
“Nicholls et al give a brief account of the 1887-1948 experiment comparing temperatures measured in a Glaisher stand against those from a Stevenson screen and conclude that, “Over the year, the mean temperatures were about 0.2°C warmer in the Glaisher stand, relative to the Stevenson screen.”
http://www.john-daly.com/screens.htm
Much later than Todd and 1948.. Science knowledge expands not contracts. Except in woke circles. 😉
And as long as it was consistent at both, any long term CHANGE should be the same. It would however add a 0.2°C warming to a long term average of both.
You missed these bits ….
“For their source data they rely on two unpublished reports, Richards et al (1992 and 1993), which are essentially records of numerous statistical exercises carried out on the Glaisher / Stevenson data by students at Swinburne University of Technology in Melbourne. These reports do not contain an adequate analysis of the possible causes of significant discontinuities in the time series despite Richards et al (1993) containing a summary detailing at least six screen changes and a station move, events which in most cases correspond with discontinuities in the temperature data.
It is this writer’s view that the Richards et al (1992 and 1993) reports are not adequate supporting references under the circumstances and that Nicholls et al (1996) should have submitted their data for review as a new project.”
Nicholls et al (1996) have not presented the data and associated historical records that would be required to support valid conclusions as to the Glaisher / Stevenson difference revealed by the Adelaide experiment. The onus is on Nicholls et al to do more with this data and related records if their findings are to be considered along with those of Parker (1994). At the very least there is a need to compare these data to other temperature records from the Observatory as well as records from other sites.”
” It is this writer’s view”. Yes we know. 😉
Highest temperatures recorded in Australia…
How was temperature measured in Charles Sturt 1n1828? I remember that accurate liquid-in-glass thermometers were only invented in the 1880’s.
I did a quick on Wiki and found that accurate mercury-glass thermometers were made in the early 1700’s.
The Charles Sturt and Thomas Mitchell entries are both from expeditions led by those gents, rather than particular locations.
The locations shown would be approximate, but basically the inland plains.
Banjo Patterson was only half joking when he wrote “Hay and Hell and Booligal” early in the Federation Drought.
And a chart of % days over 35C at all long term GHCN sites in Australia (to 2016)
Earlier records are available from BoM. ACORN is based on BoM records, and BoM was founded in 1908, soon after Federation. But as you’ll see in Geoff’s post, CDO records for Adelaide go back to 1889.
Why would anyone see a problem with this comment and downvote it?
True, the BoM elected to start reportage of temps history for public consumption starting only at 1910.
Which,
somemany say, conveniently omits the Federation Drought hot years (1901 on), and of course the earlier 1896 lethal heatwave.So the historical starting point for BoM’s decadal ‘climatic’ warming reportage starts about 2 decades in front of (behind?) the accessible starting point.
If you know the ropes with BoM archived records (as Geoff, Bill and Nick clearly do), you can find pre-1910 records.
Not hard – there is a BoM page called Climate Data Online. It’s well organised – you can get daily or monthly data as far back as it goes for just about anywhere.
The national government Trove website is also a great resource for insights into contemporary observations of day to day conditions across Australian regions, cities, towns.
https://trove.nla.gov.au/
The 1896 heatwave contemporary news coverage is here –
https://trove.nla.gov.au/search?keyword=1896%20heatwave
A search of the BoM’s website for the 1896 heatwave returns this from my browser –
NOT SECURE!
Much myth making here. It was, by that report, very hot in Bourke, in the NW (far inland) corner of NSW. But there was nothing much in Sydney – one day of 42.5C and only one other over 40. And nothing special in Melbourne
Nick, I hope you’re not devolving into one of those history deniers who maintain that contemporary weather / climates conditions are UNPRECEDENTED!
Wow. Sydney and Melbourne both affected by the ameliorating effect of the ocean, who woudda thunk.
Bathurst is 200 km from the sea on the way to Bourke. Highest temp Jan 1896: 40.4C
I’m surprised that Bathurst (elevation 700m) has ever reached 40 degrees C.
It’s not as cold as Orange (900m) or Blayney (870m), but it’s a close-run thing.
That’s a little higher than Bourke or Walgett’s 100m.
p.s. This is a nice topographic map of Australia – https://en-au.topographic-map.com/map-4xdw1h/Bathurst/?center=-32.97684%2C142.13871&zoom=5
Yes. That is how homogenisation works. 200km is a station in close proximity. 😉
It has nothing to do with homogenisation.
From Nick’s beloved CSIRO…
Mr,

These graphs show the strongest Sydney heatwave was in 1960. It sticks out above the rest.
Bourke, where the 1896 heatwave was severe, is about 640 km NW of Sydney.
Just for comparison (the two towns have different climates) here s a picture of the Tmax of both heatwaves, day by day in January of 1896 and 1960.
The 1896 event can be interpreted as longer and hotter than the 1960 event.
I cannot understand why most Establishment heatwave articles try to ignore it.
Geoff S
Geoff, the History Deniers ™ will present myriad “evidence” and reasons why the contemporaneously observed & recorded weather / climates conditions are inadmissible.
And try to cancel them, because that’s their “peer review” playbook to everything climate that doesn’t comply with the “narrative” consistent with “The Cause” (as Mikey Mann described the cabal’s “science” in his Climategate emails).
Found this… for Bourke.
Bourke had a lot of missing data from 1998-2010, so much of it would be “made-up”
Bourke data from the two sites looks like this.. (below)
Note the trend from dubious data period since 1998.
And the Bourke site history…
sorry…. Bourke data chart didn’t attach… trying again
Oh , and for the non-Aussies, Bourke Airport is a tiny outback airport, mostly catering for small twin-prop Cessna-type aircraft.
It is highly unlikely that it is affected by jet engine warming etc.
Bourke Airport (YBKE)
30°02’33.08″ S 145°57’02.49″ E (google maps)
Geoff,
You have picked out the most favorable examples for your case, notably in showing Cape Leeuwin, on a promontory on the very SW tip of Australia, rather than Perth, which has risen 3°C:
Perth is a classic example of UHI, Nick..
If the Fremantle Doctor sea breeze ever went awol for any period in summer, most SandGropers (affectionate slang term for West Australians) would have left for cooler pastures long ago.
Relatives in Perth tell me they had 45 C last week.
Reminded me of when I lived there for a while in 1976.
I went there in 1976 too. 1977 and 1978 were hotter.
Probably so.
I returned again for various spells most summers between ’77 and ’80 if I remember correctly.
Spent a lot of time in the water 🙂
I also lived there 1983-5, but so what?
Geoff S
This is a great example of simple trending that averages with no smats cause. It doesn’t take an AI to see the following is more accurate.
Something changed about 1960 – 1962 that changed the values being recorded. A simple linear regression is going to give a false value as to the actual growth. There is little to no growth either before or after the change, but simple averaging would certainly bias the result to warming.
It is one more reason to not trust the method of calculating a GAT in the current environment. It is why time series analysis requires data to be stationary, that is, constant με and σ.
Calling the difference a “bias” is a quick solution to statisticians but it isn’t scientific. One or the other should be deemed unfit for purpose and discarded. If you can’t claim a long record after doing that, so be it, deal with it.
Jim,
There was a site change in 1965 to the airport. I did a similar graph by adding 1.5C to pre-1965 and then wrote the comment in the article that the size of such adjustments is not now knowable.
Geoff S
It is knowable. Data before 1965 is from Regional Office, and that continued to 1991. The mean of the top decile (10%) of maxima, which is the nearest thing to a heat wave stat that they have, for the period 1961-90 was 38.2C for the RO and 38.5C for the Airport. Airport 0.3C warmer.
Nick,
It is not now knowable because we do not have any actual measured data to support it. Even if we had thermometers at Regional Office and Airport for an overlapping period, any figure of difference cannot be extrapolated into times when there is no overlap.
You mention a site difference of 0.3C. Jim Gorman’s graph just above shows his estimation of a site difference of some 4C. Which one do you choose for “adjustments”? They are rather different, but both seem “valid”.
All we have to work with is subjective interpretations. These interpretations are what leads to the propaganda aspect of Establishment articles and its criticisms. Geoff S
Geoff,
“It is not now knowable because we do not have any actual measured data to support it.”
We do. We have a near 30 year period of overlapping measured data between Perth RO and Airport.
So what? You *still* don’t know what the biases at those stations might be so how can you accurately size an adjustment? Hubbard and Lin showed in 2007 that station adjustments must be done on a station-by-station bases because of different microclimates. Why does no one ever read their studies?
You miss the entire point. WHAT IF THERE IS NO BIAS IN EITHER STATION?
Different measurement devices deliver different values, period. A low impedance voltmeter will give a different value than a high impedance voltmeter. Is that a bias? No, they are simply different readings. A low impedance can be very precise, that is, give repeatable measurements. It can be calibrated. The readings are consistent and accurate, just different.
There are so many uncertainty categories in a different microclimate one simply can’t judge whether a bias is at work or not.
The very first thing one needs to do is to determine if one or the other is calibrated correctly. As Geoff says, that is impossible. You can not assume that is the case.
Your observation on the step change in this data set is not unusual for Australia.
There is nothing that the BoM produce that is useful for analysing climate change. Satellite observations are superior to identify the trend changes.
Urban gauges suffer from changes in adjacent land use. Most rural stations have been relocated tio airfields and suffer from influences of air traffic.
Most stations are now automated using electronic instrumentation. These do not have comparable damping with LIG thermometers.
The data produced so far this century may be sufficiently consistent to identify climate trends by the latter half of the century. It should now be difficult for the BoM to fiddle with the data being produced by the automatic stations but where there is a will there is a way..
Rick,
Re airport stations, I would be happier if someone produced ballpark figures to show whether or not the quantity of fuel combusted in a day by aircraft movements is capable of changing the air temperature by a measurable amount. I started to gather data on this a decade ago, but got warned off by a Fed authority who (responsibly) considered I might be planning a terrorist act.
Nick Stokes, maybe your CSIRO connections might get a better chance.
Then, another study is needed, to measure air temperatures at various geometries ahead of and behind an actual jet engine in airport simulations. My gut feeling is that this airport contamination issue is over rated and might prove insignificant.
I am ashamed that our BOM did not settle this years ago before the large movement of thermometry to airports. Maybe they did, but I have not been able to find references.
You other comments are spot on with my thoughts. Geoff S
Nick,
Read my lips.
There is no cherry picking of stations.
The good, the bad and the ugly are tossed into the mix so all can see how good is good, how ugly is ugly. Geoff S
Geoff,
The choice of stations you have recorded is fair. But you have displayed here the best cases
No, Nick,
I have NOT presented best cases.
Started with a list of stations with longest records. I discarded some with much missing data. Was restricted to stations also chosen by BOM for ACORN-SAT. As stated, after 6 State capitals, I added Darwin and Alice for coverage. For low-UHI, I chose Longreach for inland station with long record and Cape Leeuwin for long record, coastal and better quality potential because no site moves.
I knew that some comments would mention cherry picking, so I did not do it, especially when I accuse The Establishment of blatant cherry picking.
It is not a matter of making a fair choice (your words) but a matter of conducting proper science. Geoff S
The good folk in Perth WA obviously haven’t built enough of those apotropaic structures that magically protect from weather extremes.
You have a problem with this methodology but see combining northern hemisphere temps with SH temps for a global average? Where coastal temps are combined witj inland temps? And on and on …,,,
Perth…”up 3C” Lol.
population in1900 – 27,000
population in 2020 – 2,000,000
UHI effect showing up nicely in your chart.
Typical WUWT. There isn’t any warming, and besides, it is UHI.
Perth UHI is similar to Adelaide.
Typical moronic statement. Every major city must perforce have an increasing UHI with increasing population. Eg., Tokyo has gone up 10C degrees if memory serves. If it isn’t registering in the data it is not because it isn’t there. And what do you mean by ”there isn’t any warming”? Where are you talking about? The only place to measure warming is from pristine rural sites or over the middle of the Pacific.
“Tokyo has gone up 10C degrees if memory serves.”
It doesn’t.
It’s ~ 3C…..
Japan 1898 to 1946… basically no warming.. Yet Tokyo warms… Urban heat
This could have been one comment with one combined graphic.
Then a slight step around 1950 and nothing from1950-1990
Tokyo warming .. more urban
Then the 1997/98 El Nino caused a slight shift, and from 1998-2018… No warming in Japan
“The only place to measure warming is from pristine rural sites or over the middle of the Pacific.”
Eh?
There are 1000’s of pristine sites all over the world!
And in the US USCRN has some.
Here for instance …
“To ensure a more stable set of measurements going forward, NOAA began developing a U.S. Climate Reference Network (USCRN) starting in 2001. The USCRN includes 114 stations spaced throughout the U.S. that are well sited and away from cities. “
https://www.theclimatebrink.com/p/the-most-accurate-record-of-us-temperatures.
No difference.
ClimDiv is homogenised to match “pristine” rural sites at the regional level.
Of course it ends up pretty much the same.
I have done deep studies of 35 Australian stations selected for remoteness and a low chance of UHI. I was looking for factors that could be used to say “this station is pristine, that station is urban.” No such factors emerged. The temperature/time trends for both my putative pristine and urban stations were all over the place and without many easy patterns like all of them showing a rise or fall in a season or a year or a decade. It is possible that these Australian stations have more noise than than the designed US high quality network.
Geoff S
Based on? Adelaide population2024 1.6m, Perth 2.1m. So UHI doesn’t increase over 1.6m? 😉
After seeing references here about using AI I thought I would try Copilot. I’ve studied Topeka, KS, Forbes Airport rather well. So I asked what the warming was. It came back with an answer of like +0.2/decade after 1960. So I asked why. Basic CAGW claptrap. I then asked which warmed more maximum or minimum. I had to use the thinking deeper option. I was surprised that it said Tmin. I asked why Tmin would warm. Same claptrap. I then asked about what effects of a raised Tmax would be. Same old reasons, crop failures, more deaths etc. So I asked what effects from a rising Tmin would occur. Same stuff, crop failures, etc.
That’s where I quit as it was late. I’ll pursue more later. My big take away was that it admitted that Tmin was warming while Tmax was not.
“Note 2: Many Australian weather station temperature results (not heatwaves) have been examined in detail by colleague Dr Bill Johnston and reported on his Bomwatch blog. By correcting for a physics-based influence of rainfall, he has deduced that most Australian stations show essentially no warming over the whole period of their observations. It should follow that heatwaves likewise have not shown increases or decreases.”
The most obvious meteorological reason why warming is suppressed at the stations you list is that (apart from Alice and Longreach) they are subject to afternoon sea breezes.
You therfore need to look to historical changes to SSTs offshore as the main moderator of max temps.
Cape Leeuwin is particularly exposed to the ocean.
Go on with you, Anthony.
Here I was thinking that Cape Leeuwin was just a bit north west of Kalgoorlie.
Now I understand why they named it Cape Leeuwin.
Probably better to look at sites like Deniliquin
bnice,
Probably better to look at the 160 graphs that are the subject of the article?
Geoff S
or Echuca
or Amberley
or Rutherglen
Banton,
I do not NEED to do any act you suggest.
This includes the frivolous diversion.
Geoff S
If you knew anything about meteorology Sherrington, then it would be blatantly obvious that it is very far from a “frivolous diversion”.
In fact it is vital to the reason that Leeuwins temp term is low.
How about you learn some met and incorporate it into your *analyses*.
Rather than have a go at me for pointing out what should be obvious.
Maybe it was you that brought up the ridiculous example of McQuarrie Isle as well, which has its temp entirely modulated by the ocean SST to the west.
You mean , rather than focussing on “totally-unfit-for-any-purpose” inner-city urban-tainted junk sites, like Melbourne, Hobart, Sydney etc. ?
Banton – Are trying to argue the sea breeze in the late 1900’s cooled the temps, but did not cool the temps in the early half of the 1900’s
I would seem the level of cooling from the sea breeze would be reasonably consistent.
“Are trying to argue the sea breeze in the late 1900’s cooled the temps, but did not cool the temps in the early half of the 1900’s”
No.
I am saying that te sites sherringham chose are not representative of temp trends inland ( Oz is after all a continent !!) – yet he provides just 2 that are and 6 afflicted by pm sea-breezes.
As a matter of interest, how far inland are sea breezes likely to be a factor?
BoM has a wind map, which may be useful.
Banton,
The 10 stations I analyse were chosen as described, based on length of historic data, low missing data and also having ACORN-SAT adjustment with good national coverage, a balance between coastal and inland (imperfect) and lack of station relocations (Cape Leeuwin being a very rare example of no large station moves).
Selection criteria did not include sea breezes. Also not included were altitude (lapse rate), latitude (cooler with distance from Equator), airport station or not (possible warming from aircraft fuel combustion), local population (UHI possibility), condition of Stevenson screen (Anthony Watts measured T change with different and aged paint, whitewash), ground cover (grass different to gravel), LIG thermometer creep (see Pat Frank paper), sensor response time (integrated T values lower than spot T values), religion of observer (some stations omit Sunday observations) and dodgy practices (Sydney has a month of identical daily Tmax and Tmin in different years), to name but a few causes of differences from ideal.
Why, for Heaven’s sake, did you thread bomb here about sea breezes? Did you intend to make me seem dumb, or is it you who is dumb?
Geoff S
“Selection criteria did not include sea breezes. ”
As I said that is a massive fail.
A sea-breeze has a big influence on max temps.
Have you not been to the coast on a hot day from inland and gone through the sea-breeze front?
Do it if not.
And watch your car thermo fall !
It beggers belief to me that you do not know of the consequences.
Your lapse rate uncertainty is specious, but that is one way of determining a sea breeze. It has a LR that was formed to a height of (usually) 1000-2000ft and comes to the surface at a cooler temp than the displaced heatwave LR would have.
(bearing in mind there would be warming as the flow gets further inland)
“latitude (cooler with distance from Equator)”
Especially silly.
“Why, for Heaven’s sake, did you thread bomb here about sea breezes? Did you intend to make me seem dumb, or is it you who is dumb?”
Because I am a (retired Met man) and am professionally and personally aware of the massive effect one has on a max temp as compared with a location that does not get one.
That’s why!
So I suggest you look up sea-breezes either online in a met text-book.
And cut out the insults as well – else I may just cast aspersions on your…..
“Background of senior management in large resources coprporations (mining, forestry, manufacturing). Chemistry major.”
I think meteorology is a tad more pertinent to the matter at hand.
Oh, and BTW:
“Did you intend to make me seem dumb, or is it you who is dumb?”
Depends if you have any met knowledge/prof experience.
So that makes you the dumb one.
You’re welcome.
https://www.noaa.gov/jetstream/ocean/sea-breeze#:~:text=The%20sea%20breeze%20circulation%20is,ocean%20at%20the%20same%20rate.
And here I have found a study of sea breezes at Darwin …
“During the dry season, Darwin frequently experiences what appear to be two distinct seabreezes. The first sea-breeze front passes around midday and the onset of what has been interpreted as the second sea-breeze occurs in the late evening.>..”
The temperature trace is bottom left.
Note the passage of the SB front at 12:30 accompanied by an ~ 3C dip in temp.
Notice also the rise in RH (the air is maritime in origin).
In this particular example we see the SB returning and bringing the interior airmass back in the evening (21:30), it have picked up WV content.
https://www.semanticscholar.org/paper/Darwin's-mid-evening-surge-Thomsen-Smith/ca47ffb769c00de4670cdd0c01452cd9e3fc5d1c
“sea-breeze has a big influence on max temps.
Have you not been to the coast on a hot day from inland and gone through the sea-breeze front?”
All you are doing is highlighting how bad temperature is as a metric for climate.
The ocean is a moderating factor for temperature whether the breeze is on ir off shore. Convection impacts insures that.
In addition on-shore winds affect humidity. If enthalpy remains the same (as it probably does) increasing humidity would tend to lower temps. But *climate* is more tied to enthalpy than temp.
All you’ve done here is affirm that all the temp data, be it land based or satellite, is unfit for determining climate on a local, regional, or global scope. My guess is that was NOT your intent.
Why, for Heaven’s sake, did you thread bomb here about sea breezes
Geoff,
His main thrust is to attempt to refute accurate analysis of temperature. Little does he realize his solution has no stopping point. What comes after elimination sea breezes? Eliminating different shelters? How about surrounding land use? Those above a certain altitude? Airports?
Temperatures are what they are if not affected by artificial influences like UHI or station changes. If you eliminate land stations close to oceans around THE GLOBE, can you really call the GAT global. If the oceans are a moderating influence should oceans be included at all in a GAT?
´
Typical J Gorman response:
It is amazing to me how you can (without fail it seems) disappear down a rabbit-hole of irrelevancies.
A SB where it occurs before the normal time of max temp (usually around 3-5pm in summer).
Then the max will NOT attain the value it would have if the SB had not materialised.
I show an example (Darwin) above where it dropped by 3C on passage.
Yes, yes Jim it is all so, so uncertain.
I mean, we have gotten nowhere with science this last 150 years as a result (sarc).
So what! Temperature measurement is about WHAT DID OCCUR, not what “value it would have if the SB had not materialised.”. Unless the SB is a one off occurrence, it’s effect should be used.
It should not be “adjusted” but if necessary, call it an outlier and discard it.
You may as well say the temps in Kansas shouldn’t be used for the first part of January because of the low pressure front that brought such cold temps. Just ignore the fact that the cold “sea breeze” we saw is typical winter weather.
Maquarrie Island is a superb example to show what, if any, atmospheric shift in temperature there has been. Go away Banton. You continue to make a fool of yourself.
Good.
That means I have hit home!
Look it’s just a basic.
The oceans heat the atmosphere. Correct ?
Mc Quarrie weather station is located on a tiny spit of land ….
It is totally exposed to the SST of the ocean from the west.
Here find climate stats …
https://www.meteoblue.com/en/weather/historyclimate/climatemodelled/macquarie-island_australia_2159161
The prevailing wind is dominated with SW to NWly winds
WInd strength can also be described as fresh to strong for much of the year ….
“The windier part of the year lasts for 9.0 months, from 2 June to 2 March, with average wind speeds of more than 12.8 kilometres per hour. The windiest month of the year in Port Macquarie is November, with an average hourly wind speed of 13.7 kilometres per hour.
The calmer time of year lasts for 3.0 months, from 2 March to 2 June. The calmest month of the year in Port Macquarie is April, with an average hourly wind speed of 12.0 kilometres per hour.”
Now how’s about learning some basic met, and keep your gob shut when ignorant of it, Eh?
Port MacQuarie is on the east coast of NSW.
Macquarie Island is SW of the NZ South Island.
Your quote regarding wind seems to come from https://weatherspark.com/y/144604/Average-Weather-in-Port-Macquarie-New-South-Wales-Australia-Year-Round
Quite funny, a total mix-up. 🙂
AB’s link also goes to “Simulated historical climate….. ” 🙂
We all make the occasional mistake.
Nut me, Old Cacky.
🙃
Thanks for pointing it out politely.
As apposed to the manner some would have.
The best one can hope for in a flame war is a Pyrrhic victory.
They can be fun to watch from a distance, though.
Thanks old cocky.
My mix-up
Actually I thought that the wind strengths were low as compared when I last looked at the data ….
“Macquarie Island has an extreme oceanic climate with heavy cloud, strong westerly winds and an average rainfall of approximately 900 mm a year. Temperatures are much milder than the continental stations with the averages above freezing and ranging between 3°C and 7°C.“
“Temperatures are much milder than the continental stations with the averages above freezing and ranging between 3°C and 7°C. The ocean temperature of between 3°C and 5°C moderates the air temperature, with extremes recorded on the island being +13°C in January and −9°C in July and August”
https://www.antarctica.gov.au/antarctic-operations/stations/macquarie-island/location/climate-weather-tides/#:~:text=Macquarie%20Island%20has%20an%20extreme,approximately%20900%20mm%20a%20year.&text=Temperatures%20are%20much%20milder%20than,C%20and%207%C2%B0C.
Macquarie island temperatures could pretty much be treated as sea surface temperatures for the Southern Ocean, couldn’t they?
Why are you bombing my article about heatwaves with Macquarie Island, which does not have heatwaves? It is too far from sources of hot air, but unfortunately you, Banton, are not.
Geoff S
Old Cocky,
You can see that I have compassion for those who err. I did not use sarcasm or ridicule or dismissal about this positional terminological inexactitude by Banton. We all make mistakes. Why, I admitted to one and provided a correction elsewhere in this very thread. Geoff S
Why do you keep whining about the weather?
Tmin for Macquarrie island…Averages.
1982 – 3C
1992 – 3.6C
2001 – 2.2C
2003 – 2.4
2022 – 3C
Go away Banton.
Go away, Banton.
Geoff S
You to my pleasant wuwtian
Tony B
Banton,
To my knowledge Macquarie Island, a fair way along a route to the Antarctic, does not have heatwaves any more than Antarctic stations do and therefore has nothing to do with this post.
OTOH, you can see from my graphs and Tmax distributions that tropical Darwin does not have heatwaves either. It is candidate, being a coastal city, but it is rare for winds from the hot Centre to be northerlies that reach Darwin. It is often cooled by sea breezes, but that cooling is not ending heatwaves because there are none in Darwin. Its days are just moderately hot a lot of the time. Geoff S
As a meteorologist you should know about microclimates around weather stations. Warming is not “suppressed”, it is what it is.
Several years back when I became sceptical of what the global temperature was said to be, I downloaded data for 10 stations scattered over the U.S. Noth, south, East West, in the middle. When I did histograms for June and July, their distributions were all over the map. Skewed, uniform, bimodal. However, one stood out. It had a perfectly normal distribution. Guess where, Santa Barbara on the West Coast, next to the ocean.
The point I am trying to make is you and others leap to the conclusion that if temperature data doesn’t meet your expectations, you want to change it by homogenization, or infilling, or some other gyration. That isn’t what science does.
“As a meteorologist you should know about microclimates around weather stations. Warming is not “suppressed”, it is what it is.”
As (retired) met man I know exactly what I said.
A site subject to afternoon sea breezes is not indicative of temps reached inland.
I even live on a sea-breeze prone coast (at the moment), and I only have to travel 17 miles SW inland to my house to experience a common 3-5 C increase in temp.
It is a major forecasting consideration.
I live on a sea breeze coast in Texas, depending on the battle between the poles and equator you don’t have to travel that far. Even before vehicle thermometers microclimate was evident. About a generation ago we drove most of the NSW coast and a quite a ways inland in winter. OK as the book says it’s a Sunburned Country and we saw a couple of logical burns, but the Snowy Mountain had plenty of snow and based on the tracks the big kangaroos survived. Before the hype of red maps the physical Australian map showed coastal green from Victoria anti-clockwise all the way around the coast barely into Western Australia. However, the critters and a lot of the vegetation there didn’t look real except where they planted exotics in cities.
“Even before vehicle thermometers microclimate was evident. “
Correct hdhoese.
Something that Sherringham neglects.
So climate change does not effect microclimates. Is that it?
The measurement is for the sea breeze effect is at the same location. The sea breeze likely had the same cooling effect in that specific location.
Correct.
It will however cool said station before max temps would be reached BEFORE the SB.
In consequence the max temp actually reached is in the air sourced from over the ocean (at low level) and is therefore moderated to a max created in that air via the short land-track it took.
It is not a maximum that is inherent to the heat-wave airmass.
And therefore a false indication of a heatwave (on a continent afterall!) due to that airmass.
Just a basic met fact.
Again – The measurement is for change in temp at location A over the 100+ year period, Its not supposed to be a measurement of the change in temp at location A compared to location B over that same 100+ year period.
Thanks joe. Perhaps it is sinking into Banton’s thick head?
Banton,
This is getting tedious. Let us look at Melbourne ( or Adelaide) to do away with the assertion that sea breezes affect the high temperatures reached in heatwaves of various duration.
The Melbourne Top 40 CDO heatwaves reach high temperatures whose driver is the atmospheric temperature in the centre of Australia in places like the Alice Springs region. The climate of Melbourne is not the same as usual or dictated by local conditions when there is a strong North-Westerly carrying the heatwaves temperatures from central Australia to Melbourne. These give Melbourne winds that go offshore, not onshore as sea breezes do. Sea breezes have little or nothing to do with the high temperatures that invoke the heatwaves classification.
I have done correlation coefficients with leads and lags up to 10 days between T in Alice and Melbourne that support this mechanism. I have noted that Melbourne and Adelaide are further from the Equator than Sydney, 500 km north and Brisbane, 1,000 km to the north latitudinally.
Now, tell me how Melbourne obtains its heat when it has onshore sea breezes. Ridiculous of you to thread bomb with sea breezes stories. Please apologise. Geoff S
Then why does the GAT average coastal stations with inland stations with no weighting for different variances in the distributions? Are you a CAGW denier?
Lansner and Pederson showed that sites “protected from the ocean” had a distinct rise through the 1930s,40s. with 2010 a bit lower than that period.
That is a very nice graph.
When they compared to the ocean affected sites, the ocean cooling effect pre-1970 is obvious.
he has no idea what he is. he just knows that it’s his duty to be arguing against AGW sceptics because, you know…., climate change.
Yes I am.
In the sense that we have no idea (yet) as to whether it is “catastrophic” or not.
I belive the term/acronym CAGW is an invention of the contarians.
In other words you are a hypocrite. When it’s convenient to mix coastal stations with inland stations all is good. When it isn’t convenient then it is bad.
Well you’d be wrong about that too.
If it is located on land, it should be included. Simple as that.
Your rule would basically eliminate stations that had any special effects on its temperature. Why don’t you eliminate all stations that have UHI affecting it. How about eliminating any stations within about 100 miles of the coast or Class 3, 4, 5 stations that are not sited correctly.
Jim,
Here are the distributions of Tmax (similar to 1-DAY heatwaves) for the 8 major stations in this essay.

As you say, they vary from station to station.
Question is, how to understand the meaning of the variation of distributions and how to cope with it?
More pressure to declare the data not fit for purpose of climate change.
Geoff S
Of these only Darwin is close to Gaussian. The rest are all skewed, some very skewed and some not so much.
Observations:
1. The means are all over the place. This calls into question the assumption that an area “average” can be used to infill/homogenize missing data.
2. The skewness of the data would be inherited by “mid-range” daily temperatures. This makes using the mid-range daily temps in a regional or global average questionable without appropriate weighting factors being used.
“More pressure to declare the data not fit for purpose of climate change.”
Very true!
The fact that the distributions are all over the place makes one wonder if simple averaging is a proper operation.
I am at the point where you are. We need to examine individual stations and better analyze them for UHI, station changes, other problems before trying to get a total for the world.
I would certainly toss a lot of data for being not fit for purpose.
If anywhere should show warming, then surely Cape Leeuwin with its sea breezes is such a place. The sea is boiling (we’re told).
Banton,
The termination of a heatwave in a coastal city happens when the weather system changes and hot winds from desert interiors often at high velocities cease blowing to the coastal cities, from land to sea, and allow the later passage of cooler winds as onshore breezes, typically of lower velocity, blow from sea to land. The heatwaves ends when the hot winds from the interior move elsewhere. Sea breezes are not instrumental.
You cannot argue with this observation which has been observed by meteorologists and others many times over many decades. Geoff S
“Sea breezes are not instrumental.”
They most certainly are !
Denial is the modus operandii here, aided of course, by the echoes.
But your met knowledge is very much the DK kind.
You attribute a lot of knowedge that is at odds with an ex-professional meteorologist Sherringham.
And of course you are wrong.
A SB occurs at any time when the boundary layer is conditionally unstable to land temps.
It doesn’t have to be a heatwave – though of course it is more marked on such occasions.
They obviously do not occur every day, even most days, but they do enough to suppress average annual mean temps and max temps on extreme days, at locations within around 20ml of the coast
All it takes is that and a slack enough geostrophic wind that does not oppose the SB.
You are not going to rewrite the met handbook just becasue it shatters your theory of a lack of sig heating in OZ.
I’ve said elsewhere, Oz is a continent, and I know the vast majority live in the cities around the coast – but to properly determine Oz warming, you need to examine temp records in the interior.
I do know of course, that this has prob been a work in progress for you of decades, but hey ho, that’s life.
You would be laughted out of court were you to present a paper of this to any with (basic I would say). Met knowledge.
PS: did you see my post re the SB at Darwin ? (more denial no doubt)
I’m not sure why an afternoon sea breeze will terminate a heat wave. It does moderate the temperature for that day (compare Penrith and Sydney maxima), but doesn’t do anything for the next day until that day’s afternoon sea breeze springs up.
Aiui, heat waves are the result of large scale pressure systems; sea breezes are ephemeral local phenomena. During summer hot spells, Adelaide and Melbourne are stuck between a slow moving high over central Australia and a Bight or Bass Strait low. Check out the pressure systems and the resultant wind flows.
Hot spells in Sydney and surrounds are usually terminated by a cold front, with a Southerly Buster coming up the coast.
“I’m not sure why an afternoon sea breeze will terminate a heat wave.”
It doesn’t and I am not saying that.
It does as you say in your second sentence.
What’s the issue, then?
If sea breezes are normal responses to warm or hot days, how does this affect heat wave durations?
I must be missing something.
D’oh! It looks like I got that one wrong 🙁
This week’s heat wave is a central Aus low and the trailing edge of a high centred between Tas and NZ.
So the GAT needs to eliminate stations subject to sea breezes. You’ll have to make that globally to be sure weather occurrences don’t
unduly affect the GAT. How about high altitude stations that bias the warming from the lowlands.
Dude, if you want land temps, then use land temps regardless of where they are located. When you start eliminating data based on a characteristic you are on the road to perdition. Next thing is let’s eliminate this because it doesn’t fit the “global” change. Then let’s eliminate that because it is different too. Next thing you know you’ve p-hacked your way into something that shows what you wanted when you started.
There are proper ways to identify outliers. This isn’t one of them.
It’s why climate science DESPARATELY needs to move to using a matric that is physically meaningful. Temperature is an intensive property that is simply not amenable to averaging nor is it actually useful in describing climate.
When you have to use a meme like “all measurement uncertainty is random, Gaussian, and cancels” to support the use of a GAT you *know* something is wrong somewhere. When you have to calculate temperature differences in the hundredths digit from data with an uncertainty in the tenths digit at least and more likely in the units digit you *know* something is wrong. When you are using similar temperatures from Las Vegas and Miami which have vastly different climates in order to create an average temperature you *know* something is wrong.
As Geoff said, the data is simply unfit tor purpose.
For the missing days in the data set then a alternative source for information could be the weather forecast section of the quality national newspapers.
Because here in the UK along with its weather forecast the Daily Telegraph used to list the weather stats of various towns & cities from the pervious day along with its weather forecast and in this would be included the max temp for each location.
With luck a similar data set may have been included in one of the Australian national newspapers.
There’s a lot of weather history in newspapers. A valuable source!
Yes l think they contain valuable information that would otherwise have been lost.
Taxed,
Been there, suggestion rejected.
There is enough noise in the data from the best of these stations, without adding the variability of newspaper reports whose thermometer locations are often unreported.
I have a big thick book of 150 years of reporting from The Herald in Melbourne where I now live. Tried to find a value for it in this exercise, but failed.
Missing data in these graphs in most cases is 500 days or fewer in total. ACORN-SAT graphs 1910 to 2024 have 40,000 days or so, so missing days are a computer tidiness topic more than a statistical one. Geoff S
The Earth is still in a 2.5 million-year ice age named the Quaternary Glaciation that won’t end until there is no more ice on Earth. Currently 90% of the fresh water is locked away in ice.
The Earth is in a cold interglacial period named the Holocene that alternates with very cold glacial periods. The interglacial periods seem to last about 10-20,000 years while the glacial periods seem to last about 80-90,000 years.
https://en.wikipedia.org/wiki/Quaternary_glaciation
GS – good Job
always best to cross check the data with the original source data.
One particular commentator and the “science” based website Skeptical Science (aka – the anti science website) makes frequent responses not to even look at the raw data.
Many Australian weather stations are totally unfit for measuring the change in temperature over a period of time.
“The chosen cities probably suffer from the temperature distortion of Urban Heat Island effect.”
Ellerslie Rd Hobart is probably one of the worst possible sites to measure temperature
Here is site (oriented N to top).. surrounded by roads, buildings and a newer block of flats overlooking it on the SSW
Another excellent post where yet again the climate alarm claims do not withstand scrutiny. As a general observation, almost none ever do. A couple of other big picture examples, that do not depend on sometimes iffy surface temperatures.
Thanks, Rud, I value your comments. Geoff S
Rud – you comment reflects the fact the Climate Science Experts rarely consult actual experts in those fields.
Nice Geoff! I think as more and more people begin to look at the piece parts of actual temperatures that make up the so called GAT, we are going to find that spurious trends are being generated by the averaging,, weighting, and homogenization of temperature data. Averaging non-stationary time series is asking for problems. The means and σ’s are not constant.
The measurement uncertainty, if properly propagated, makes values to the one-thousandth or even one-tenth unreliable. The combined uncertainty is so large, there is no way to know what the value should be, let alone knowing the sign.
Surely you’re not implying that the probity, provenance and prosecution of GAT ‘data’ are compromised, Jim?
The GAT is based on the best “science” that (taxpayers’) money can buy.
Jim,
You can see that I have not dived into interpretations of this big lump of data. I am hoping that readers will get involved in that. There is a story in how standard deviations (for example) vary with station, with both natural and observer variation but in the end, we are stuck with that metric unless we want to get into the adjustment game.
My current emphasis is on the claims of The Establishment. Geoff S
And here is the road view showing that block of flats with its massive glass windows that will reflect the sun down into the heat trapped weather station when the sun is at the correct angle.
This is NOT a place that should be used for “climate”
Nick Stokes,
I do not know the author of the art work atop this article, but it seems to honour your past contributions to this and other climate blogs like Stephen McIntyre’s Climate Audit. It was McIntyre who named you “Racehorse” and I see this reflected in the imaginary kangaroos crossed with greyhounds.
Perhaps I am odd. Cheers. Geoff.
I found this cartoon from Josh. 🙂
Reminds me of a kids joke:
What do you get when you cross a sheep with a kangaroo
A woolly jumper.
(may not work in all language domains)
Ho ho, works in my Ocker. Geoff S
With Alice Springs, you have to make sure you are not using the BoM “adjusted” data
Good morning Geoff
Congratulations and thank you for your continuing long term effort with this topic. I have stopped posting so it is good to see you keeping the flag flying.
The trouble with the BOM is they keep changing their definition of a heatwave. Now just one hot day is called a heatwave. And because most people are used to being in air conditioning they can’t hack it when they step outside on a decent hot day, so good old global warming gets the blame.
Thank you for your objective analysis which I know you have spent a long time on.
Best wishes
Ken S.
And thank you, Ken, for continuing to show that basically “junk” status of many Australian weather stations.
Ken,
Your blog Kenskingdom contains far more work than I have done.
It contains articles, for example, on the mismatch of CSIRO data from official Australian Year Books from the 1950s, with the current “accepted” temperature record. You and colleagues tried to get recognition of the mismatch, but the wall of silence descended again and it remains unexplained. Geoff S
Matches?
We doan need no stinkin’ matches.
Ken, I’ve began wondering that if the definition of “a woman” is ever settled, then maybe “climate science” can move on to what the definition of “a Heatwave” is.
(but I’m not getting my hopes up 🙁 )
WIKI….A heat wave or heatwave, sometimes described as extreme heat, is a period of abnormally hot weather generally considered to be at least five consecutive days.
BOM…A heatwave is when the maximum and minimum temperatures are unusually hot over 3 days.
NOAAH…A heat wave is a period of unusually hot weather that typically lasts two or more days
India… If above criteria met at least in 2 stations in a Meteorological sub-division for at least two consecutive days and it declared on the second day.
CSIRO…heatwave defined as a heat impact event (I guess you can just pick your own length of time)
TV news…. 6 hours
Let us not forget that UK met office no longer use the WMO definition, they have changed it in 2018 to:
“A UK heatwave threshold is met when a location records a period of at least three consecutive days with daily maximum temperatures meeting or exceeding the heatwave temperature threshold, dependant on location.” (currently that is just 28ºC max, including cities and airports, and ‘heat spikes’ that can last a matter of seconds that liquid thermometers would never have recorded)
https://www.metoffice.gov.uk/weather/learn-about/weather/types-of-weather/temperature/heatwave
Thanks for this, Goeff. Nice work. I am a bit surprised that the current global temperature spike doesn’t show up in your analysis. The spike does show up in the UAH temperature data pretty much everywhere.
(updated image to include latest data)
Robert,
2024 does report in the TOP 40 CDO of many of these sites, though not particularly strongly. With more care, I could have labelled the years better because at the moment the straight Excel version does not always make it clear if the last year shown is 2023 or 2024. It is a casualty of making 160 graphs with uniform axes, it gets so boring doing it in the simplest way so that others can do it themselves without writing software. Geoff S
Don’t know about that Geoff. On the news, one hot day is now described as a wave so they are becoming shorter!
BOM is a BIG part of the problem.
Having lived in Melbourne for all of my life, I really don’t see any change, except that most media channels now refer to a heat wave as 1 day over 35C. Used to be a few days over 100F (~38C). This summer we haven’t had a day over 40C.
Happily, one mainstream TV station, rather than referring to a coming heatwave, are now saying “a period of warm weather”.
Correction by author.
This comment is in error. Please use this corrected graph.
Reply to
Jim Gorman
January 29, 2025 8:02 pm
The data I analyzed wrongly had different start dates so lumps of missing missing data played a part in the distributions. I trimmed the start for all to 1897 and the finish to end of 2014. Not exactly correct, but available.
It makes a difference to the shape of the distributions and particularly to the counts of missing data days.
Apologies. Geoff S
Jim,
My explanation of a factor affecting these distributions is that Darwin seldom has southerly winds blowing in hot aid from the Centre, while Melbourne and Adelaide do. So Melbourne and Adelaide have those long, hot tails showing in the distribution. Hobart is getting too far away from the Centre to show them much.
This old graph shows the effect.
Geoff S
Geoff, I’m sure you have investigated very well. It is obvious these conditions are not unusual. Temperature readings affected by ongoing phenomena are valid. They may increase the variance in some cases or may decrease it in others, but that is the reason for dealing with the uncertainty it causes.
I noticed AB has yet to outright say these sites should not be used due to ongoing weather conditions. He only hints that they are a problem in the data. They are not. Keep up the good work.
Jim,
You are thankfully a commenter here who understands the reality of uncertainty in measurement and in general science, probably better than I do. You display real world learning from real world experience. There used to be more of us on blogs a decade ago, but now social “science” takes up more room.
Our exploration group found over a dozen new mines. Not one was found using social science. More often, we spent valuable time fighting social science regulators. Geoff S
Thank you to all who commented except Anthony Banton aka Tonyb aka Chicken Little who ran a paperchase from one irrelevant matter to another.
There will shortly be a following article that answers some of the questions from commenters in more detail. I will put numbers next to the topics of getting “hotter, longer and more frequent”. This should help explain why I have calculated heatwaves of duration 1, 3, 5 and 10 days, to calculate if they are getting longer. The calculations to question getting hotter are very simple. An indication is already there from the lines of best fit on the 160 graphs that I reckon no reader here had the patience to wade through – hence the coming summary. Geoff S
Continued denial as expected.
Here’s another paper re sea breezes in Oz cties ….
“Cooling power of sea breezes and its inland penetration in dry-summer Adelaide, Australia”
https://www.sciencedirect.com/science/article/abs/pii/S0169809520313466
Highlights
And Sydney ….
https://www.sciencedirect.com/science/article/pii/S2212094724001026?via%3Dihub
“Typically, during summer, afternoon sea breezes keep the eastern parts of Sydney cool, but the built-up environment of the city prevents these breezes from reaching central or western parts of Greater Sydney. This results in high spatiotemporal variability of air temperatures across the city (Yenneti et al., 2020) and makes inland settlements of Greater Sydney naturally hotter than the eastern coastal suburbs. Rapid and widespread transformation of open vegetated space to sprawling settlements in western areas further amplifies baseline warming and the risk of urban overheating and extreme heat events (Khan et al., 2021). Heatwaves in inland settlements of Greater Sydney tend to be longer and more intense than in areas closer to the coast (He et al., 2020; Santamouris et al., 2017; Sadeghi et al., 2018; Steffen et al., 2019). For example, Kong et al. (2023) showed that mean air temperatures in Parramatta (Central Sydney) were up to 3.2 °C hotter than those in the Sydney Central Business District during a heatwave in 2020. Therefore, health outcomes of the aging population in the inland region are expected to be severely impacted by increasing heat (Gee and Gissing, 2021).”
And Perth ….
https://en.wikipedia.org/wiki/Fremantle_Doctor
“During summer months, the Fremantle Doctor consistently blows from the southwest along the southern half of the west coast, starting between 10 am and 3 pm. It can penetrate as far inland as 100 kilometres (60 mi), reaching York in the early evening.
In Perth, the capital city of Western Australia, the wind is named the Fremantle Doctor because it appears to come from the nearby coastal city of Fremantle, and it brings welcome relief from the summertime high temperatures.
The Fremantle Doctor often cools the Perth suburbs by several degrees, whilst nearer the coast the wind can be quite strong, often blowing between 15 and 20 knots (28 and 37 km/h; 17 and 23 mph).”
Banton,
The events you describe happen AFTER the heatwave Tmax is recorded each day and though interesting, are not relevant to my article. Geoff S
And Adelaide ….
https://rmets.onlinelibrary.wiley.com/doi/10.1002/met.1547
“A study of the long-term behaviour (1957–2007) of sea breeze characteristics in the coastal city of Adelaide, Australia has been undertaken, applying a sea breeze day selection algorithm that employed four quantitative filters based on the temperature of the sea and land surfaces and the behaviour of surface- and upper-level winds.
Despite the similarity of the daily surface wind circulation on non-sea breeze days on both sides of Gulf St Vincent, the westerly wind component of selected sea breeze days for Adelaide has been accompanied by an easterly wind direction on the opposite side of the Gulf, as would be expected.
In the last three decades of the study period, where a higher frequency of data was available, the sea breeze has been shown to start at least 4 h after sunrise and normally cease before sunset and thus was of longer duration in summer than in the other seasons. It also appears that the maximum sea breeze intensity in summer months has a comparatively stronger southerly component than in other seasons.”
Errm, it seems that sea-breezes do impact Oz cities in the summer (and therefore in heatwave events).
Moderating max temps and so mitigating the trend in any analysis of heatwave event.
So:
Mr Sherringham’s premise:
“The frequent, accepted chant is that globally, heatwaves are becoming “hotter, longer and more frequent”. This chant is not supported by the following heatwave analysis which examines 10 Australian weather stations with lengthy historic observations. This study has generated 160 graphs that are linked by weather station/city that is the main part of this article for readers to examine.”
Is, at the very least, unproven.
The above few posts are confirmation of exactly what I was saying throughout this thread.
Now there’s a surprise (sarc)
But lets continue with the self-deception …
“Self-deception is a process of denying or rationalizing away the relevance, significance, or importance of opposing evidence and logical argument. Self-deception involves convincing oneself of a truth (or lack of truth) so that one does not reveal any self-knowledge of the deception.”
And Melbourne …
https://www.abc.net.au/news/2024-02-10/australia-weather-what-is-sea-breeze-cools-coast/103450140
“A high-pressure system is ideal as winds are light which allows the strong thermal gradient to form without lateral interference from surrounding winds.
During the warmer months, high-pressure cells favour a position near Australia’s southern coastline, which, according to scientist Yifei Zhou (2022), explains why Adelaide and Melbourne experience more frequent sea breeze days— around 30 to 40 per cent, compared to Sydney and Brisbane where only 20 per cent of days have a true sea breeze.”
And Tasmania (Hobart) …
https://www.utas.edu.au/library/companion_to_tasmanian_history/C/Climate.htm
“The belt of westerly winds is established over Tasmania in winter but the mean wind speeds are strongest in spring. In winter, an increased frequency of blocking anticyclones over the Tasman Sea creates a split in the mean westerly wind pattern near Tasmania. In summer, the sub-tropical ridge reaches its maximum southern extent, the westerlies are not so dominant and coastal sea breezes are common during the afternoons.
Banton,
Among your several mistakes, a serious one is that your thread bomb comments are about effects of sea breezes on general temperatures.
My article is about heatwaves, which are a different case to general temperatures. I am quite familiar with the thread bombing examples of sea breezes and general temperatures patterns, but they are not relevant.
As I have stated, the end of a heatwave in a coastal city like Adelaide, Melbourne, Sydney is caused by the end of the usual weather pattern that gives the movement of the stream of hot air from the Centre. When these strong, hot winds move away, they allow conditions for sea breezes to happen. We are talking about heatwaves temperatures that reach a peak for an hour or so and so appear on these 160 graphs. We are not talking about the 24 hour climatology.
I have used some licence to say that Macquarie Island, the Antarctic and Darwin do not have heatwaves. The distribution patterns of Darwin heatwaves of various durations up to 10 days lack the hot tails that are so visible on the distributions for Melbourne, Sydney, Adelaide. You keep talking about distributions (not shown by me) of general temperatures, not the special case if heatwaves temperatures.
Got it?
Geoff S
Excellent answer. The codswallop he is posting just isn’t applicable to your investigation.
Geoff,
Rather serendipitously, there is a heatwave forecast for SE Aus over the next few days.
It’s a good thing that the women knocked the Poms over early 🙂
That allows for vicariously observing pressure patterns, temperatures and winds while it is occurring. – http://www.bom.gov.au/watl/index.shtml, http://www.bom.gov.au/vic/forecasts/melbourne.shtml
Those of you in the warmer spots can observe in person.
There seems to be some confusion about Perth Western Australia’s temperature measuring sites. Although there is a measurement site at Perth Airport, this was not the official measurement site.
The website: https://www.waclimate.net/perth-temperature-history.html provides a history of the official measurement sites. Summarising, these are:
1897 to 1967: A cool site on a hilltop (Mt Eliza) above Perth, so cool that early TV weather reports reported two daily temperatures – the official cooler one, and the actual temperature in Perth CBD.
1967-1992: East Perth, a warmer location, but still cooled in the summer afternoons by the “Fremantle Doctor”, sweeping up the river from the Indian Ocean.
1993 to present: Mt Lawley, the warmist site, inland, close to a busy road and away from Perth CBD.