Guest Post by Willis Eschenbach
I noticed that WUWT has a recent post about an interesting study that has identified the mystery huge volcanic eruption in 1831. Turns out that it comes from a volcano named Zavaritskii on an island in the Northwest Pacific between Japan and Russia.
It’s an impressive scientific achievement, and the authors deserve recognition for solving such a long-standing puzzle.
However, I busted out laughing when I read the underlying study in PNAS, entitled The 1831 CE mystery eruption identified as Zavaritskii caldera, Simushir Island (Kurils).
What made me laugh was their claim that the volcano caused a global temperature drop of 1°C (1.8°F, aka “Nearly Two”). I’ve looked at lots of volcanic eruptions. There are links to my research on eruptions and temperature here. I have found that there is no consistent response in the global average surface temperature. I thought “This should be interesting”. I looked at the study to see what evidence they have.
They use the Berkeley Earth land-only temperature data to verify their claim … the problem is that even using their methods, the Berkeley data doesn’t support their claim. The image and the caption in Figure 1 below are from their study.
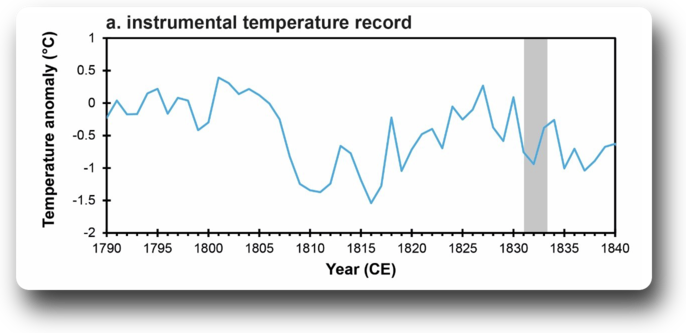
Figure 1. ORIGINAL CAPTION: Figure S1: Time series of instrumental temperature anomalies spanning 1790–1840 CE. The period 1831–1833 CE is shaded grey. Instrumental temperature records are from Berkeley Earth [www.berkeleyearth.org, (8)] and show estimated global land average temperatures. These represent annual temperature anomalies relative to the 1790–1807 CE mean (a period without major volcanic eruptions).
Squint as I might at Figure 1, I’m not seeing the 1°C temperature drop post-1831. Not even close.
Plus, the Berkeley data is monthly, but they’re using annual averages. This is throwing away a bunch of valuable data.
So I decided to take a proper look at the temperature record of all the major volcanic eruptions for the last two centuries. This eruption information is kept by the Smithsonian Institute in their Volcanoes of the World database. I used only the largest volcanoes, those with a Volcanic Explosivity Index of 6 or more. Here’s that record, compared to the same Berkeley Earth temperature dataset used in their study.
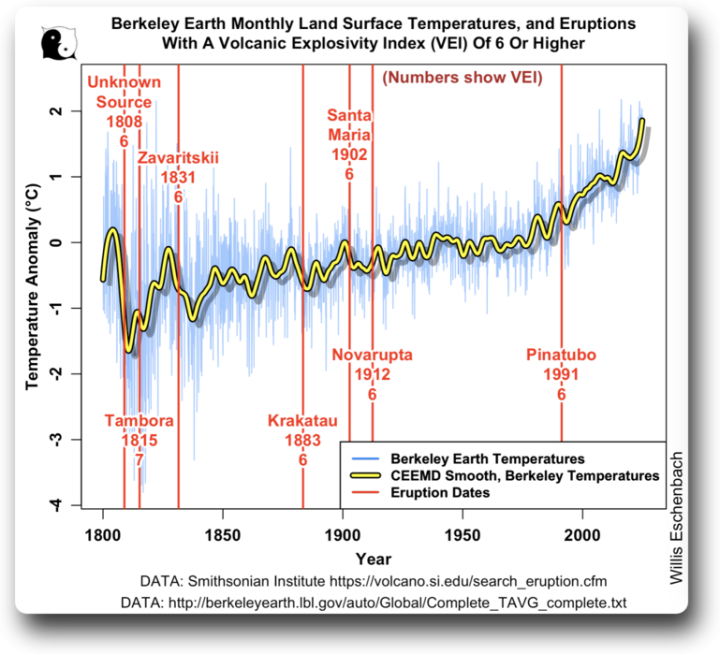
Figure 2. Large volcanic eruptions and the Berkeley Earth global monthly land surface temperature anomaly record.
Here’s the curious part. Of these 7 large volcanoes, there’s only one that is followed by a clear drop in temperature. That one is Pinatubo, the poster child for the claim that eruptions affect global average surface temperatures. All the rest of these big volcanoes show nothing anomalous. Even the two biggest eruptions, Tambora 1815 and Krakatau 1883, were not followed by global cooling in the Berkeley Earth record. Temperatures actually rose after each of those eruptions.
Anyhow … that’s why I laughed when they said they’d found a 1°C (1.8°F) cooling resulting from the 1831 volcano. I didn’t even have to look at the record above to know the chances were small that a large effect would be visible.
And in the event, Figure 2 shows the Zavaritskii volcano occurred halfway through a cooling period, and the cooling post-volcano and pre-volcano are indistinguishable.
I say that this lack of temperature response to eruptions is explained by my hypothesis that a variety of emergent phenomena work to thermoregulate the earth’s temperature. In particular, when temperatures fall due to say eruptions injecting aerosols into the stratosphere, the climate responds inter alia by cumulus cloud fields and thunderstorms forming later in the day. This allows more sunshine to be absorbed by the surface, which opposes the volcanic cooling.
For a different look at this question of temperature changes due to eruptions, I took a look at the UAH MSU satellite-based atmospheric records. Figure 3 shows eruptions and the temperatures at four different atmospheric levels from the top down—stratosphere, tropopause, middle troposphere, and lower troposphere.

Figure 3. UAH MSU satellite-based atmospheric temperature anomalies, in order of altitude from highest (top panel) down to lowest (bottom panel). Red lines show the dates of eruptions with a Volcanic Explosivity Index (VEI) of 5 or more. Numbers following the names show the VEI of the eruption.
Now, this shows the curious nature of the atmosphere—there is very little correlation between stratospheric temperature anomalies (top panel) and the rest of the lower atmosphere (lower three panels). There are clear indications of the 1982 and 1991 volcanoes in the stratosphere … but by the time that works its way down to the lower troposphere, the situation is quite different. There, only the Pinatubo/Cerro Hudson pair shows a temperature drop following the eruption, and even that is not visibly different from a number of other temperature drops during the period.
And by the time the effect of the eruption-injected stratospheric aerosols makes it down to the surface, we get Figure 4.
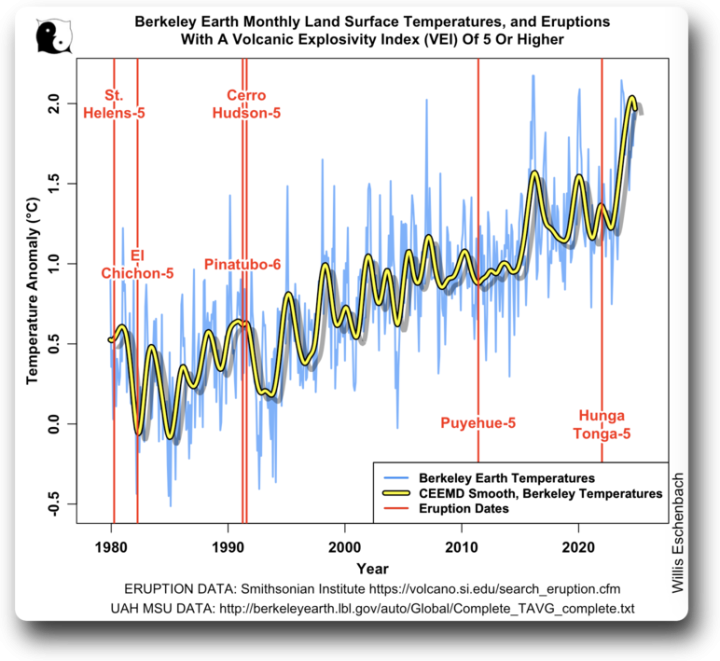
Figure 4. A closeup of the recent end of the data shown in Figure 2, with additional eruptions. Vertical red lines show VEI 5 and VEI 6 volcanic eruptions during the satellite era along with the Berkeley Earth global monthly land surface temperature record.
If the Mount St. Helens eruption caused the subsequent cooling, did the El Chichon eruption cause the subsequent warming? Once again we see the ~0.5°C temperature drop after Pinatubo, but other than that, there’s no clear indication that eruptions affect the global average surface temperature.
Yes, I know that this goes against the revealed wisdom. That wisdom says:
Eruption –> Stratospheric SO2 Aerosols –> Increased Albedo –> Less Sunlight –> More Cooling
Sounds logical, but it ignores the fact that the climate is a dynamic system that is constantly changing and adapting to a variety of forcings and factors. The revealed wisdom stops too soon. I say it goes like this:
Eruption –> Stratospheric SO2 Aerosols –> Increased Albedo –> Less Sunlight –> Cooling –> Delayed Formation Of Daily Tropical Cumulus Cloud Fields –> Decreased Albedo –> More Sunlight –> Less Cooling
plus
Eruption –> Stratospheric SO2 Aerosols –> Increased Albedo –> Less Sunlight –> Cooling –> Delayed- or Non-Emergence Of Daily Tropical Thunderstorm Formation –> Decreased Thunderstorm Cooling –> Less Cooling
Both of these emergent phenomena, the daily appearance of sunlight-reflecting tropical cumulus cloud fields and cooling thunderstorms, work to oppose the cooling action of the volcanic stratospheric aerosols, and to prevent large swings in the global surface temperature.
I provide interesting evidence for this hypothesis in my post below.
Sunshine here today, thin, but sunshine nonetheless. I’m going for a walk.
My warmest regards to everyone,
w.
AS ALWAYS, I ask that you quote the exact words you are discussing. This keeps misunderstandings to a minimum.
FURTHER READING: In the post below, I use the “stacking” method to compare the temperature response after volcanic eruptions.
In brief, we don’t know what effect volcanic eruptions have on temperature, if any.
Not sure if it’s just me or my browser, but I can see all of your figures except Figure 3. Just a blank box.
Curious. Fig. 3 comes up fine for me.
Go figure …
w.
Just returned to this post and it’s now popping up for me, too. as you said…Go figure…
Could be slow download at times, graphics tend to be last.
Whoops, sorry. Meant to respond to Willis.
At least they assume cause precedes effect with regard to volcanoes.
That seems to be the case.
The Human-caused Global Cooling fans are not going to be happy.
We do for large tropical eruptions. BEST however is not fit for this or any other purpose.
This is true.
And how are we supposed to know temperature at all back some 2 centuries when the temperature records are known to be totally inaccurate anyhow??
Anything goes 100 years ago +/- 3-5C.
Tell me, what exactly happens when a volcano explodes when it is completely covered by water?
See the Tonga-Hunga explosion as the only modern example. The megatons of water getting blasted into the stratosphere had a curious effect—the stratosphere didn’t warm, but the lower levels and the surface did. Why? Unknown … always more to learn.
w.
We will learn more this year from this, perhaps not so much about weather effects, but rather on forecasting eruptions.
https://www.sciencenews.org/article/scientists-undersea-volcano-eruption
Scissor, I believe this is a shield volcano, so it likely won’t be a violent eruption. It last erupted in 2015.
Willis,
The water blasted into the stratosphere did not travel through a pipe, which would have transported 100% of the water to the stratosphere. I have seen no estimates of the mass of that water which “peeled off” the plume into the troposphere as the plume passed through. However, the increase in tropospheric temperature after the eruption would suggest that a lot of the water did.
(from Hunga Tonga) “the stratosphere didn’t warm, but the lower levels and the surface did”
WE
Baloney Alert
That statement is false
There are no data to show any unusual warming of the troposphere caused by Hunga Tonga which would have been strongest in the month or two after the volcano.
There have been conservative Nutters claiming the volcano’s warming effect had an imaginary, mysterious 17 month delay until June 2023 … when an El Nino just happened to begin.
The likely reason no warming was detected after the volcano is the 10% increase of stratospheric water vapor was only a tiny 0.1% increase of TOTAL atmospheric water vapor.
Thanks, Robert. Is the eruption of the Hunga Tonga volcano related to the succeeding warming? You’re right, there’s no direct evidence that it is. However, it’s the only large anomaly preceding the change …
Always more to find out.
w.
Reduction in aerosols and El Nino were large anomalies that preceded the change.
Baloney alert. How the hell do you know?
I suspect that HT and its associated volcanic activity in the area, added a lot more energy to the oceans than previously thought… Get this from looking at the dip in Antarctic sea ice.
The Pacific Gyre goes right past the HT region and feeds down to the Antarctic.
The extra energy may also have triggered the earlier than usual El Nino event. This energy would not have shown up in the ENSO 1,2,3,4 region, but was further west.
Then, the extra stratospheric H2O moved to the upper latitudes of both poles over time, this WV would slow the escape of energy from the system.
“Tambora 1812” was in 1815 and brought New England’s “1800 and froze to death” to our corn crop in 1816.
You are correct that its main/largest explosion occurred in 1815, but the eruption apparently began in 1812.
Thanks, Rick. Scissor is correct. However, I’ve changed the graph to show the date of the main eruption rather than the start.
And the changes caused by Tambora seem to have grown larger with each retelling. See my post, Missing The Missing Summer, for a look at the actual temperature records from that time.
Regards,
w.
Yes, we’ve been through this before, See our dialog at
https://wattsupwiththat.com/2016/06/05/summer-of-1816-in-new-hampshire-a-tale-of-two-freezes/#comment-1794432
You looked at average temperatures, I looked at events, including NH’s 100°F temperature in June.. Our stances are not going to change, so be it.
As for each retelling, most of my post was from the NH governor’s weather log in 1816. I attempted to fairly comment on his log without retelling the story.
Once again, a superior post, WE. Yet another demonstration of your thermoregulation via emergent phenomena ‘hypothesis’. You have in the past posted dozens of others.
Your only problem is it shows ‘climate science’ is just wrong at a very basic level. That is a very inconvenient truth, to borrow a famous phrase.
The thermoregulation via emergent phenomena is clearly false. The world is warming and has been doing so for the past century. The UAH temperature trend for the last 45 years is 0.15C/decade and the earth is about 1.5 degrees warmer than pre-industrial temperatures. So when will these emergent phenomena kick in and start cooling the planet?
Izaak, embrace the power of “AND”. See my post below, entitled “Slow Drift In Thermoregulated Emergent Systems.
https://wattsupwiththat.com/2013/02/08/slow-drift-in-thermoregulated-emergent-systems/
w.
But these emergent phenomena don’t seem to work over any timescales. Summer is warmer than winter across most of the global so clearly the effect of any emergent phenomena is either too slow or too weak to counteract the effect of the earth’s tilt. And over a decadal timescale the earth is currently warming at 0.15C/decade so again there is not evidence that emergent phenomena are having any effect?
Looking at your CEEMD trend line in figure 2 seems to show that over the last 200 years the temperature has consistently risen and if anything the increase is accelerating while any fluctuations are getting smaller and smaller. There is no sign in that graph of any emergent phenomena having any obvious effect on the temperature.
So over what timescales do such effects work?
Izaak, despite monthly temperature swings of 15%-20% or so and even larger daily swings, over the entirety of the 20th Century the global average surface temperature only changed by about two-tenths of a percent.
You’re free to believe this is accidental. I say it is strong evidence of thermoregulation.
Here’s another example. The total TOA albedo is set in large measure by the number and reflectivity of the clouds, which changes on an hourly, daily, and monthly basis. In addition, because it’s mostly ocean, the surface albedo of the Southern Hemisphere is much smaller than that of the Northern Hemisphere.
But despite all of that, the albedo of the two hemispheres is quite similar. In fact, in 70% of the months, the hemispheric albedos are within 0.4% of each other. The effect of the clouds is to totally negate the difference in the surface albedos of the two hemispheres.
Again, you’re free to believe this is accidental. I see it as evidence of active regulation.
Best to you and yours,
w.
Willis, you state that “over the entirety of the 20th Century the global average surface temperature only changed by about two-tenths of a percent.” Now the question is whether or not that temperature shift needs to be explained or not. If we agree that this shift is real then any active regulation system isn’t working on a timescale of several decades and/or isn’t good enough to control the temperature to within 0.2%.
And you also admit that the monthly temperature swings are about 10% which again provides strong evidence against your emergent phenomena thesis. Your emergent effects are based around the daily timing of cloud formation which means that they would work on a timescale of weeks and so if they existed should be able to stop seasonal temperature changes (since they are local and respond to absolute temperatures). So looking at your graph it would seem that such effects don’t exist anywhere outside the tropics. But the tropics are also the regions where the solar intensity is most constant and so the lack of seasonal variations can be largely explained by the near circular orbit around the sun and the tilt of the planet. Which gives little room for any emergent phenomena to act.
As I pointed out, the cruise control in a car keeps the speed within 4% trough to peak. And when I go up a steep hill it goes lower than that, and when I go down a steep hill it goes faster.
You say:
“If we agree that this shift is real then any active regulation system isn’t working on a timescale of several decades and/or isn’t good enough to control the temperature to within 0.2%.”
You seem to think that the cruise control “isn’t working” because it can only keep the speed to within 4% …
In addition, you seem to think that thermoregulation means that the globe would be at the same temperature day and night and month to month. I see no reason to believe that, any more than I think that a cruise control that can’t deal with steep hills is nonexistent.
Next, if there are no thermoregulatory mechanisms, how do you explain the fact that the Pacific Warm Pool never goes over ~30°C? There’s plenty of sunshine available. And the effect extends far beyond the tropics. See my post “Argo And The Ocean Temperature Maximum“.
Regards,
w.
Willis,
the question is not whether thermoregulation systems exist since clearly they do. The issue as far as I am concerned is over what timescales they work and how strong they are. To use your analogy a cruise control system that keeps the speed constant with 50% would be so useless as to be worthless. Similarly one that worked with a one hour time delay would also be pointless.
But given that the average temperature of the earth varies by about 4 degrees over the course of a year we can ask a question about what role any thermoregulation system plays in that. Now without any emergent effect how much would the the tilt of the earth and the larger amount of land in the Northern Hemisphere change the temperature? Without knowing that you can’t begin to ask what the size of any emergent effects might be.
The cruise controls on my cars slow down when starting up a hill with a steady pitch, but then catches back up to the requested speed. For it to stay slow the cruise control would need to have an idea of throttle setting for a given speed and only pay only some or no attention to the pitch.
My VW Tiguan tries to maintain the request speed on a steady downhill pitch, invoking downshifting and braking to achieve that. It is clueless about topography and small hills can leave accelerating as it approaches the crest which leads it to over speed and then exaggerated attempts to get to the requested speed.
And there is absolutely no evidence that human caused any of this warming.
UAH shows it has all come from El Nino event, with basically zero warming between them.
Again that is just nonsense. El Nino events have been happening for thousands of years and if each one caused a step change to the earth’s temperature then the world would be literally boiling right now. Suppose for argument’s sake each El Nino event cause the earth’s temperature to rise by 0.1 degree. Now El Nino’s happen roughly every 4 years so there would be about 25 per century. Which means that over the past 5000 years the world would have warmed by 125 degrees. Which is clearly wrong. Even if each El Nino only warmed the planet by 0.01 degree you would still have 12.5 degrees of warming over the last 5000 years which contradicts every temperature reconstruction of the past.
“the world would be literally boiling right now” Citation?
Al Gore.
0.1 C/event * 25 event/century * 0.01 century/year * 5000 year = 125 C.
Be careful Izaak – you are using common sense logic there !
Would you prefer that it got cooler since pre-industrial times? Do you expect “the climate” to remain static?
I don’t expect the climate to remain static. That is Willis’ claim regarding emergent phenomena which actual as a temperature regulator. Personally I would argue that if there is a constant forcing on the climate then you would should expect it to change in response.
Izaak, I NEVER said it stays “static”. In fact, I send you a link to my post on slow drift in thermoregulated emergent systems.
We have a great example of regulation in our cars. It’s called a “cruise control”. And guess what? It doesn’t make your speed stay static. Sometimes you’re going faster, sometimes slower. Start up a hill and your speed drops. Etc.
The cruise control on my Ram truck at say 50 MPH keeps the speed generally within ±2 mph, a swing of 4% from trough to peak.
Now consider that the earth’s temperature changed by only 0.2% over the entire 20th Century …
w.
This slow drift is just another way of saying that your thermoregulation system doesn’t exist or isn’t apparent. It is a very useful get out clause– any temperature change that you can’t explain is a “slow drift”.
But even then what is to say that CO2 levels don’t cause a slow drift in the temperature? The earth’s temperature could still be rising due to man made emissions and any of your emergent effects would be powerless to stop it since they can’t act to change the set point of the thermostat.
And the fact that the earth’s temperature only changed by 0.2% doesn’t by itself prove anything unless you also know how much the solar irradiance changed over that period. If the energy coming from the sun varied by less than 0.2% then that temperature change is significant and needs explaining. And if the energy coming from the sun varied by more than 0.2% then the cause of the temperature variation would be fairly obvious and so in either case you need an explanation that goes beyond thermoregulation in emergent systems.
I’ve given you several actual phenomena that show the existence of the thermoregulation. Heck, you can see it at work on any given day in the tropics. You haven’t responded to a single one.
I’m gonna pass due to lack of response.
My best to you and yours,
w.
You didn’t answer the first part of the question, whether you prefer that it had gotten cooler since pre-industrial times.
And even the scientists don’t know why the warming lasted 2 years. And now you only have to link it to CO2 as well? 😉
Izaak reveals one significant thing in his back and forth with Willis –
there are just too many natural influences impacting climates’ behaviors to reasonably attribute all changes to CO2 content.
Nor should one ignore the unnatural influence, aka bad temperatures from badly sited weather stations.
A beautiful example of the data being different from the conclusions and the abstract. All of the scientific literature is full of this problem. It becomes malignantly damaging when only the abstract is read and reported on and used in citations.
Imagine if we collected bad data 😉
Don’t have to imagine it, the probity is atrocious.
One interesting observation l noticed after the Hanga Tonga-5 eruption was the effects that it had on the planets in the night sky. As there was a noticeably shift towards the red in their color. The effect was so strong that l had to make sure that l was looking at Jupiter and not Saturn. While the color of Saturn had become so deep that it looked like the color l would expect to see from Mars. While in the evening sky Venus instead of its brilliant white was looking more yellow/white rather like the color of Jupiter. This effect lasted for a number of month’s.
It seems that there is a water vapour element to these eruptions. Some will have pushed a lot of water vapour very high where it acts as a greenhouse gas with unknown forcing (because it is so “unnatural”. Others make obscuring dust as in 536 AD. No doubt others do both: can’t cool for warming.
Whatever is going on, the cold in the continental US at present has driven our local temperature up 35 deg C in the past few days. That’s excluding wind chill.
Even talking about volcanos creates a lot of warming.
The lifetime of extra water vapor added to the atmosphere through irrigation or a volcano is generally considered to be very short, typically around 8-10 days on average, as water vapor rapidly cycles through the atmosphere through evaporation and precipitation processes.
The atmospheric lifetime of sulfur dioxide (SO2) is roughly around 1-2 weeks, with most studies indicating a timeframe between a few days and a couple of weeks depending on environmental conditions, primarily in the troposphere where it is rapidly oxidized and removed through precipitation and deposition as sulfuric acid.
Particulate matter from a volcano, particularly fine ash injected into the stratosphere, can remain in the atmosphere for several years depending on the eruption size and particle size, with larger eruptions like Mount Pinatubo generating aerosols that can linger for up to three to four years in the stratosphere
Water vapor injected into the stratosphere by a volcanic eruption, particularly from a large event like the Hunga Tonga-Hunga Ha’apai eruption, can remain detectable in the stratosphere for several years. This is significantly longer than the typical lifetime of volcanic aerosols, which usually fall out within a couple of years.
And water is never constantly replenished. 😉
I’ve asked a few people how water vapor in the stratosphere exits, including my speculation it may float into the upper stratosphere, disassociate in UV light, and then allow hydrogen to escape into space. I heard first that it precipitates out in polar stratospheric clouds.
I recently read https://www.sciencenews.org/article/electric-field-in-earths-atmosphere which notes which suggests I may be right:
At any rate, I’ve heard estimates that it will take 9 years of so for the water vapor to mostly be removed, a lot longer than heavier aerosols that settle out in a year or two.
The text in the paper reads, “The 1831 CE eruption has been linked to climate cooling of 0.5 to 1 °C (SI Appendix, Fig. S1) and coincides with decreased rainfall in the African and Indian monsoon regions (4).” So not 1 degree, but 0.5-1 degrees, and a source (Brönnimann et al., 2019) is given beyond just the supplementary figure, which is for illustrative purposes. Brönnimann 2019 “analyse[s] the effect of the sequence of eruptions [in the 1820s and 1830s] in observations, global three-dimensional climate field reconstructions and coupled climate model simulations.” So the study is much more comprehensive than just looking at annual BEST global MST.
It would be good if you could address the inaccuracies in your best and then address the actual source of the claim of the 0.5-1 degrees cooling.
Willis, have you had a chance to consider this point yet?
I ignored it, because the abstract says:
“This event was estimated to have injected ~13 Tg of sulfur (S) into the stratosphere which produced various atmospheric optical phenomena and led to Northern Hemisphere climate cooling of ~1 °C.”
I also ignored it because they have the unmitigated gall to claim that the Berkeley Earth data supports their calculations, which even their own graph shows is a wild misrepresentation. Point out to us the cooling.
In addition, the commenter seems impressed that “global three-dimensional climate field reconstructions and coupled climate model simulations”. That doesn’t impress me in the slightest. I’ve shown before in several posts that models greatly overestimate volcanic effects.
w.
Funny. I posted that exact sentence from the abstract in my post below which says the Northern Hemisphere cooled by ~1 C. You seemed to have ignored my post as well.
No they didn’t. They said they used [Stoffel et al. 2015], [Schneider et al. 2015], [Wilson et al. 2016], and [Anchukaitis et al. 2017] for the Northern Hemisphere temperature reconstruction in figure S1b which is what actually shows the ~1 C of cooling…ya know…in the Northern Hemisphere.
Figure S1b. That is about 1 C of cooling in the Northern Hemisphere coincident with the eruption of the volcano against the backdrop of the broader 1827 to 1837 cooling they also mentioned.
No. It was [Hutchinson et al. 2024] that was impressed enough with it to cite it in their paper. AlanJ is just pointing out that there is more to the study than just the BEST dataset.
It doesn’t impress me that you misrepresented Hutchinson et al 2024. I was willing to right it off as unintentional, but seeing your arrogant and condescending response here it makes me second guess that conclusion.
Note that I have boldened Northern Hemisphere to drive home the point that the ~1 C was in reference to the Northern Hemisphere.
I trust you understand that the Northern Hemisphere is not the same thing as the globe. Figure S1a is in reference to the the globe. Figure S1b is in reference to the Northern Hemisphere.
This isn’t a trick question Willis…which figure, S1a or S1b, do you think is most relevant to Hutchinson et al. 2024’s statement in the abstract?
The abstract is just providing an approximate magnitude, the text gives more details. But you’ve also omitted part of the supplementary figure and accompanying text:
So even though the BEST data is just being provided for illustrative purposes, it isn’t even the only illustration provided, and you’ve ignored the reconstructions entirely.
There is a tendency on this site to handwave away model results without adequate justification. Since you are questioning the results, you need to engage fully with the supporting evidence. The paper also isn’t relying just on models, but on models, climate field reconstructions, and observational data. Three converging lines of evidence that you can’t simply dismiss offhand.
What they actually said is “This event was estimated to have injected ~13 Tg of sulfur (S) into the stratosphere which produced various atmospheric optical phenomena and led to Northern Hemisphere climate cooling of ~1 °C.”
They mention the declines in the global land average temperature in the instrumental record (BEST) from 1827 to 1837 as well and hypothesize climate modes in addition to the volcano as influencing factors in this observation. Their data in figure S1b is not inconsistent with their statement above.
They actually used [Stoffel et al. 2015], [Schneider et al. 2015], [Wilson et al. 2016], and [Anchukaitis et al. 2017] to verify their claim.
Figure S1b shows the cooling in the NH intensifying almost immediately after the Zavaritskii volcano.
Willis, have you had a chance to consider these points yet?
It looks like I’ve been ghosted again just like I was when I pointed out that Willis misrepresented NASA’s ModelE ice pond melting and freezing algorithm.
Gosh, bdgwx, I’m sorry that I didn’t see your oh-so-important post. So sue me. To the points.
First, they do say Northern Hemisphere cooling, not global. However, the correlation between NHem temperatures and global temperatures is 0.96. Here’s a scatterplot.
And indeed, the authors themselves use the GLOBAL Berkeley Earth data to attempt to support their claims. Unfortunately, it does nothing of the sort. Instead, it shows trivial cooling the year after the eruption and warming the following year.
Next, if you truly think that tree rings are a valid temperature proxy, I pity you. The problems with that approach have been documented in many places. The main problem is that you get thin tree rings from both too cold and too warm conditions, as well as from too wet and too dry conditions, and there’s no way to tell the difference.
But even assuming they are correct, there’s no difference between say the “cooling” shown in the tree rings from 1831-1833 and the subsequent cooling from 1834-1836 …
Finally, you accuse me of “handwaving away” other information about eruptions. Nonsense. I’ve studied this question intently. Here is some of my previous research:
Pinatubo and the Albedo Thermostat 2011-08-21
I got to thinking that the eruption of Mount Pinatubo should provide a good test case for my theory that changes in albedo help regulate the temperature and keep it within a narrow range. When a big volcano erupts, it throws both black and reflective particles and aerosols high into…
The Eruption Over the IPCC AR5 2013-09-22
In the leaked version of the upcoming United Nations Intergovernmental Panel on Climate Change (UN IPCC) Fifth Assessment Report (AR5) Chapter 1, we find the following claims regarding volcanoes. The forcing from stratospheric volcanic aerosols can have a large impact on the climate for some years after volcanic eruptions. Several…
Volcanic Disruptions 2012-03-16
The claim is often made that volcanoes support the theory that forcing rules temperature. The aerosols from the eruptions are injected into the stratosphere. This reflects additional sunlight, and cuts the amount of sunshine that strikes the surface. As a result of this reduction in forcing, the biggest volcanic eruptions…
New Data, Old Claims About Volcanoes 2012-07-30
Richard Muller and the good folks over at the Berkeley Earth Surface Temperature (BEST) project have released their temperature analysis back to 1750, and are making their usual unsupportable claims. I don’t mean his risible statements that the temperature changes are due to CO2 because the curves look alike—that joke has…
Stacked Volcanoes Falsify Models 2013-05-25
Well, this has been a circuitous journey. I started out to research volcanoes. First I got distracted by the question of model sensitivity, as I described in Model Climate Sensitivity Calculated Directly From Model Results. Then I was diverted by the question of smoothing of the Otto data, as I reported…
Volcanoes Erupt Again 2014-02-24
I see that Susan Solomon and her climate police have rounded up the usual suspects, which in this case are volcanic eruptions, in their desperation to explain the so-called “pause” in global warming that’s stretching towards two decades now. Their problem is that for a long while the climate alarmists…
Volcanoes Once Again, Again 2015-01-09
Anthony recently highlighted a couple of new papers claiming to explain the current plateau in global warming. This time, it’s volcanoes, but the claim this time is that it’s not the big volcanoes. It’s the small volcanoes. The studies both seem to…
Dronning Maud Meets the Little Ice Age 2012-04-13
I have to learn to keep my blood pressure down … this new paper, “Abrupt onset of the Little Ice Age triggered by volcanism and sustained by sea-ice/ocean feedbacks“, hereinafter M2012, has me shaking my head. It has gotten favorable reports in the scientific blogs … I don’t see it at…
BEST, Volcanoes and Climate Sensitivity 2012-08-13
I’ve argued in a variety of posts that the usual canonical estimate of climate sensitivity, which is 3°C of warming for a doubling of CO2, is an order of magnitude too large. Today, at the urging of Steven Mosher in a thread on Lucia Liljegren’s excellent blog “The Blackboard”, I’ve…
Volcanic Corroboration 2012-09-10
Back in 2010, I wrote a post called “Prediction is hard, especially of the future“. It turned out to be the first of a series of posts that I ended up writing on the inability of climate models to successfully replicate the effects of volcanoes. It was an investigation occasioned…
There are more, but that’s a good start, and you can stuff your accusations about “handwaving” as far up the distal end of your esophagus as your arms can reach.
w.
Here from perplexity is a list of the known issues with tree ring reconstructions:
Tree-ring-based proxy temperature reconstructions face several challenges that can affect their accuracy and reliability:
1. Underestimation of historic temperature variability: Traditional tree-ring parameters may underrate the warmth of historic temperatures, potentially masking prior warm periods[1].
2. Lack of pre-industrial cooling trends: Unlike other proxies such as ice cores and sediment data, tree rings often fail to exhibit the expected gradual cooling trend prior to the industrial period[2].
3. Divergence Problem: Some tree-ring chronologies show a decoupling from rising temperature measurements since the 1970s, leading to cooler reconstructed temperatures after 1990 CE[3].
4. Proxy selection and climate sensitivity: Including tree-ring chronologies with mixed climate sensitivity (responding to factors other than temperature) can weaken reconstructions[2].
5. Detrending methods: The choice of detrending technique can significantly influence the preservation of long-term variability in tree-ring data[2].
6. Spatial distribution bias: Unequal representation of tree-ring proxies from different latitudes can affect the capture of millennial-length cooling trends[2].
7. Normalization effects: The method used to normalize tree-ring data can impact the preservation of long-term temperature trends[2].
8. Proxy network composition: The mix of different proxy types (e.g., tree rings, ice cores, sediments) in multi-proxy reconstructions can lead to discrepancies in pre-industrial cooling trends[3].
9. End-effects in time-series composition: These can contribute to challenges in proxy-target calibration, especially for recent periods[3].
10. External factors: Industrial pollution may influence tree growth patterns, potentially affecting temperature reconstructions[3].
These issues highlight the complexity of using tree rings as temperature proxies and underscore the importance of considering multiple factors when interpreting tree-ring-based climate reconstructions.
Citations:
[1] https://www.cato.org/blog/tree-ring-temperature-reconstructions-may-have-masked-prior-warmth
[2] https://cp.copernicus.org/articles/16/729/2020/
[3] https://www.nature.com/articles/s41467-021-23627-6
[4] https://agupubs.onlinelibrary.wiley.com/doi/full/10.1029/2024GL109282
Regards,
w.
Patently False. Figure S1b supports their claim; not S1a.
It’s not unreasonable to hypothesize that NH (or SH) temperatures, while highly correlated over long periods of time, exhibit lower correlation with global temperatures during periods that could be influenced by high latitude volcanic eruptions.
This isn’t about whether tree rings are valid temperature proxies are not. It’s about how you misrepresented the authors.
If you think their methodology or data is inappropriate or invalid then argue that point instead.
I didn’t say anything about you “handwaving”. I said you misrepresented the authors work.
This is interesting seeing as how you’ve been on the other end of commenters making similar statements toward you. So don’t think the irony of your hubris, arrogance, and condescension here went unnoticed.
For the record…I’m not convinced the NH cooled by 1 C from the Zavaritskii eruption either.
You said:
“There is a tendency on this site to handwave away model results without adequate justification. Since you are questioning the results, you need to engage fully with the supporting evidence. The paper also isn’t relying just on models, but on models, climate field reconstructions, and observational data. Three converging lines of evidence that you can’t simply dismiss offhand.”
Now you are falsely claiming that “I didn’t say anything about you “handwaving”.”
Playing with you is no fun, because you’ll flat-out lie.
Go play with yourself. Not interested.
w.
No No I didn’t.
Nope. I absolutely did not say that.
Seriously Willis. Seriously?
This is so childish.
Exactly.
Earth’s climate has amazing powers of self regulation and shrugs off the effects of volcanic eruptions. Climate alarmists attempt to spread fear with endless climate tipping point doom predictions when in fact the climate always corrects and tips back to a clement climate. The strongest argument against climate “tipping points” is that the climate hasn’t tipped in many millions of years.
Just one clear eyed person reveals the truth for all, as Einstein did some years ago, and Galileo even longer ago
Well done, Willis
I used to send my wind, solar, battery, etc., missives to my Maine list folks and Massachusetts list folks, but now that offshore wind and EVs have imploded several years before Trump, and Trump being on the scene to put all this nonsense out of its misery, I find both my lists are blocked, a sure sign of panic.
Trump doesn’t like windmills. He had a lot of criticism of windmills in his news conference today.
did this last one punch a bunch of H2O into the atmo … ? seems like it might offset the aerosols
Baloney Alert
Global average temperature statistics before 1979 are not reliable
Statistics for the 1800s are worthless for any climate conclusions, with margins of error very likely to be larger than even a very temporary and small SO2 cooling effect of a volcano
The most important observations about volcanoes and vents is that the CO2 they release was NOT enough to prevent a multi-billion year decline of atmospheric CO2 to a dangerously low level just 20,000 years ago.
Even after 1979. My farm town is now covered in concrete and asphalt…I am sure they reflect the heat nicely 😉
Fun factoid I calculated a while ago. The rate of ocean carbon dioxide semipermanent sequestration as limestone on average (details are complicated) is such, that if it were not for andesic vulcanism (e.g. the Pacific Ring of Fire) constantly recycling limestone into CO2 plus Calcium oxide, life on Earth would cease from lack of atmospheric CO2 (below about 150ppm for any photosynthesis) in something less than 2.5 million years.
Thank goodness for limestone recycling plate tectonics, only shown scientifically since the 1970’s.
Extra fun factoid. Tectonic Seafloor spreading (mid Atlantic, Iceland) don’t really help much. Crucial is sequestered limestone subduction ‘cooking’.
So carbon-based lifeforms are dependent on plate tectonics.
Limestone subduction is very long term. Burning fossil fuels enriched the atmosphere with more CO2 a lot faster. By the way C4 plants, which are about 30% of food crops, can grow fairly well at 150 ppm CO2, and even at 10 ppm CO2. They prefer 400 to 800 ppm however. Some C3 plants will grow at 150 ppm but the biomass might be 10% of normal size.
Processing limestone releases CO2. We should never mention limestone or leftists will find out and want to ban it.
lol.. Would love to see you growing any plant at 10ppm or even 150ppm. !
Biomass of 10% isn’t going to feed anyone. !
Baloney Alert.
“Global average temperature statistics before 1979 are not reliable”
Double baloney alert. No “global average temperature statistic” is “reliable”. They’re all meaningless.
I found all of this including the commentary really interesting. I certainly don’t understand the science but am fascinated by volcanoes and their sheer power that can transform an area of the earth’s surface and we can do nothing about it!
.
We can watch.
From a distance.
Still very much enjoying your discussions… and your charts. Keep up the great work.
Volcanic tephras catch anthropogenic heat, trap it in the atmosphere longer. This is the key of anthropogenic global warming. https://pubs.sciepub.com/ijp/7/4/3/index.html
AGW is real but not caused by CO2 emissions or water vapor.
Volcanic tephras also make photosynthesis harder. Since photosynthesis is endothermic, cooling down the temperatures, less photosynthesis means less cooling.
ChatGPT also confirms https://florentpirot.blog/2024/11/25/chatgpt-4o-confirms-that-volcanic-tephras-trap-artificial-heat-in-the-atmosphere-the-true-greenhouse-effect/
Oh, well, if some “AI” confirms it…
:eyeroll:
Location seems to be important for massive volcanic eruptions (VEI 5+), especially in the northern climes. Apparently the sub polar jet stream walls off the plume, not allowing much of it to spread south.
Three examples are Paektu (Changbaishan) 946 AD, which puked out a VEI 6 50 km3 of material. No measurable rise or fall in global temps. Katmai / Novarupta, was slightly smaller puking out nearly 30 km3 (bulk) in another VEI6. According to Willis’ graph, global temps increased after it went off.
Zavaritsky is N of Paektu and S of Katmai, yet no measurable or much less suggested global cooling with either eruption. Methinks there is a lot left to learn, but what do I know? Cheers –
Although “unreliable”, the only surface temperature data we have going back to the 1600’s is the CET. When plotted as a raw annual mean, the yearly variations are quite startling. Take 1740 for instance when the annual mean dropped a whole 3 degC.
Surface volcanism is more common than you might think. The image below shows eruptions with a Volcanic Explosive Index (VEI) of 5 or greater plotted on the CET temperature record. There are 30 of them, and they are classified as having “significant stratospheric injection”. Episodes with a VEI of 4 are classified as having “definite stratospheric injection”, but that would add another 140 episodes to the plot.
Volcanic eruptions can affect the weather but the response may not be global.
The above image with VEI 4 added.
I expected this post, but missed it when you first put it up. Well done.
Being 250 miles downwind of Mt. St Helens it got seriously dark that afternoon. I was 40 road miles from home when told the white stuff falling wasn’t snow and I should go home. I did, and then didn’t start the car for 3 days. The volcanic glass would foul car parts, but not if you didn’t start the engine. The sky cleared and there was no change in the weather.
So, anecdotal evidence in support: I bought a motorcycle, Suzuki Katana 600 in 1991, the year Pinatubo erupted. Coldest summer of my life in Michigan, had to use the jacket every time I rode it, almost never got out of the 60’s F.
berkeley earth has a global instrument temperature record going back to 1790? that’s a joke right?
Even the two biggest eruptions, Tambora 1815 and Krakatau 1883, were not followed by global cooling in the Berkeley Earth record.
And how many stations does Berkeley Earth have data for from 1816? Certainly nowhere near enough to make any claims about “global” temperatures. The colossal eruption of Tambora in April 1816 had a global impact as historical records from the U.S. and Europe describe “The Year Without a Summer” with cooler temperatures throughout the year resulting in widespread crop failures and the cost of wheat and other crops dramatically increasing. That the Berkeley Earth dataset doesn’t show it illustrates how poor the data is the further back it goes.
In brief, we don’t know what effect volcanic eruptions have on temperature, if any. –Tom Halla
We do in fact know that some volcanoes have global effects as we’ve witnessed and measured in recent decades. Eschenbach’s posited feedback response to restore stability to global climate makes sense to a point but it may take longer than a few days, weeks, or months to stabilize, depending on how large the impact is.
Stinker, you’re not following the story. I linked to my article “Missing the Missing Summer” above.
w.
First off, our land temperature databases are corrupt. We have “adjustments” put in by agenda driven “climate scientists” into every temperature database out there, with few exceptions, so just how are we to analyze all this without error bars that exceed what we are trying to figure out?
It’s a great exercise running the numbers, but I put little faith in the numbers. The satellite and ARGO results might be a little better, but the fox is still guarding the hen house as the data coming in has to be converted to a “temperature” before posting.
Story Tip:
https://www.gbnews.com/science/scientists-issue-warning-melting-antarctica-ice
More alarmism.
Too many flaws in this “analysis” to mention.
Simple description: Melting glaciers could result in more volcanic eruptions, with the heat melting more ice causing more eruptions.
“The 2024 winter maximum for Antarctic sea ice was recorded as the second lowest in history.”
Failure to note that “history” is defined since the advent of satellite observations.
Also failure to note that the lowest extent (measured in 2023) did not cause any significant volcanic activity and the ice grew back modestly in 2024.
Ja. I told you many rumblings ago. Extra Volcano activity every 1000 years or so. It is the only explanation for the current warming.
https://foresight.org/some-historical-perspective/
https://breadonthewater.co.za/2021/03/04/the-1000-year-eddy-cycle/