by Chris Martz
We may live in the 21st century, but when it comes to the weather, the human mind has not evolved past Dark Age superstition.
No matter what the weather is doing, people spanning across both extremities of the political spectrum attempt to find fault with someone — or a specific group of people — that they don’t like. In the 15th century, hundreds of children were sacrificed by the Chimú in northern Peru after periods of heavy rain and flooding. In the 1690s, more than 150 alleged “witches” were sentenced to jail or hung in Massachusetts after a period of hot, dry summers and cold, snowy winters crippled local agriculture, which inevitably led to starvation and famine.
Today, any heatwave, drought or storm is considered evidence of human-caused climate change. Journalists, left-wing activists and Democratic leaders gripe that Republicans are not doing enough to address the “climate crisis,” and find them complicit by fanning the flames of climate change denialism. On the same token, there has been an alarming rise in the number of right-wing influencers, such as Alex Jones and Congresswoman Majorie Taylor Greene, who promote unsubstantiated claims that “they” (usually an allusion to the federal government) use cloud seeding to generate hurricanes and steer them into “red” areas with high-frequency radio transmissions using the University of Alaska Fairbanks (UAF) ionosphere research facility, the High-frequency Active Auroral Research Program, commonly referred to by its acronym, HAARP.
These claims have resurfaced amidst the aftermath of Hurricanes Helene and Milton, both of which struck Florida less than two weeks apart, intersecting with the politically charged rhetoric ahead of the nearing presidential election. Helene, in particular, was devastating because of the flood damage its remnants wrought on the Carolina backcountry and eastern Tennessee, in addition to the enormous death toll by modern standards. So far, Helene has been confirmed to have claimed over 250 lives, making it the deadliest natural disaster in the United States since Hurricane Katrina in 2005. Both storms are estimated to have inflicted hundreds of billions of dollars in damage, and rebuilding efforts could take years.

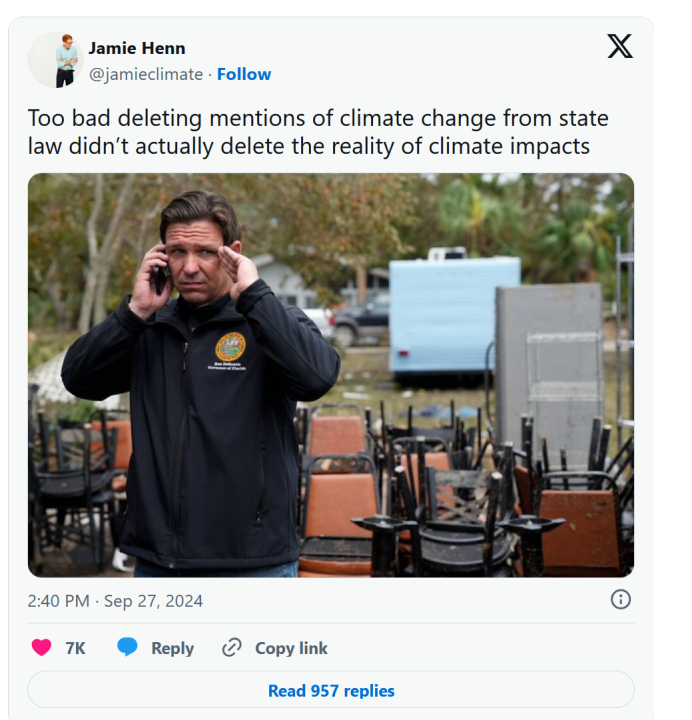
On September 27th, climate activist Jamie Henn pinned the flooding in Florida from Helene on Governor Ron DeSantis for “deleting mentions of climate change from state law,” as if that would magically stop hurricanes from striking during peak North Atlantic hurricane season.
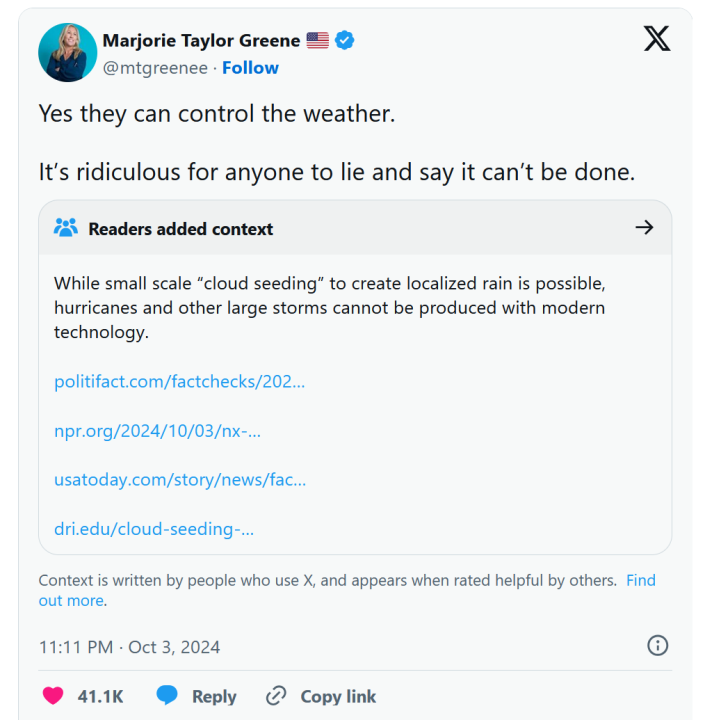
Georgia congresswoman, Representative Majorie Taylor Greene, took to 𝕏 (formerly Twitter) on Thursday, October 3rd, and posted,
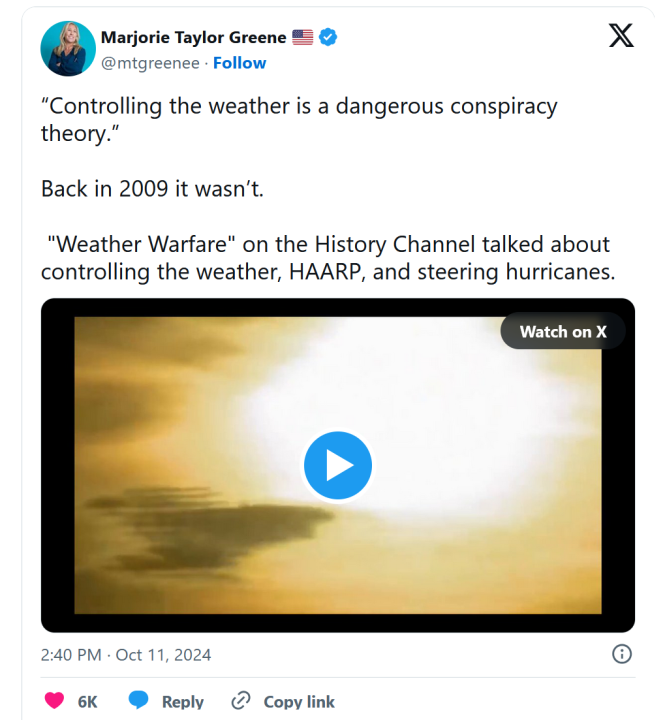
She followed this up with a string of posts, including,
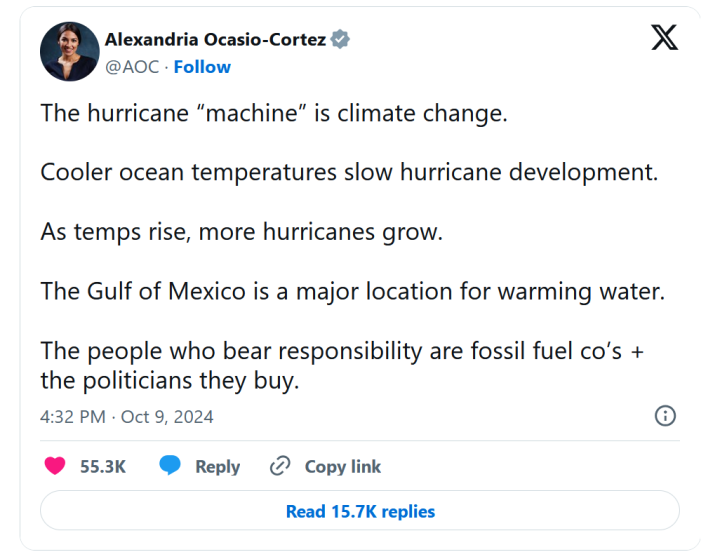
To respond to Greene’s admittedly absurd claims, New York Democratic congresswoman, Representative Alexandria Ocasio-Cortez, stated on Wednesday, October 9th,
What about weather modification?
While the focal point of this article will be to address and challenge the prevailing narrative that Helene and Milton were caused or “fueled” by human-caused climate change, I would like to hit pause on that and take a moment address the conspiracy theories regarding “weather manipulation” that seem to predominantly come from pundits on the right.
Although weather modification through cloud seeding — a process whereby hygroscopic nuclei (i.e., tiny particles that have affinity for water to condense onto) such as silver iodide, dry ice (solid carbon dioxide, CO2) or sodium chloride (common salt, NaCl) are released into the updrafts of clouds to dial up cloud droplet formation and enhance rainfall or disperse fog — has been routinely tested since the 1940s and has been successful when implemented on a very localized scale,[1] attempts to weaken or steer hurricanes (e.g., Project Stormfury) have been futile (e.g., Willougby et al., 1985).[2] [3]
The theory was that if pilots could seed clouds with silver iodide in the spiral rainbands that encircle the eyewall — the ring of intense winds and convection that surround the eye — they could redirect the storm’s energy by creating an outer eyewall of larger radius to reduce wind speed through partial conservation of angular momentum, and eventually erode the original eyewall (Willoughby et al., 1985).[3] While it was initially thought to have been successful, it was later discovered in Willoughby et al. (1982) that major hurricanes often undergo eyewall replacement cycles (EWRCs) where the eyewall contracts and a new one forms with a larger radius, causing temporary reductions in intensity.[4] This discovery, along with the consideration that hurricanes too large for seeding to have any measurable effect, ultimately led to the disbanding of Project Stormfury in 1983 after 21 years of study and inconclusive results (Willoughby et al., 1985).[3]
Tropical cyclones (truncated to TCs hereafter) — an umbrella term for any “…warm-core, non-frontal synoptic-scale cyclone, originating over tropical or subtropical waters with organized deep convection and a closed surface wind circulation about a well-defined center” (NOAA),[5] hurricanes of which are a subset of TCs which attain a maximum sustained wind speed of ≥74 miles per hour (mph) — are extremely large and dynamic weather systems.
The typical hurricane is, on average, 150 miles (240 kilometers) in radius,[6] and according to NOAA’s Atlantic Oceanographic & Meteorological Laboratory (AOML), they produce 6.015×10¹⁴ watts (i.e., Joules per second) of energy per day of their average life cycle, which is more than 200 times the worldwide electrical generating capacity.[7] The bulk of that energy, an estimated 6.0×10¹⁴ watts, comes from latent heat release during condensation (i.e., when water vapor condenses into droplets, heat is released into the ambient environment to cool the water such that a phase change can occur) which enhances convection in the eyewall and powers its momentum.[7] 1.5×10¹² watts of that energy, or 0.25% of it, comes from the total kinetic energy produced by the swirling winds.[7]
We simply do not have the technological capability to generate enough energy to exert influence on the intensity and strength of a hurricane, and I can guarantee that we probably never will.
The meteorology behind Helene and Milton
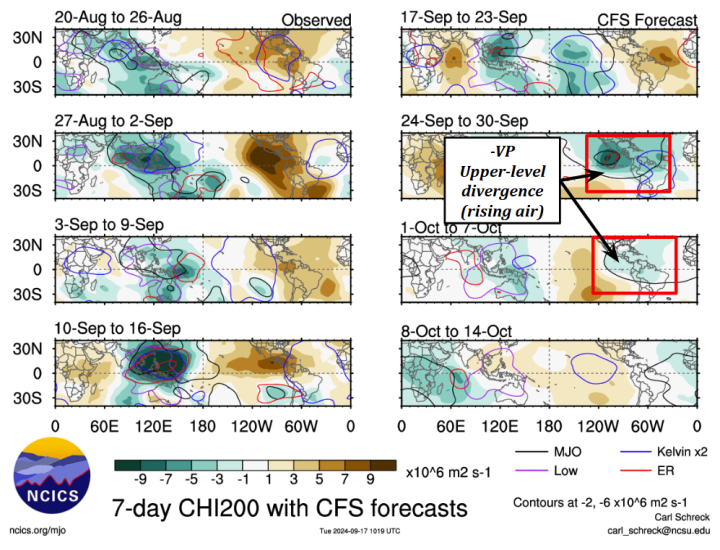
A week before Hurricane Helene formed, medium-to-long-range numerical weather prediction (NWP) models suggested that the atmosphere would be primed for tropical cyclogenesis over the Caribbean and Gulf in weeks two (September 24-30) and three (October 1-7) with the Madden-Julian Oscillation (MJO) looping through phases seven, eight, one and two. The CFS reanalysis and four-week forecast from Dr. Carl Schreck’s tropical monitoring site is shown in the figure below.
Notice in week two (September 24-30), there is a negative velocity potential (-VP) pulse (green contours) at 200 hPa (~40,000 ft. / 12,000 m. altitude) — indicative of divergence near the tropopause and convection / rising air in the vertical column — over the eastern equatorial Pacific Ocean (MJO phases 7-8) and Atlantic. With the help of a convectively coupled Kelvin wave (CCKW) (blue contour) and an equatorial Rossby wave (ER) (red contour), the forecast -VP pulse indicated that there would be enhanced convection and reduced deep-layer vertical wind shear (i.e., a change in wind speed and/or direction with increasing height) over the Caribbean and Gulf of Mexico, favoring tropical development in weeks two and three.
Several days later, on Sunday, September 22nd, a broad area of low-pressure developed over the western Caribbean and began to track northward. Two days later, the area of showers began to consolidate and rotate about a well-defined center, and accordingly, the NOAA National Hurricane Center (NHC) upgraded the system to Tropical Storm Helene. The following day, it was upgraded to a hurricane as it traversed through the Yucatán Channel and into the Gulf of Mexico.
As Helene marched northward, intensification was thwarted as dry air associated with a trough (broad area of low-pressure) over Dixie wrapped into its circulation on its western flank. The introduction of dry air into a cloud mass lowers the vapor pressure and throws the local atmosphere out of thermodynamic equilibrium — a condition where there is as much vapor condensing as there are droplets vaporizing — causing droplets to evaporate. Since evaporation is a cooling process (i.e., latent heat of vaporization) and cool air is denser than warm, the air becomes negatively buoyant, sinks and promotes the formation of downdrafts, forestalling convection.
By the morning of the 26th, a low-shear environment coupled with sea surface temperatures (SSTs) exceeding 86°F (30°C) in the Gulf of Mexico “Loop Current” allowed Helene to undergo rapid intensification (abbreviated as RI hereafter) (i.e., when a TCs maximum sustained wind speed, Vmax, increases by ≥30-knots / ≥35 mph in ≤24-hours).[8] By 2:25 p.m. EDT, Helene intensified into a major hurricane as it was guided toward the Big Bend of Florida by the anticyclonic (clockwise) flow around the Azores High and cyclonic (counterclockwise) flow around the upper-level low spinning about its axis over the Tennessee River Valley. By the evening of the 26th, Helene had intensified into a Category 4 hurricane and made landfall near the mouth of the Aucilla River at 11:10 p.m. EDT at peak intensity with a Vmax of 140 mph and a minimum barometric sea-level pressure (referred to as MSLP hereafter) of 938 hPa.
As Helene tracked inland, it rapidly weakened and became post-tropical as it was absorbed into the mid-latitude trough over Tennessee (see the animation below), but not before causing extensive flooding across the Blue Ridge Mountains in the Carolinas — notably Asheville, North Carolina — and in parts of eastern Tennessee, which had already been plagued with rain over the two days prior due to Gulf moisture being advected northward and force lifted along a stalled weather front.
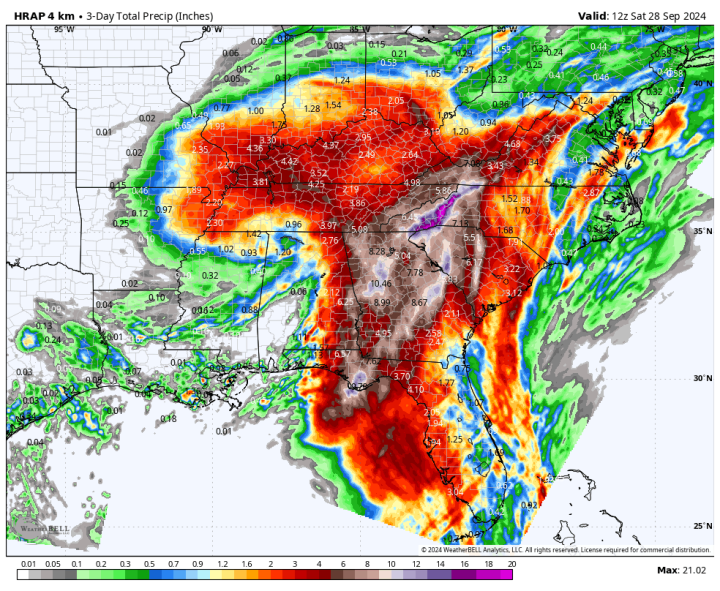
The three-day precipitation analysis below from the Hydrologic Rainfall Analysis Project (HRAP) ending at 12z Saturday, September 28th, conveys a large swath of 3-6 inches of rainfall across the Florida panhandle, southern Georgia and eastern Carolinas with 6-18 inches (locally higher) measured over mountainous terrain in the Carolina High Country. Mount Mitchell, North Carolina recorded a three-day rainfall total of 24.41 inches, while Busick was the outlier with 31.33 inches, according to the North Carolina State Climate Office.[9] In total, an estimated 40 trillion gallons of rain fell across the eastern United States; that is enough to fill 60.6 million Olympic-sized swimming pools (each pool holds about 660,000 gallons) and still have several thousand gallons to spare.
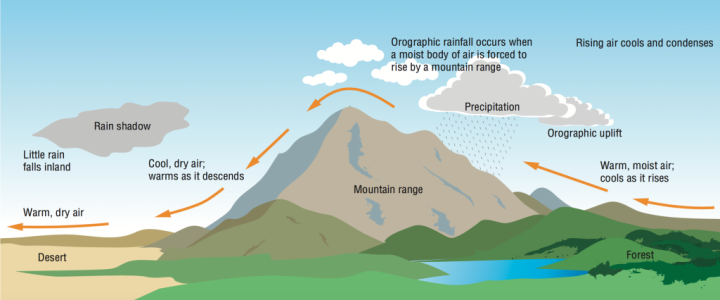
But, why did so much rain fall over western North Carolina, you might ask? Well, the reason has to do with a combination of orography and cloud physics.
In the Northern Hemisphere, low-pressure systems (including hurricanes) rotate counterclockwise. As Helene was absorbed into the aforementioned trough and became post-tropical, moist air parcels moving from southeast to northwest were dynamically lifted up the sloped terrain of the Blue Ridge to supersaturation. Excess vapor rapidly condensed and precipitated out on the windward side of the Appalachians, while downsloping to the west on the leeward side produced a rain shadow effect with significantly reduced precipitation totals.
Although Asheville recorded a three-day rainfall total of 13.98 inches, comparatively lower than its surroundings, the city was hit particularly hard by flooding. While Asheville sits 2,134-feet above mean sea level, it is geographically positioned in a “bowl” surrounded by higher terrain. All of that rainwater funneled down into the Swannanoa and French Broad rivers, which spilled over their banks and flooded the city and other local communities with water, mud and debris. While the impacts of this flood have certainly been unmatched in western North Carolina, the magnitude of the flooding in Asheville and surrounding areas is not. In fact, rainfall from the remnants from two hurricanes practically wiped out Asheville in July 1916, and they have a long history of devastating floods dating back to the 1790s.
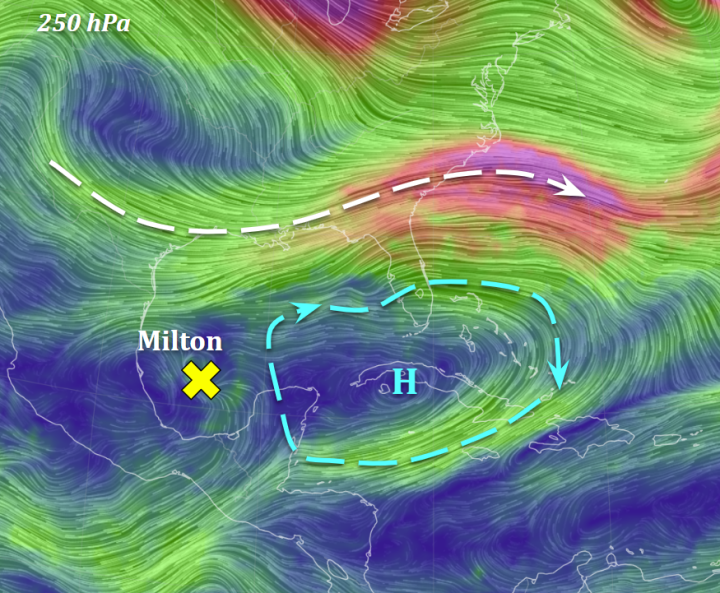
As for Hurricane Milton, it began as a disorganized cluster of showers and thunderstorms in the Bay of Campeche. By Saturday, October 5th, the cluster had organized and the NHC accordingly upgraded it to Tropical Storm Milton. Weak steering flow caused Milton to meander a little around the bay for a period of time before it was ejected eastward across the Gulf of Mexico — an unusual, but not unprecedented track — by a developing trough (dashed white arrow) over the central United States, and a weak high-pressure area (dashed blue arrows) stationed over Cuba. This is illustrated on the 250 hPa (~35,000 ft. / ~10,700 m.) wind map below.
By the afternoon of Sunday, October 6th, Milton had intensified into a hurricane and began to clear out an eye on visible satellite imagery. That night, record high SSTs [exceeding 88°F (31.1°C)] and a low-shear environment in the 200-850 hPa (40,000-5,000 ft. / 12,000-1500 m.) layer enabled Milton to undergo extreme RI such that by noon the following afternoon, it was a Category 5 with an estimated Vmax of 180 mph and an MSLP of 897 hPa. This reading marked Milton as the most intense Atlantic hurricane in nearly 20 years, specifically since Wilma (2005). Wilma registered an MSLP of 882 hPa at its peak, the lowest on record for any Atlantic TC in the NOAA HURDAT2 record going back to 1851.[10] Milton’s MSLP ranked fifth lowest overall.
As Milton brushed the Yucatán Peninsula that night, further intensification was stunted by an eyewall replacement cycle (EWRC) which was completed by the morning of Tuesday, October 8th. However, once the larger secondary eyewall formed and the inner one collapsed, Milton underwent a second round of RI and reattained Category 5 status, although not quite as strong as before, with the Vmax capping out at 165 mph and the MSLP bottoming out at 902 hPa.
Milton soon began to pivot and accelerate towards the northeast aimed at the west coast of central Florida. Throughout the following day, Milton was imparted by strong southwesterly shear on the order of 30-35 knots on its northern side, while dry air on the west entrained into the eyewall, resulting in the eye becoming cloud-filled and displaced northwest of the primary convection. This can clearly be seen on this low-level water vapor imagery loop from NASA’s GOES-16 satellite below.
As anticipated, the shear and dry air knocked down Milton’s intensity upon its arrival in Florida. It officially made landfall as a Category 3 around 8:30 p.m. EDT near Siesta Key with an estimated Vmax of 120 mph and an MSLP of 954 hPa. Milton began to rapidly weaken over land and quickly became post-tropical once it emerged over the open Atlantic leaving behind a trail of damage from over five feet of storm surge across the southwest Florida coastline.
Is climate change to blame?
The news cycle immediately following the back-to-back hurricane landfalls was rife with sensationalism.
Politico, a left-wing political newspaper, headlined, “Hurricanes do little to move Republicans on climate.” They stated that, “Republicans have to do more than the bare minimum to prevent hurricanes like Helene and Milton from happening in the first place.”
As a fourth-year atmospheric science student, I’d certainly be inclined to see which bills conservative legislators could write up and pass to Governor DeSantis’ desk to sign into law that would magically erase hurricanes from the picture.
Outlets like NPR and Axios suggested that climate change “supercharged” Helene and Milton, arguing that higher SSTs, caused by greenhouse gas (GHG) emissions, give hurricanes more energy to “tap” into for fuel. Moreover, they argue a warmer atmosphere has capacity to “soak up” more moisture from the ocean, which translates to heavier downpours as it precipitates out.
The Associated Press and NPR reported that climate change increased Helene’s rainfall by 10% and its Vmax by 11%, citing a “flash” attribution study conducted by scientists for the World Weather Attribution (WWA). NBC News cited a separate “flash study” from Lawrence Berkley Lab, which claims that GHG warming increased Helene’s rainfall by a staggering 50%. The New York Times and Phys.org, cited a second WWA rapid attribution study which concluded that Milton’s rainfall was boosted by 20-30% and Vmax by 10% thanks to climate warming.
What’s more, the record high Gulf of Mexico SSTs, the accelerant behind their quick intensification, were allegedly made 200-500 times more likely because of GHG emissions. The authors suggest that if humans hadn’t warmed the planet with their gas-guzzling SUVs, Milton would have struck Florida as a Category 2 hurricane as opposed to a Category 3.
These unoriginal works of journalism — if that’s what you want to call them — all regurgitated the same uninspired rhetoric, citing talking points from WWA “flash studies.” Journalists did no original investigation of their own and just copied and pasted the pre-canned, half-baked WWA articles, which are not subject to peer-review, into their pieces.
Their overarching message? Unless we take steps to remove hydrocarbons from the energy mix, hurricanes will continue to become stronger due to rising SSTs and become “wetter” by dropping more rain due to thermal expansion of the atmosphere.
So, without further ado, let’s put in the investigative legwork that the press didn’t bother to do.
Global hurricane frequency is down
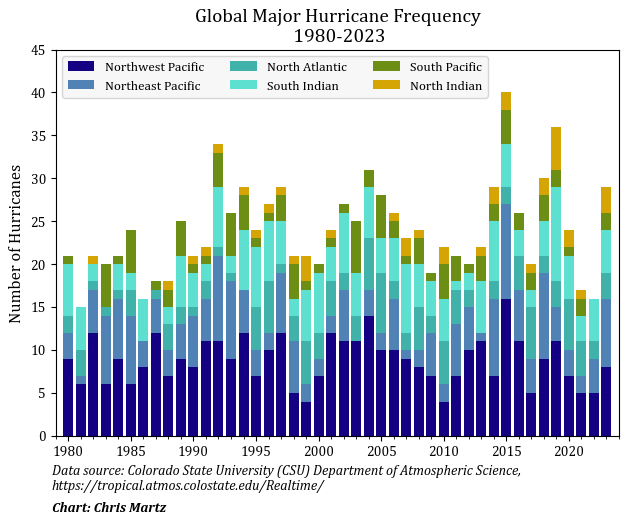
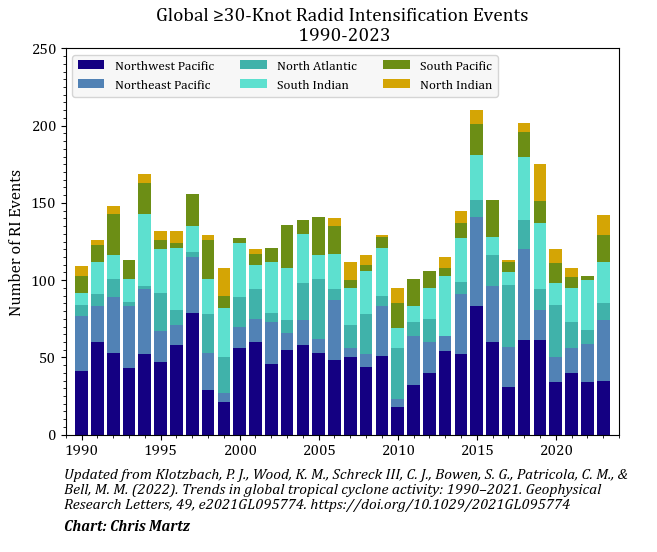
In a broader sense, there has been no global-scale increase in the annual number of hurricane-strength TCs since 1980, which is plotted in the following bar chart. In fact, the trend is markedly down. These findings are backed by recent studies such as Knutson et al. (2019) and Klotzbach et al. (2022).[11] [12]
This trend is largely emergent from a multidecadal downturn in western North Pacific (NWPAC), eastern North Pacific (NEPAC) and South Pacific (SPAC) activity, which has been physically attributed to a regression toward a more La Niña-like base state (Klotzbach et al., 2022).[12] South Indian Ocean (SIO) cyclones exhibit no long-term trend, while there have been increases in TC activity in both North Atlantic (NATL) and North Indian Ocean (NIO) basins — the Atlantic of which is known to be linked to multidecadal variability (i.e., the Atlantic Multidecadal Oscillation, or AMO).
Author’s note: Although operational satellite records used to monitor the Northern Hemispheric TC activity date back to 1966 with the launch of NASA’s ESSA-1 and ESSA-2 satellites, it wasn’t until around 1980 that there was ample satellite coverage over the South Pacific and South Indian oceans. Resolution of satellite imagery has also vastly improved over the last several decades. Unsurprisingly, both TC tallies and intensities were certainly underestimated prior to the 1980s (e.g., Landsea et al., 2006).[13]
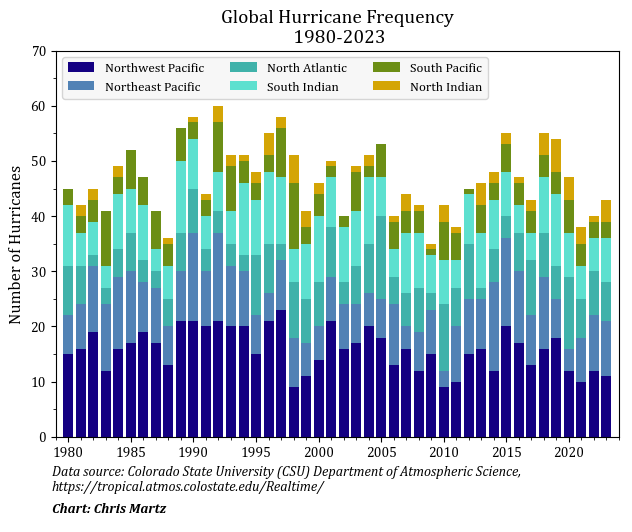
What’s more, there has been no global-scale trend in the annual number of major hurricane-strength TCs over the same 44-year observation period. The significance of this is that if rising SSTs were fueling stronger hurricanes, that would translate to an uptrend in annual count of major hurricanes, but that clearly has not been the case.
Outlets like the Associated Press and The New York Times failed to report on this data because it does not fit their editors’ pre-approved storyline.
Florida hurricane strikes are trending slightly down
Focusing specifically on Florida, the Sunshine State has been struck by a whopping 111 hurricanes, including 40 major hurricanes, since recordkeeping began in 1851, based on an analysis of track data from NOAA’s HURDAT2 database.[10] While the overall long-term trend in hurricane strikes is trending slightly downward over the last 174 years, the number of major hurricane landfalls have increased, albeit slightly and not of any statistical significance.
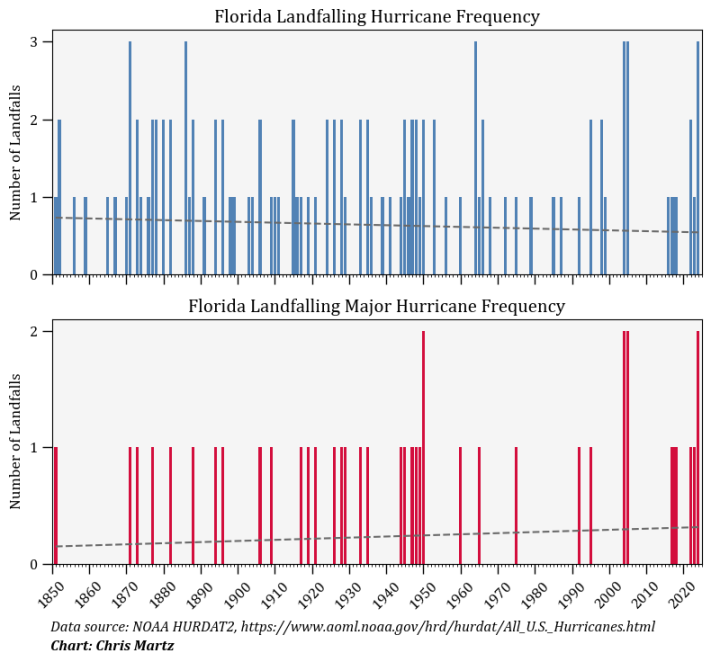
The slight increase in major hurricane landfalls is primarily due to a near-20-year gap between the Category 3 “Great Florida Middle Panhandle Hurricane” of 1851 and the unnamed Category 3 hurricane of 1871 which struck just north of present-day Juno Beach.
There is reason to believe, however, that this gap doesn’t actually exist considering Florida was largely uninhabited prior to the turn of the 20th century. According to the U.S. Census, there were less than 200,000 people living in Florida in 1870. In 1850, there were less than 100,000, and there were less than two residents per square mile south of the Ocala National Forest. The bulk of Florida’s population lived in the panhandle. It is probable that hurricane and major hurricane landfalls on the Atlantic-bordering side were undercounted before 1900.
Even so, Florida was struck by twelve hurricanes in the 1870s alone, followed by ten each in the following decade and in the 1940s.[10] During the 1940s, Florida was struck by five major hurricanes, although between 1944 and 1950, there were a total of seven, which to date remains the most major landfalls in a ten-year span.[10]
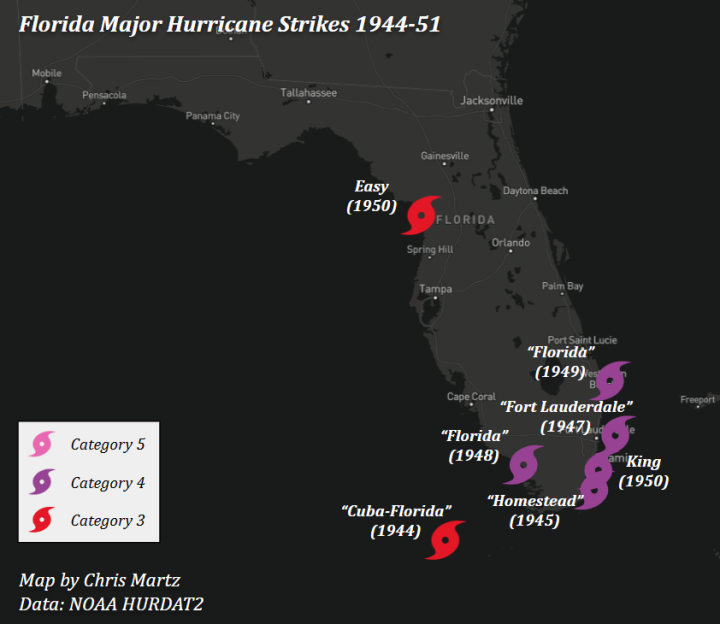
That eight-year period in the late 1940s to early 1950s is comparable to the recent eight-year streak of major hurricane landfalls. The only main difference between the two clusters is that the 1944-50 landfalls were mostly grouped across southern Florida from the Keys to West Palm Beach on the Atlantic side, and recent tracks have all been along the Gulf Coast.

It is also interesting to note that Florida went nearly 11 years between Wilma (2005) and Hermine (2016) without a single hurricane strike, the longest stretch on record since 1851.
Florida hurricane strike intensity is unchanged
But, what about landfall intensity?
Prior to the adoption of the Saffir-Simpson hurricane wind scale in the early 1970s — which has undergone subsequent revisions — TC intensities were quantified by their minimum barometric pressure (MSLP) just like extratropical cyclones (think nor’easters). This is because it has long been understood that, generally speaking, the lower the atmospheric pressure, the stronger the storm. In fact, Knaff and Zehr (2007) found more than a 90% explained variance between MSLP and Vmax using 15-years of TC data from the Atlantic and Pacific.
The mechanics of this are simple. Pressure falls at the core of the cyclone tighten the horizontal pressure gradient between the eye and the ambient environment. In an attempt to equalize the pressure deficit, air parcels will accelerate toward the storm’s center, thereby increasing the Vmax. The relationship between TC Vmax and MSLP can be approximated by:
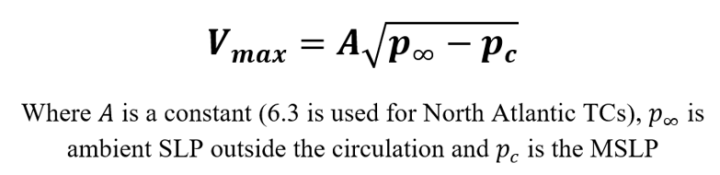
One additional advantage to using MSLP as a proxy for TC intensity as opposed to Vmax is that MSLP is a more precise measure. MSLP is measured by the millibar (mb) or the equivalent hectopascal (hPa), whereas Vmax is estimated in five-knot or five-mile-per-hour increments, which leads to significant of overlap in TC intensity estimates.
It’s also worth noting that the method for approximating Vmax has changed over the last several decades. Prior to the 1940s, we largely relied on physical in-situ wind speed measurements taken from scattered ground-based station anemometers situated 10 meters above the ground. Today, TC Vmax is estimated from flight-level dropsonde measurements obtained from NOAA Hurricane Hunter aircraft reconnaissance missions, which are then reduced by 10% to account for friction (a reduction factor I argue is too small).
The scatterplot below shows all Florida hurricane landfall MSLPs since 1900 (the 1851-1899 period was excluded due to low population density in the 19th century, as detailed earlier).[10] While the least squares regression line is slightly down, which would indicate that hurricanes are landfalling at higher intensity, the coefficient of determination (R2 value) is a measly 0.016, which means it doesn’t pass the statistical significance test. In other words, there is no compelling evidence that hurricanes are striking Florida with greater ferocity.
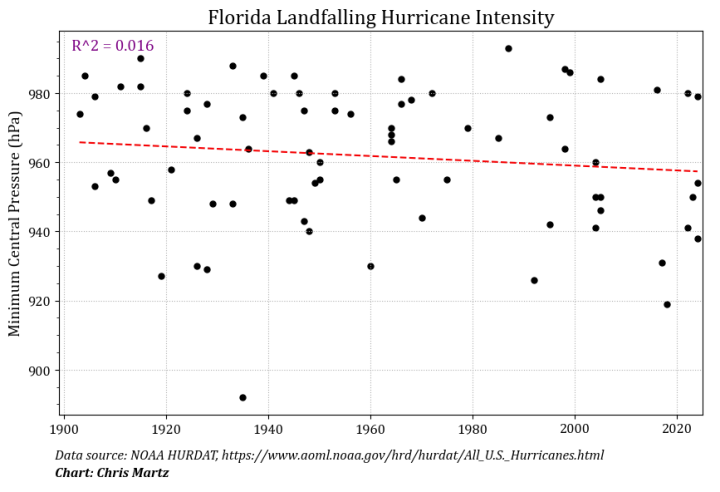
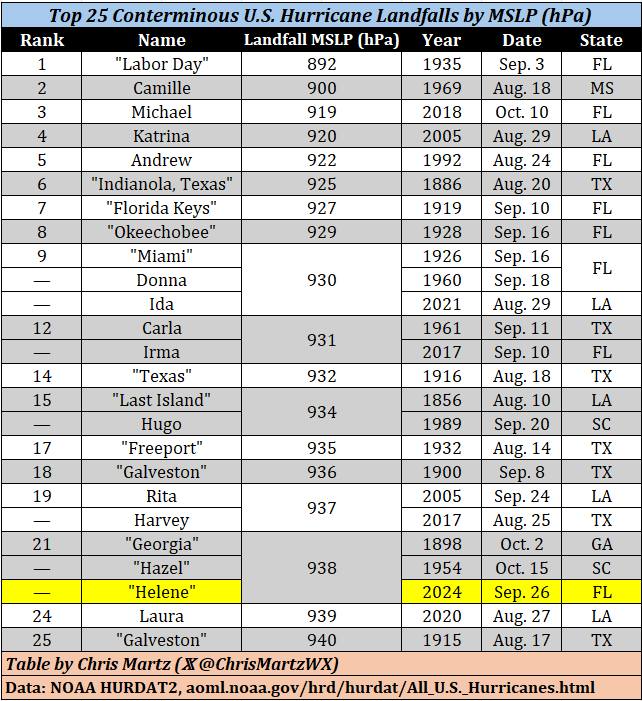
It is also worth mentioning that neither Helene nor Milton rank in the top 20 most intense United States mainland hurricane landfalls.
Helene struck the Big Bend of Florida on September 26th with an MSLP of 938 hPa, which, ranked by pressure, places it tied for 21st place with the 1898 “Georgia” hurricane and Hurricane Hazel (1954).[10] Milton was even less impressive [in that regard], striking the west coast of central Florida just south of Tampa Bay on October 9th with an MSLP of 954 hPa, which places it tied for 69th place with several other CONUS landfalls.[10]
For the Sunshine State specifically, Milton tied for 28th place with the August 1949 “Florida” hurricane, as can be seen in the table below. Even in Florida, there have been 27 stronger hurricanes at landfall than Milton.[10]
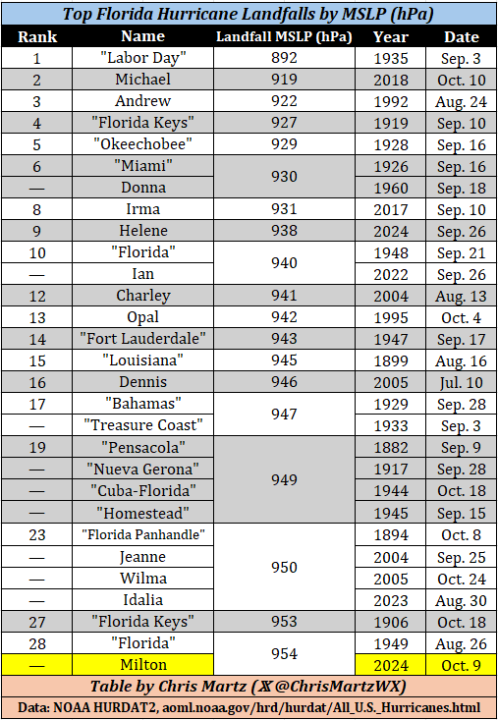
Of those 27 storms, 16 of them struck before 1965. While one could argue seven of them in this list have been in the last 20 hurricane seasons (since 2005), that also holds true for the interval 1926-45. So, while the unprecedented decade-long lull in Florida hurricane hits has been balanced by unusually high TC activity since 2017, the current period of high activity is not unprecedented.
Low correlation between Gulf SST and Major Hurricane Vmax
Another major blow to alarmist theory that rising SSTs, caused by GHG forcing on the climate system, invariably yield stronger hurricanes is that:
- No meaningful correlation exists between Gulf of Mexico SST and major hurricane maximum sustained wind speed.
- GHG forcing does not explain recent record high Gulf of Mexico SSTs.
Let’s take a closer look at point #1.
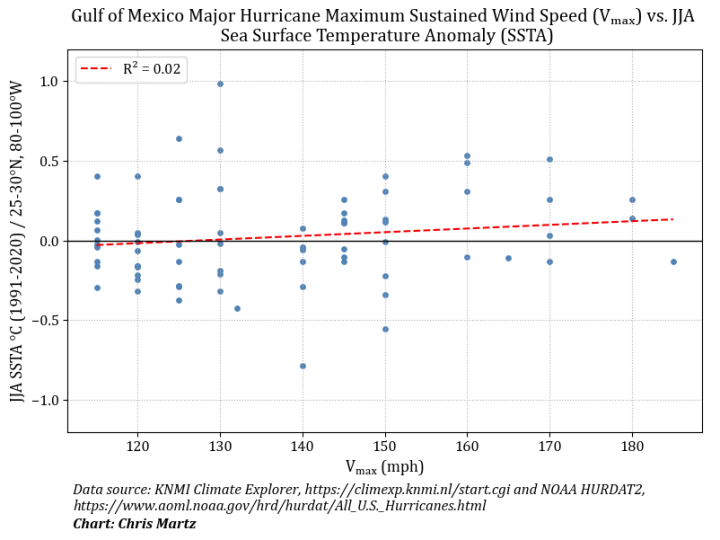
The scatter diagram in the figure below displays Gulf of Mexico (defined as 20-30°N, 80-100°W) major hurricane Vmax (mph) versus the June-August (JJA) three-month average sea surface temperature anomaly (SSTA) in degrees Celsius [relative to the 1991-2020 average]. I chose the JJA SSTA because the data available on the KNMI Climate Explorer is packaged as three-month averages. Secondly, SSTs are usually slow to change because of water’s high specific heat (i.e., amount of heat, in Joules, that is required to raise one gram of a substance by 1°C), so these anomalies serve as ideal initial conditions going into peak hurricane season.
The linear model only explains 2% of the variance in the dependent variable, which means that no relation of statistical significance exists between these two variables. This underscores the importance of the fact that hurricane kinematics are contingent on many environmental factors and SSTs don’t make the storm.
Case in point, there first must be a pre-existing disturbance such as a monsoon trough, African easterly wave (AEW), mesoscale convective system (MCS) or, on occasion, a decaying weather front. For a disturbance to organize into a TC, the vertical wind shear profile must be minimal and there must not be a lot of dry air. (e.g., a Saharan Air Layer). If those two environmental prerequisites are not satisfied, any showers or thunderstorm clusters that do manage to spin up into a tropical storm or even minimal hurricane will not rapidly intensify into a powerful major hurricane like Helene or Milton, even if SSTs exceed 86°F (30°C).
The sheer complexity of TC kinematics is likely why, in spite of gradually increasing SSTs, there has been no detectable direction of change in the global number of RI events over the past three and a half decades (e.g., Klotzbach et al., 2022).[12]
Now, I want to direct your attention to point #2.
The World Weather Attribution (WWA) “flash study” found, if you recall, that record high SSTs in the Gulf of Mexico were made 200-500 times more likely because of anthropogenic forcing on the climate system (i.e., GHG emissions).
While it is true that Gulf SSTs have been at record highs in the last couple of years, this sudden spike is far too large to be explained by gradual background warming. The reason for this is because although GHGs do reduce the rate of infrared radiation (IR) emission to outer space, which has a warming effect in the troposphere (i.e., lower atmosphere), downwelling IR — the so-called “back radiation” — is not an effective heater of the ocean surface.
Indeed, the bulk of incident IR is absorbed within the top few micrometers of water in what is called the “thermal skin layer” (TSL), as demonstrated in Wong and Minnett (2018).[15] In order to get a meaningful change in heat storage, the authors of the aforementioned study had to substitute clouds for GHGs because the downwelling IR signal from the latter was negligible on short-term time scales, which is of relevance when talking about current Gulf of Mexico SSTs.
So, what can explain the record warm Gulf?
The answer? Increased absorbed solar radiation (ASR).
Beginning last year, we saw a massive spike in global average SSTs, particularly in the North Atlantic. Some scientists have compellingly linked this to increased ASR caused by a reduction in cloud albedo, particularly over the tropics. A new Nature Communications study, Yuan et al. (2024),[16] accredited this change to an abrupt reduction in sulfur dioxide (SO2) emissions resulting from an 80% cap on sulfur content in shipping fuels that was adopted by the International Maritime Organization (IMO) in 2020.[17]
During combustion, sulfur reacts with oxygen and forms SO2 — a very powerful aerosol that acts to redirect incoming shortwave radiation back to outer space. In addition, SO2 reacts with oxygen in the air to form sulfate aerosols which can serve as cloud condensation nuclei (CCN), a surface for vapor in the air to condense on to form low-to-mid-level clouds (Yuan et al., 2024).[16] These clouds, unlike high, thin, wispy cirrus, increase Earth’s planetary albedo. Given SO2’s life span in the atmosphere is on the order of weeks to months, a rapid reduction in SO2 emissions has unsurprisingly increased the atmospheric radiation imbalance, leading to increased ASR, most of which is effectively absorbed into the ocean.
This external forcing is the only physical mechanism, apart from internal variability, that can explain the spurious jump in SSTs since 2023. Gradual background warming from GHGs is just that — gradual. It has little to do with current Gulf of Mexico SSTAs, which makes the WWA’s claim patently false along with all of the copy-paste, pre-packaged headlines citing their rapid attribution studies. While Helene’s and Milton’s RI events were certainly enabled by record high SSTs, there is no definitive proof that these anomalies were a function of our fossil fuel combustion. The coupled ocean-atmosphere system is multivariate; it’s not linearly dependent on radiative forcing from GHG emissions.
A warmer atmosphere can contain more moisture, but that does not guarantee heavier rainfall
The other argument was that both storms were “wetter” because of global warming.
In layman terms, the theory goes that for every 1°C increase in air temperature, the atmospheric carrying capacity for water vapor increases by a little more than 7%. Alarmist arm-wavers take this seed of truth and extrapolate it into the idea that this automatically translates to more intense rainfall from afternoon thunderstorms and hurricanes.
This averment, however, rests on the case of misunderstanding cloud physics.
It is indeed true that for every 1°C increase in air temperature, the saturation vapor pressure (es) — the vapor pressure (e) at which the atmosphere is in thermodynamic equilibrium; that is, there is as much vapor condensing as there is liquid water vaporizing — increases by a little more than 7%. Physically, this means that roughly 7% more water can evaporate into the air without saturation being achieved (i.e., 100% relative humidity). This concept is derived from the Clausius-Clapeyron relation, which is expressed as follows,
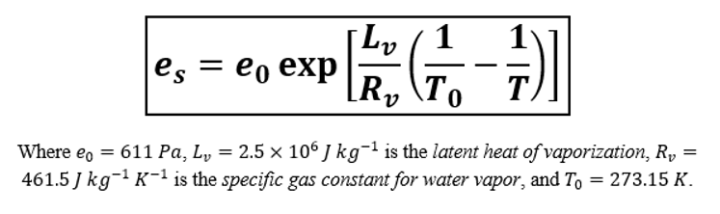
Hypothetically, what this means is that in a warmer climate, if the air does reach saturation, it will contain more condensed cloud water. That is true, all else being equal.
However, Clausius-Clapeyron tells us nothing about how much condensed water precipitates out over a given area or at what rate. How much rain falls and at what rate is contingent on a number of factors ranging from local dynamics like atmospheric circulation to cloud microphysics such as drop-size distributions. Helene’s rainfall, for instance, was aided by orographic enhancement over the eastern slope of the Appalachians. In general, global average TC rainfall rates have been estimated to have increased by about 8 ± 4% since 1999 (e.g., Tu et al., 2021),[18] which fits within the bounds of Clausius-Clapeyron. While the WWA “flash study” estimate that Helene’s rainfall was 10% higher in the current climate might have merit, their finding that Milton’s rainfall was boosted by 20-30% is highly questionable.
Closing remarks
In spite of what the narrative of the day might be, there is little to no evidence that background climate warming had any measurable influence on the evolution of Hurricanes Helene and Milton. Observational data indicates that major hurricanes are not becoming more frequent, they are not becoming stronger, and their overall intensity and/or rate of intensification are not linearly dependent on SSTs.
What is a growing concern, however, is our increased societal vulnerability to natural disasters like hurricanes. Hurricane wind and storm surge have become a lot more destructive, not because of climate change, but because we continue to place wealth along our coastlines to meet the demand of a growing waterfront population.
Reducing disaster risk hinges on the adaptation and mitigation strategies we adopt. Policy focus must center around increasing societal resilience to nature’s wrath. This involves things like stricter zoning codes, building requirements, beach nourishment and seawall construction. What is not going to reduce risk, especially in the short-term, is attempting to achieve “net zero” CO2 emissions by 2050.
Scientists and Democratic politicians alike sitting on their hands and blaming climate change and Republicans they don’t like (or, in the case of certain right-wing influencers, weather control) on hurricanes serves no scientific value and does nothing to help address the urgency of the actual problem at hand. No real progress can be made in disaster mitigation and/or prevention so long as we continue to be stuck on stupid.
Hurricanes are not new. They have always vexed us, and always will. But, it’s time to abandon the Dark Age superstition about the weather, get serious about addressing real-world problems and unburden ourselves from what has been.
Key References
[1] North Dakota State Water Commission, “North Dakota Cloud Modification Project (NDCMP),” accessed October 14, 2024, https://www.swc.nd.gov/arb/ndcmp/.
[2] U.S. Army Research Institute for the Behavioral and Social Sciences. (1971). Project STORMFURY Annual Report, 1970 (AD0730016). Defense Technical Information Center. https://apps.dtic.mil/sti/citations/AD0730016.
[3] Willoughby, H. E., Jorgensen, D. P., Black, R. A., & Rosenthal, S. L. (1985). Project STORMFURY: A scientific chronicle 1962–1983. Bulletin of the American Meteorological Society, 66, 505–514. https://doi.org/10.1175/1520-0477(1985)066<0505>2.0.CO;2.
[4] Willoughby, H. E., J. A. Clos, and M. G. Shoreibah, 1982: Concentric Eye Walls, Secondary Wind Maxima, and The Evolution of the Hurricane vortex. J. Atmos. Sci., 39, 395–411, https://doi.org/10.1175/1520-0469(1982)039<0395:CEWSWM>2.0.CO;2.
[5] National Hurricane Center, “Glossary of NHC Terms,” National Oceanic and Atmospheric Administration, accessed October 14, 2024, https://www.nhc.noaa.gov/aboutgloss.shtml#t.
[6] National Weather Service. “Hurricane Anatomy.” Accessed October 14, 2024. https://www.weather.gov/source/zhu/ZHU_Training_Page/tropical_stuff/hurricane_anatomy/hurricane_anatomy.html.
[7] Atlantic Oceanographic and Meteorological Laboratory. “Frequently Asked Questions: Hurricane Energy Production.” National Oceanic and Atmospheric Administration. Accessed October 14, 2024. https://www.aoml.noaa.gov/hrd-faq/#hurricane-energy-production.
[8] National Hurricane Center. “Glossary of NHC Terms: R.” National Oceanic and Atmospheric Administration. Accessed October 14, 2024. https://www.nhc.noaa.gov/aboutgloss.shtml#r.
[9] Davis, Corey. “Rapid Reaction: Historic Flooding Follows Helene in Western NC.” North Carolina State Climate Office, September 30, 2024. https://climate.ncsu.edu/blog/2024/09/rapid-reaction-historic-flooding-follows-helene-in-western-nc/.
[10] Landsea, C. W., and J. L. Franklin, 2013: Atlantic Hurricane Database Uncertainty and Presentation of a New Database Format. Mon. Wea. Rev., 141, 3576–3592, https://doi.org/10.1175/MWR-D-12-00254.1.
[11] Knutson, T., and Coauthors, 2019: Tropical Cyclones and Climate Change Assessment: Part I: Detection and Attribution. Bull. Amer. Meteor. Soc., 100, 1987–2007, https://doi.org/10.1175/BAMS-D-18-0189.1.
[12] Klotzbach, P. J., Wood, K. M., Schreck III, C. J., Bowen, S. G., Patricola, C. M., & Bell, M. M. (2022). Trends in global tropical cyclone activity: 1990–2021. Geophysical Research Letters, 49, e2021GL095774. https://doi.org/10.1029/2021GL095774.
[13] Christopher W. Landsea et al., Can We Detect Trends in Extreme Tropical Cyclones?.Science 313,452-454(2006).DOI:10.1126/science.1128448.
[14] Knaff, J. A., and R. M. Zehr, 2007: Reexamination of Tropical Cyclone Wind–Pressure Relationships. Wea. Forecasting, 22, 71–88, https://doi.org/10.1175/WAF965.1.
[15] Wong, E. W., & Minnett, P. J. (2018). The response of the ocean thermal skin layer to variations in incident infrared radiation. Journal of Geophysical Research: Oceans, 123, 2475-2493. https://doi.org/10.1002/2017JC013351.
[16] Yuan, T., Song, H., Oreopoulos, L. et al. Abrupt reduction in shipping emission as an inadvertent geoengineering termination shock produces substantial radiative warming. Commun Earth Environ 5, 281 (2024). https://doi.org/10.1038/s43247-024-01442-3.
[17] “IMO 2020 Sulphur Limit: A Briefing.” Last modified January 3, 2020. https://www.imo.org/en/MediaCentre/PressBriefings/pages/34-IMO-2020-sulphur-limit-.aspx.
[18] Tu, S., Xu, J., Chan, J.C.L. et al. Recent global decrease in the inner-core rain rate of tropical cyclones. Nat Commun 12, 1948 (2021). https://doi.org/10.1038/s41467-021-22304-y.
Can a posting of a link to this page be used in addressing some of the misconceptions by a growing number of persons in the public? Like on ZH for instance, there is a growing number of adherents to the theory of ‘geoengineering’ of the atmosphere/weather …
This is yet another example of how the alarmists will pull out all the stops in attributing any extreme weather events to human activity, particularly the burning of fossil fuels. Except the above charts and tables provide enough examples to prove these have been regular occurrences for decades and even centuries when populations and industrial/transportation/agricultural activities were much lower than today’s. In addition, overall population concentrations were also smaller so that damage from these storms wasn’t as widespread or as costly. But the doomsayers will continue to look for opportunities to hit the panic buttons even if they see that voters, as in the US election, largely ignore them.
Excellent post.
MTG is unfortunately a nutty conservative. Usually adds little to any discussion including contrail conspiracies.
Unfortunately for warmunists, none of their TC fear mongering stands up to historical scrutiny—about which facts they apparently don’t care.
As a 24 year resident right on the beach in Fort Lauderdale, have accumulated some hurricane wisdom. Rode through Katrina (no problem, only a 1 as it passed thru east to west), Wilma (real bad, hit us as a Cat 3 west to east and we were near the eyewall), and Irma (big and bad, severely damaged every east facing unit on our floor except ours because of the building shape— we were unscathed, and the relative value of our unit went up a lot as a result). None the less, a go bag is always at the ready. After Wilma, we stay on 2 and bug out on 3 or greater if within 50 miles of forecast track at 36 hours. Better safe than sorry.
Re Milton, the words above include “That night, record high SSTs [exceeding 88°F (31.1°C)] and a low-shear environment in the 200-850 hPa (40,000-5,000 ft. / 12,000-1500 m.) layer enabled Milton to undergo extreme RI such that by noon the following afternoon, it was a Category 5 with an estimated Vmax of 180 mph and an MSLP of 897 hPa.”
Much recent literature and the comments of RicWill here on WUWT indicate that in general, convective instability limits SST to about 31C. If that is indeed a physical limit, how can it be described as a “record”. Is it not like claiming “This boiling water reached a record 212F (100C)”?
More importantly, a question: What was the energy source for this “record high SST”? Was it a special, rare feature of this hurricane, or was it part of a general expected pattern of SSTs in the region such as happens most years?
I’m suggesting caution with the use of the word “record”. It diverted my attention from the value of the rest of the article. Geoff S
“in general, convective instability limits SST to about 31C”
A theory greatly overstated. But worth noting what “convective instability” means. It means storms, and even hurricanes. They do cool the ocean.
“The reason for this is because although GHGs do reduce the rate of infrared radiation (IR) emission to outer space, which has a warming effect in the troposphere (i.e., lower atmosphere), downwelling IR — the so-called “back radiation” — is not an effective heater of the ocean surface.
Indeed, the bulk of incident IR is absorbed within the top few micrometers of water in what is called the “thermal skin layer” (TSL), as demonstrated in Wong and Minnett (2018)”
It’s a pity that some careful expsition of meteorology is marred by this unscientific claptrap. The IR is an effective heater of the surface. It does not need to penetrate. Solar heat does penetrate, but has nowhere to go, and returns, and is emitted as IR. But there is far too little of it to maintain the radiative flux (into the air) implied by the actual surface temperature. The down IR makes that T possible, by balancing flux at that surface layer. Once that is set, the water below has to warm (fro the solar heat) to match.
The Wong and Minnett paper cited actually says this in the abstract, though not as concisely:
“The hypothesis is that given the heat lost through the air-sea interface is controlled by the TSL, the TSL adjusts in response to variations in incident IR radiation to maintain the surface heat loss. This modulates the flow of heat from below and hence controls upper ocean heat content. This hypothesis is tested using the increase in incoming longwave radiation from clouds and analyzing vertical temperature profiles in the TSL retrieved from sea-surface emission spectra. The additional energy from the absorption of increasing IR radiation adjusts the curvature of the TSL such that the upward conduction of heat from the bulk of the ocean into the TSL is reduced. The additional energy absorbed within the TSL supports more of the surface heat loss. Thus, more heat beneath the TSL is retained leading to the observed increase in upper ocean heat content.“
It isn’t a hypothesis, is is simple physics. But anyway, they showed it experimentally.
“While it is true that Gulf SSTs have been at record highs in the last couple of years, this sudden spike is far too large to be explained by gradual background warming.”
Yes. And that is why the hurricanes were supercharged. It’s true that GHGs can’t explain the spike. But as with other T, AGW makes all such events start from a higher T base.
Nick,
Skimming the Wong et al paper [which is way above my pay-grade]: they did their study only at night, presumably to avoid short wave insolation effects on the TSL & upper ocean layer.
And then I found this in their Conclusion:
“Our results also provide initial evidence of the mechanism for increased heat storage in the upper ocean resulting, indirectly, from the absorption of increased IR radiation in the EM skin layer. Since there is no immediate, observable increase in surface heat loss associated with increased absorption of incoming IR radiation from the atmosphere, there is therefore an increase of heat available within the TSL to supply energy for the surface heat losses. It is also not possible for the additional energy in the TSL to be conducted into the bulk of the ocean (i.e., beneath the viscous skin layer) as that would require conduction up a mean temperature gradient in the TSL. [my bold]
So does this mean that downwelling IR could only heat the upper ocean layers at night [or under low clouds] by conduction from the underside of the TSL?
I don’t think these folk understand heat transfer well, nor even linear superposition. If they had, they might not have bothered to do the experiment. The fact that the temperature gradient is going the other way doesn’t block the effect of IR. The IR may not penetrate (actually it could), but a reduction in the upflux in the liquid has the same effect. So they have stated things awkwardly, but the conclusion is right: “ there is therefore an increase of heat available within the TSL to supply energy for the surface heat losses”.
It works like this. You do a flux balance at the surface. Flux up from the TSL depends on T as per S-B etc. Flux into the TSL comes from IR from above and conduction from below (the sunlight warmth returning). Conduction from below has to happen along a descending T gradient (warm to cool). If there is part of the sea that does not conform, too cool, say, then extra heat from the solar source flows in, and the flux imbalance warms that bit of fluid until the gradient is right.
There isn’t anything special at night, except the whole profile cools because of reduction in solar heat from below. That is just a diurnal cycle. However, I’m sure lack of direct sunlight (flickering with clouds) makes their task easier.
Great to see you now admitting it is all TOTALLY NATURAL WARMING.
Again, the total absence on any evidence of human causation.
“Flux up from the TSL depends on T as per S-B etc.”
WRONG!!
Flux depends on ΔT as per S-B
CO2 does not alter ΔT in the atmosphere.
“And that is why the hurricanes were supercharged.”
EXCEPT THEY WEREN’T !!
They were normal run-of-the-mill hurricanes.
“AGW makes all such events… blah , blah… “
WRONG!
A mythical non-existent fantasy cannot have any effect on the real climate.
There is no “A”.. you have proven that many times.
“The IR is an effective heater of the surface.”
ROFLMAO.. Nick boils his water but using his hair dryer from above. !!
Sorry, but IR causes evaporation which has been shown by actual measurement to COOL the regions directly below the TSL.
Not that “back-radiation” from CO2 is even real or would have enough energy to do anything anyway.
Now the witches have taken over the state government! Really, almost all top jobs in the state government are held by feminists.
What about the hags on the View, or Rachel Maddow of MSNBC? Most or all of them could be witches.
Thank you Chris Martz for the interesting article.
I always find it odd when the discussions of hurricanes come about that Cat 5 Michael (10-2018) is rarely mentioned in the literature. Often it may be included in a graph or table, but that’s about it. My interest in Michael is that it is the only hurricane (so far) that traveled almost directly over my house in northern Florida.
The electrical infrastructure in Jackson County, Florida was almost completely wiped out from Michael. Yet they had it completely rebuilt in about 6 weeks. Massive work around the clock with only one death of the electrical crew when a drunk driver hit one outside his truck. I was without power for 6 days. Had a 36 inch diameter pine tree and 18 inch diameter pecan tree topple over along with many shingles off the roof of the house & carport,
A mass of information well presented. Thank you, Chris Martz.
“This external forcing is the only physical mechanism, apart from internal variability, that can explain the spurious jump in SSTs since 2023.”
This is a false conclusion- a very dubious claim. Where is the corroborating SO2 data and the previous groundwork science for this ad hoc (after the fact) theory?
“The coupled ocean-atmosphere system is multivariate; it’s not linearly dependent on radiative forcing from GHG emissions.”
Tell that to all the people who repeat the lie that 90% of man-made global warming was absorbed by the ocean after emissions warmed the atmosphere first.
“The other argument was that both storms were “wetter” because of global warming.”
They were wetter due to the high ocean temperature at the source which drove more evaporation, not because “the warmer atmosphere can hold more water vapor” as Clausius-Clapeyron says, which ignores the basic idea that the atmosphere is warmer because of the warmer ocean.
They were wetter from ‘global’ warming – from natural solar warming, not from CO2 emissions.
The relatively sudden 2023/24 increase in SST is probably related to the water vapor increase in the stratosphere caused by the Hunga Tonga volcano.