Guest Essay by Kip Hansen — 12 November 2024 — 3000 words — Very Long Essay
There has been a great deal of “model bashing” here and elsewhere in the blogs whenever climate model predictions are mentioned. This essay is a very long effort to cool off the more knee-jerk segment of that recurring phenomenon.
We all use models to make decisions; most often just tossed together mental models along the lines of: “I don’t see any cars on the road, I don’t hear any cars on the road, I looked both ways twice therefore my mental model tells me that I will be safe crossing the road now.” Your little ‘safe to cross the road?’ model is perfectly useful and (barring evidence unknown or otherwise not taken into account) and can be depended upon for personal road-crossing safety.
It is not useful or correct in any way to say “all models are junk”.
Here, at this website, the models we talk about are “numerical climate models” [or a broader search of references here], that are commonly run on supercomputers. Here’s what NASA says:
“Climate modelers run the climate simulation computer code they’ve written on the NASA Center for Climate Simulation (NCCS) supercomputers. When running their mathematical simulations, the climate modelers partition the atmosphere into 3D grids. Within each grid cell, the supercomputer calculates physical climate values such as wind vectors, temperature, and humidity. After conditions are initialized using real observations, the model is moved forward one “time step”. Using equations, the climate values are recalculated creating a projected climate simulation.”
“A general circulation model (GCM) is a type of climate model. It employs a mathematical model of the general circulation of a planetary atmosphere or ocean. It uses the Navier–Stokes equations on a rotating sphere with thermodynamic terms for various energy sources (radiation, latent heat). These equations are the basis for computer programs used to simulate the Earth’s atmosphere or oceans. Atmospheric and oceanic GCMs (AGCM and OGCM) are key components along with sea ice and land-surface components.”
I am open to other definitions for the basic GCM. There are, of course, hundreds of different “climate models” of various types and uses.
But let us just look at the general topic that produces the basis for claims that start with the phrase: “Climate models show that…”
Here are a few from a simple Google search on that phrase:
Climate Models Show That Sea Level Rise from Thermal Expansion Is Inevitable
Climate models show that global warming could increase from 1.8 to 4.4°C by 2100.
Climate models show that Cape Town is destined to face a drier future
Let’s try “climate science predicts that”
There are innumerable examples. But let’s ask: “What do they mean when they say ‘Climate science predicts…’?”
In general, they mean either of the two following:
1) That some climate scientist, or the IPCC, or some group in some climate report, states [or is commonly believed to have stated, which is very often not exactly the case] that such a future event/condition will occur.
2) Some climate model [or some single run of a climate model, or some number of particular climate model outputs which have been averaged] has predicted/projected that such a future event/condition will occur.
Note that the first case is often itself based on the second.
Just generally dismissing climate model results is every bit as silly as just generally dismissing all of climate skepticism. A bit of intelligence and understanding is required to make sense of either. There are some climate skepticism points/claims made by some people with which I disagree and there are climate crisis claims with which I disagree.
But I know why I disagree.
Why I Don’t Accept Most Climate Model Predictions or Projections of Future Climate States
Years ago, on October 5, 2016, I wrote Lorenz validated which was published on Judith Curry’s blog, Climate Etc.. It is an interesting read, and important enough to re-read if you are truly curious about why numerical climate modeling has problems so serious that is has become to be seen by many, myself included, as only giving valid long-term projections accidentally. I say ‘accidentally’ in the same sense that a stopped clock shows the correct time twice a day, or maybe as a misadjusted clock, running at slightly the wrong speed, gives the correct time only occasionally and accidentally.
I do not say that a numerical climate model does not and cannot ever give a correct projection.
Jennifer Kay and Clara Deser, both at University of Colorado Boulder and associated with NCAR/UCAR [National Center for Atmospheric Research, University Corporation for Atmospheric Research], with 18 others, did experiments with climate models back in 2016 and produced a marvelous paper titled: “The Community Earth System Model (CESM) Large Ensemble Project: A Community Resource for Studying Climate Change in the Presence of Internal Climate Variability”.
The full paper is available for download here [.pdf].
Here is what they did (in a nutshell):
“To explore the possible impact of miniscule perturbations to the climate — and gain a fuller understanding of the range of climate variability that could occur — Deser and her colleague Jennifer Kay, an assistant professor at the University of Colorado Boulder and an NCAR visiting scientist, led a project to run the NCAR-based Community Earth System Model (CESM) 40 times from 1920 forward to 2100. With each simulation, the scientists modified the model’s starting conditions ever so slightly by adjusting the global atmospheric temperature by less than one-trillionth of one degree, touching off a unique and chaotic chain of climate events.” [ source ]
What are Deser and Kay referring to here?
“It’s the proverbial butterfly effect,” said Clara Deser… “Could a butterfly flapping its wings in Mexico set off these little motions in the atmosphere that cascade into large-scale changes to atmospheric circulation?”
Note: The answer to the exact original question posed by Edward Lorenz is “No”, for a lot of reasons that have to do with scale and viscosity of the atmosphere and is a topic argued endlessly. But the principle of the matter, “extreme sensitivity to initial conditions” is true and correct, and demonstrated in Deser and Kay’s study in practical use in a real climate model. – kh
What happened when Deser and Kay ran the Community Earth System Model (CESM) 40 times, repeating the exact same model run forty different times, using all the same inputs and parameters, with the exception of one input: the Global Atmospheric Temperature? This input was modified for each run by:
less than one-trillionth of one degree
or
< 0.0000000000001 °C
And that one change resulted in the projections for “Winter temperature trends (in degrees Celsius) for North America between 1963 and 2012”, presented as images:

First, notice how different each of the 30 projections are. Compare #11 to #12 right beside it. #11 has a cold northern Canada and Alaska whereas #12 has a hot northern Canada and Alaska, then look down at #28.
Compare #28 to OBS (observations, the reality, actuality, what actually took place). Remember, these are not temperatures but temperature trends across 50 years. Not weather but climate.
Now look at EM, next to OBS in the bottom row. EM = Ensemble Mean – they have AVERAGED the output of 30 runs into a single result.
They set up the experiment to show whether or not numerical climate models are extremely sensitive to initial conditions. They changed a single input by an infinitesimal amount – far below the actual real world measurement precision (or our ability to measure ambient air temperatures for that matter). That amount? One one-trillionth a degree Centigrade — 0.0000000000001 °C. To be completely fair, they changed is less than that.
In the article the authors explain that they are fully aware of the extreme sensitivity to initial conditions in numerical climate modelling. In fact, in a sense, that is their very reason for doing the experiment. They know they will get chaotic (as in the field of Chaos Theory) results. And, they do get chaotic results. None of the 30 runs matches reality. The 30 results are all different in substantial ways. The Ensemble Mean is quite different from the Observations, agreeing only that winters will be somewhat generally warmer – this because models are explicitly told it will be warmer if CO2 concentrations rise (which they did).
But what they call those chaotic results is internal climate variability.
That is a major error. Their pretty little pictures represent the numerically chaotic results of nonlinear dynamical systems represented by mathematical formulas (most of which are themselves highly sensitive to initial conditions), each result fed back into the formulas at each succeeding the time step of their climate model.
Edward Lorenz showed in his seminal paper, “Deterministic Nonperiodic Flow”, that numerical weather models would produce results extremely sensitive to initial conditions and the further into the future one runs them, the more time steps calculated, the wider and wide the spread of chaotic results.
What exactly did Lorenz say? “Two states differing by imperceptible amounts may eventually evolve into two considerably different states … If, then, there is any error whatever in observing the present state—and in any real system such errors seem inevitable—an acceptable prediction of an instantaneous state in the distant future may well be impossible….In view of the inevitable inaccuracy and incompleteness of weather observations, precise very-long-range forecasting would seem to be nonexistent.”
These numerical climate models cannot not fail to predict or project accurate long-term climate states. This situation cannot be obviated. It cannot be ‘worked around’. It cannot be solved by finer and finer gridding.
Nothing can correct for the fact that sensitivity to initial conditions — the primary feature of Chaos Theory’s effect on climate models — causes models to lose the ability to predict long-term future climate states.
Deser and Kay clearly demonstrate this in their 2016 and subsequent papers.
What does that mean in the practice of climate science?
That means exactly what Lorenz found all those years ago — quoting the IPCC TAR: “The climate system is a coupled non-linear chaotic system, and therefore the long-term prediction of future climate states is not possible.”
Deser and Kay label the chaotic results found in their paper as “internal climate variability”. This is entirely, totally, absolutely, magnificently wrong.
The chaotic results, which they acknowledge are chaotic results due to sensitivity to initial conditions, are nothing more or less than: chaotic results due to sensitivity to initial conditions. This variability is numerical – the numbers vary and they vary because they are numbers [specifically not weather and not climate].
The numbers that are varying in climate models vary chaotically because the numbers come out of calculation of nonlinear partial differential equations, such as the Navier–Stokes equations, which are a system of partial differential equations that describe the motion of a fluid in space, such as the atmosphere or the oceans. Navier-Stokes plays a major role in numerical climate models. “The open problem of existence (and smoothness) of solutions to the Navier–Stokes equations is one of the seven Millennium Prize problems in mathematics” — a solution to the posed problem will get you $ 1,000,000.00. For that reason, a linearized version of Navier-Stokes is used in models.
How does this play out then, in today’s climate models – what method is used to try to get around these roadblocks to long-term prediction?
“Apparently, a dynamical system with no explicit randomness or uncertainty to begin with, would after a few time steps produce unpredictable motion with only the slightest changes in the initial values. Seen how even the Lorenz equations (as they have become known over time) present chaotic traits, one can just imagine to what (short, presumably) extent the Navier-Stokes equations on a grid with a million points would be predictable. As previously mentioned, this is the reason why atmospheric models of today use a number of simplifying assumptions, linearizations and statistical methods in order to obtain more well-behaved systems.” [ source – or download .pdf ]
In other words, the mantra that climate models are correct, dependable and produce accurate long-term predictions because they are based on proven physics is false – the physics is treated to subjective assumptions ‘simplifying’ the physics, linearizations of the known mathematical formulas (which make the unsolveable solveable) and then subjected to statistical methods to “obtain more well-behaved systems”.
Natural variability can only be seen in the past. It is the variability seen in nature – the real world – in what really happened.
The weather and climate will vary in the future. And when we look back at it, we will see the variability.
But what happens in numerical climate models is the opposite of natural variability. It is numerical chaos. This numerical chaos is not natural climate variability – it is not internal climate variability.
But, how can we separate out the numerical chaos seen in climate models from the chaos clearly obvious in the coupled non-linear chaotic system that is Earth’s climate?
[and here I have to fall back on my personal opinion – an informed opinion but only an opinion when all is said and done]
We cannot.
I can (and have) shown images and graphs of the chaotic output of various formulas that demonstrate numerical chaos. You can glance through my Chaos Series here, scrolling down and looking at the images.
It is clear that the same type of chaotic features appear in real world physical systems of all types. Population dynamics, air flow, disease spread, heart rhythms, brain wave functions….almost all real world dynamical systems are non-linear and display aspects of chaos. And, of course, Earth’s climate is chaotic in the same Chaos Theory sense.
But, doesn’t that mean that the numerical chaos in climate models IS internal or natural variability? No, it does not.
A perfectly calculated trajectory of a cannonball’s path based on the best Newtonian physics will not bring down a castle’s wall. It is only an idea, a description. The energy calculated from the formulas is not real. The cannonball described is not a thing. And, to use a cliché of an adage: The map is not the territory.
In the same way, the numerical chaos churned out by climate models is similar in appearance to the type of chaos seen in the real world’s climate but it is not that chaos and not the future climate. Lorenz’s ‘discovery’ of numerical chaos is what led to the discoveries that Chaos Theory applies to real world dynamical systems.
Let’s take an example from this week’s news:
Hurricane Rafael’s Path Has Shifted Wildly, According to Tracker Models

Shown are the projected paths produced by our leading hurricane models as of 1200 UTC on 6 November 2024. The messy black smudge just above western Cuba is the 24 hour point, where the models begin to wildly diverge.
Why do they diverge? All of the above – everything in this essay — these hurricane path projections demonstrate a down-and-dirty sample of what chaos does to weather prediction and thus climate predictions. At just 24 hours into the future all the projections begin to diverge. By 72 hours, the hurricane could be anywhere from just northwest of the Yucatan to already hitting the coast of Florida.
If you had a home in Galveston, Texas what use would these projections be to you? If NCAR had “averaged” the paths to produce a “ensemble mean” would it be more useful?
Going back up to the first image of 30 projected winter temperature trends, a very vague metric: Is the EM (ensemble mean), of those particular model runs, created using one of the methods suggested by Copernicus Climate Change Service, more accurate than any of the others futures? Or is it just accidentally ‘sorta like’ the observations?
# # # # #
Author’s Comment:
This is not an easy topic. It produces controversy. Climate scientists know about Lorenz, chaos, sensitivity to initial conditions, non-linear dynamical systems and what that means for climate models. The IPCC used to know but ignores the facts now.
Some commenter here will cry that “It is not an initial conditions problem but a boundaries problem” – as if that makes everything OK. You can read about that in a very deep way here. I may write about that attempt to dodge reality in a future essay.
I will end with a reference to the eclectic R G Brown’s comments which I sponsored here, in which he says:

“What nobody is acknowledging is that current climate models, for all of their computational complexity and enormous size and expense, are still no more than toys, countless orders of magnitude away from the integration scale where we might have some reasonable hope of success. They are being used with gay abandon to generate countless climate trajectories, none of which particularly resemble the climate, and then they are averaged in ways that are an absolute statistical obscenity as if the linearized average of a Feigenbaum tree of chaotic behavior is somehow a good predictor of the behavior of a chaotic system! … This isn’t just dumb, it is beyond dumb. It is literally betraying the roots of the entire discipline for manna.”
And so say I.
Thanks for reading.
# # # # #
The problem with models is that people decide what the models model. If, for example, people think CO2 causes climate change, and program than into their models the models will be wrong. Always. forever. And history proves that. Not one climate model has come true. And that’s because CO2 doesn’t control climate, but they continue to try to prove that it does.
jshotsky ==> It is true that climate modelers believe that increasing atmospheric CO2 (and other GHGs) will cause temperature to rise, and that they hard code this into the models.
Thus we get commenters here and elsewhere that will try to validate climate models because the the climate has generally warmed “just like the models predict”. Of course, that just-like is only sorta true — the models run hot.
I showed years ago how easy it is to duplicate the Global Average Surface Temperature with a few lines of code. I’ll have to dig that up and add the link here (unless a readers finds it first). I just used a random function for variability and added in a random small increase each year- viola!
Where is it “hard coded into the models” The models are open source so you should be able to point to exactly which lines of code do this? Or do you simply mean that they obey the actual laws of radiative transfer?
Izaak ==> I’ll let the readers explain it to you….each model includes a parameter that hard codes this in…it has a name even …and different models use different values for it….see if you can guess.
That is just wrong. There is no parameter that specifies how much warming will result from an increase in CO2. If people knew that then they wouldn’t need to run the models. The sensitivity is an output of the models and not an input.
Look up ‘lambda’ – the factor by which the climate models are multiplied to ‘get the right answer’ when the radiative effect of CO2 alone doesn’t account for ‘modern warming’
Of course a saner person would say ‘well that means that other stuff is way more important than CO2’, but if you absolutely need to pin all the blame on CO2 you invent a positive feedback term, bung it in, get the result you want and then claim it validates the fact that not only is CO2 the root of the problem, but its much worse than we thought because of *positive feedback*…
Don’t the models assume that a rise in CO2 will result in a rise in temperature?
Great. The actual laws of radiative transfer! How about conduction, convection and advection – the other means of heat transfer in thermodynamics. Leave them out, or treat them as parameters, or do a poor modeling job, and the answers you get will bear little rrlationship to reality.
The five types of fog: steam, frontal, upslope, radiation, and advection. There are also five types of weather blocks, but the only one I remember is Omega.
You say t he models are open source. Do you mean by that that the actual code is available? Or just flow diagrams?
The actual code is available. Have a look at
https://www.giss.nasa.gov/tools/modelE/
or
https://www2.cesm.ucar.edu/models/ccsm4.0/
for example. If you want to claim that these models are hardwired to give
warming for an increase in CO2 then you need to provide evidence in
terms of the actual code that does it. It is all there waiting for someone
to analyse and find the flaw in it.
Poor Izzy-dumb doesn’t understand parameters.
Hilarious.
Well enlighten me. Show me the lines in the code where the
parameters for global warming are? It should be easy for someone like you.
There is no problem finding the flaws in these models. First, theoretically, they cannot produce a reliable prediction more than a few days out. That is the point of the article. Second, they require a lot of parameters to hindcast, and then don’t forecast well. They all run hot except one of the Russian models. Many of the models cannot even get the current temperature correctly – they can be off by 5°C either hot or cold. This is why they report deviations from the mean, so they can hide that the model thinks the average temperature of the world is 5°C warmer than it actually is. I won’t provide references. You need to find the data for yourself so you can convince yourself that these are serious issues in the GCMs.
Chifio did –
“GIssTemp – dumber than a tomato”
outlines getting it running
https://chiefio.wordpress.com/gistemp/
That isn’t relevant. That link is about how GISS calculates the global temperature based on temperature records and has nothing to do with climate models.
If they are not programmed to ALWAYS show a rise in temperature when CO2 increases, then you show us some model runs that show long term cooling with higher CO2. Chaos itself would lead one to say there should be a broad range of possibilities. Yet it seems with GCM’s that doesn’t occur. How do you explain that?
They are programmed to correctly reflect the physics of radiative transfer etc. And since the green house effect is physically real it is not surprising that it shows up in the simulations. They are not however directly programmed to show a rise in temperature when CO2 increases.
But they do *NOT* reflect the PHYSICS of radiative transfer, they can’t as long as they parameterize clouds and their impact. It’s not even obvious that they recognize the limiting of Tmax by T^4 radiation during the day!
So they show cooling is possible with higher CO2?
Show us a model that does this.
People are beginning to recognize that large areas are not experiencing the warming that the models say they should. If the models can not be validated by showing regions with lots of warming and regions with little to no warming, they are worthless.
This is what I learned in circuit analysis. If you input a step function into a circuit and analyze the output, it had better follow how you designed each part. In other words the output is a combination of the piece parts.
Climate is no different. You start with small grids and if they don’t reflect the actual conditions in broader and broader areas, something is greatly amiss. It’s not up to others to show why in the code. It’s up to climate science to show why. There has to be a cohesive connection between input and output or the whole system is suspect.
They’ll never produce an ice age. They’re not capable. The modellers would need to assume unrealistic values and durations for large amounts of aerosols.
There is an accepted mechanism for warming, but it hasn’t really been shown to result in non-negligible warming when all the feedback loops are taken into consideration.
It is my understanding that there is well over 1 million lines of specialized Fortran code to support parallel processing, written by teams over a period of years. It is not realistic to expect any of us to sit down and find a significant problem over a matter of a few days. It would take someone who has been working with the code for years, and is intimately familiar with it, to point out the problem(s), which they may already be aware of. However, because their livelihood depends on them not being a whistle blower, what is their incentive for opening the kimono, as it were?
Clearly, there are some who mistrust the motives and morality of the modelers. Asking someone to review the code is not a practical solution to gaining trust.
We have people such as yourself, who implicitly trust the modelers, when you have no more basis for trust than those here who mistrust them.
Wijngaarden and Happer had a pretty good go at calculating the proper radiation physics for a handful of different atmospheric columns without the complications of clouds. Those calculations considered 501 layers – way beyond what a GCM resolves – and many tens (or was it hundreds) of thousands of spectroscopic lines. Those calculations took significant computer time, albeit they did produce results that gave a good match for TOA measurements of similar conditions. Extending that to the dimensions of GCM spatially and for timesteps, and sophisticating the model to handle clouds would mean that climate models might take the odd century to run.
GCMs only include a parameterised version of the radiation physics. It is inadequate.
From your link:
The climate model you claim is “open source” is simply a subset for the public to play with.
The actual climate model, CESM1, is not open source.
Once again, proving that you never actually read what you link.
You obviously are not a programmer nor ever wrote a model into code.
Your claim that because the programs are open source thereby cannot have hard coded logic, formulae, and dubious designs is specious.
ATheoK,
I am not claiming that open source programs can’t have hard coded logic etc, all I am asking is that those people who claim that they do point out exactly which lines of code they are objecting to. And nobody has done so but they contain to make baseless claims about the programs.
And if you want the actual source code of the latest version go to
https://escomp.github.io/CESM/versions/cesm2.1/html/downloading_cesm.html#downloading-the-code-and-scripts
Willis E has already done this. I distinctly remember him pointing out in the code where it was necessary to put in a limit statement about the freezing of water or the model would wind up with everything frozen.
That is *NOT* a physics based model, somewhere in the model it is distinctly not reality based. When you have to place arbitrary limit statements in order to keep the model from blowing up that means the physics is wrong somewhere.
Tim ==> The answer to “where in the model is warming hard coded?” is this: It is in the physics assumptions that “increased GHG concentrations cause increased energy retention”. They code in a value for how much….which is a guess….an assumption as yet less certain.
“They code in a value for how much”
No, they don’t. They have a radiative calculation where the absorptivity (and hence emissivity) of gas locally depends on GHG concentrations. This is a well-meansred value, going back to Tyndall in about 1861, and of course repeated and improved since.
Kip, you have a lot to learn about GCMs.
And these values of concentration of CO2, H2O, CH4, etc. are accurately known in each cell by altitude how?
Does it really matter if the radiative values are hard coded versus the concentration of GHG’s that determine the values of absorptivity/emissivity that then determine the radiative values?
The end result is not physics based but rather what is thought to occur.
The GHG global concentrations are matters for the scenarios – ie depend on what we do. They are well measured in the past. They are well-mixed jn the troposphere, so the global value can be used.
Ya, right. Look at this NASA video about CO2. Doesn’t look well mixed to me.
https://svs.gsfc.nasa.gov/5115
Look at figure 5 in this study. And, while you’re at it look at the global station distribution. Well mixed and well measured?
https://agupubs.onlinelibrary.wiley.com/doi/full/10.1002/2016JD024917
There has to be so much averaging and infilling it isn’t funny.
Your CO2 video is useless for deciding whether CO2 is well mixed, because there is no key to say what the colors are. You’ll find that the range is about 20 ppm out of 420.
Water vapor is worked out in spatial detail in GCMs. It is tracked from evaporation, rise and condensation. That is straight from the physics.
That is your opinion. To me it illustrates that there is a variance in concentration. If that variance is not accounted for, then it is one more piece parts that adds to the uncertainty of the output.
Sure it is. Again it is modeled by using calculations you think are correct for every point on earth. Show us a study that validates the modeling with actual measurements, say from balloons. Water vapor creates clouds. If clouds are unmanageable in a GCM how do you know the water vapor calculations are correct? One more piece part of GCM’s that has a large uncertainty.
It is no wonder predictions fall apart after a short period of time.
He has claimed to do this. I remember it. It turned out that it was a 400+K lines codebase where he was grepping around for what he thought was the juicy bits. Understanding such a code takes weeks if not months. He spent a few hours with it. So I’m kinda skeptical about his claim.
Furthermore, even if what he claimed was true, it doesn’t mean the modellers used a non-physical model. Because this thing, the melting of thick ice, is just now understood at least broadly in theory. We can’t even describe it properly at the moment, it’s so complicated. If what Willis claimed is true, the modellers just used a statistical model for an extremely marginal aspect in their climate models. FYI models are just approximations.
We know the physics of the planet has yet to result in the earth becoming a ice ball or a fire ball. If the climate models have to have arbitrary limits set internally to prevent that from happening then the physics of the model are WRONG. There is no other conclusion possible.
Approximations mean uncertainty. How is that uncertainty specified for the climate models? I’ve never seen any quoted *anywhere*. That uncertainty would add when the various models are averaged.
You’ve basically just said the models do not provide any “probabilistic outcomes”. So we are to believe they are pretty much 100% accurate. That doesn’t leave much room for “approximate”.
I’m afraid you have a serious misconception of what happened here. (What happened according to Willis, an unreliable source, BTW.) The overall result was marginally different. It wasn’t like fireball or snowball. This was a marginal aspect of the whole thing.
How is hard coded logic, especially arbitrary boundary limits, physics based?
Yes, see above.
Nothing above answers the question. Hard coded boundaries are implicitly showing that not enough is known about the multivariate physics to correctly have the program stay within realistic physical limits without artificially forcing it to happen.
That’s not denigrating anyone’s knowledge or programming skills. It is recognizing that climate science is not admitting that they don’t even know what they don’t know. The religion prohibits that
I don’t think you understand what is going on here. These are not hard coded boundaries. The meltwater on ice response was off so they simply used empirical knowledge. Meltwater buildup etc. is actually very complicated and has to be modeled through the whole depth of the ice sheet. We are talking about Greenland here (1-3 km of depth), and models are not interested in that detail. BTW this is what Willis claims, and I’m not convinced about whether he is correct. Even if he is correct, the models’ correctness doesn’t pivot on this.
Climate science is very clear on describing its limits. Contrary to what you deniers think of it.
Your explanation falls flat. The response was off – that means it was wrong. Empirical knowledge? So they used what they thought was correct! Has to be modeled – where is the proof that the modeling is correct?
I learned early on working with my mechanic father about how the sum of the parts equal the quality of the whole. My engineering degree only emphasized that.
The climate modeling doesn’t begin to approach a cohesive whole where the sum of the parts adds up correctly. Using temperature instead of enthalpy as inputs and outputs. Water vapor and CO2 distributions throughout the globe. Cloud formations. On and on for the parts that are not derived from data and are only parameterized.
Limits are needed because this sum of the parts simply don’t mesh into a global description that matches what is occurring regionally and locally. Modeling adherents are only going to become less and less believed as more and more people begin to ask why they are not seeing the catastrophic results of the entire globe warming.
They have measurements for this. If some variables (mainly temperature) is such and such then meltwater will be such and such. They simply applied this.
It’s so hard to debate people who confuse Austria with Australia… The word “model” is used in multiple senses. Climate modeling is one of them. Most of the time this is about a mathematical model (FYI F=m*a is a mathematical model). Here I was talking about that. We are just about to understand the theory behind meltwater on thick ice.
Yeah, except you haven’t got the faintest idea about this.
Limits needed in this particular point ‘cos there was too much meltwater. This is it. And this is according to Willis, and I have extremely serious doubts whether he got this right. Don’t forget, we are talking about a claim from a person who has a record of plainly being wrong.
Show us a paper that defines this relationship.
Really? Show us where the models never blow up and reach artificial boundaries thru tuning. Quite simply the parts can’t up to a cohesive whole because some of the parts can’t even be quantified into a mathematical relationship.
How about limits in cloud formation. How about limits in a number of other atmospheric phenomena. You are trying to justify ‘physics’ when there are simply too many unknown physical relationships.
The ultimate uncertainty is so large that 1.5 degrees is a fantasy!
For that matter, it was Willis who claimed that they followed this relationship (implicitly implying that there was one). He claimed this. Ie. when they found discrepancy, they applied empirical knowledge.
This is a misconception. The model didn’t blow up. The difference was marginal. This is a marginal aspect of the model.
Quit it. No one believes that all the model runs go to completion based purely on physics based equations.
Please go away 🙂 I like your style of debating
I’m sorry to disappoint you but models are based purely on physics based equations. They are approximations, for sure. E_kinetic = 0.5*m*v^2 is an approximation, FYI (we already have a more accurate formula in Relativity). Most models are coarse, and at least some aspects are modeled with less accurate approximations. In this special case (and, importantly, if Willis is correct at all, and this is doubtful) they used a statistics based model for meltwater. As far as I know this was needed to model more accurately sea level change, and not for runaway effects you allege.
“They are approximations, for sure”
Approximations have uncertainty. I’ve never seen an uncertainty published for a climate model. I’ve never even seen an uncertainty budget presented for a climate model.
Have you?
You have never seen an actual climate model publication, this is the reason. It’s so tiring to write down every time the same… They run the models multiple (very many) times with slightly different starting conditions and inputs. They basically add noise to the parameters. Now models are chaotic (in the mathematical sense) so the actual runs are very different in details. Then they statistically analyze these runs, and this will give them all these things like uncertainty. They actually try to map the climate state attractor that will characterize the system at the far future, and that is what we can call the climate. Each run is a trajectory in this state space.
“Then they statistically analyze these runs, and this will give them all these things like uncertainty.”
Statistical analysis can *NOT* give you uncertainty. It can only tell you how precisely you have located the mean but that does not tell you anything about the uncertainty . The *only* time statisical analysis can tell you about uncertanty is if you have multiple measurements of the same thing under the same conditions. That simply doesn’t apply to multiple runs of the climate model where inputs and algorithms are not the same.
The statistical term “standard error of the mean” is a metric for SAMPLING ERROR, it is *not* the accuracy of the mean. In fact, it is just ONE of the factors that contribute to the uncertainty of the mean.
Every single run of the climate model will have uncertainty associated with its output. It’s inevitable. It can’t be eliminated. Nor can it just be ignored the way you and climate science do. The uncertainties of multiple runs ADD, the more runs you make the LESS certain your averaged output becomes. That even applies to mapping state attractors, the more runs you make the less certain your mapping becomes.
All you are doing is regurgitating the standard climate science meme of “all measurement uncertainty is random, Gaussian, and cancels”.
Even if you’re an idiot, you don’t have to advertise it. The way you calculate uncertainty during calibration is a form statistical analysis, FYI.
Yep. And that’s what they do. The add some (actually marginal) noise to the parameters. And due to the chaotic nature of the system, this perturbation is more than enough for mapping the whole eventual attractor.
Again, you’re advertising your idiocy and your ignorance for being more interesting. Why the hell would they change algorithms? The inputs are given a small amount of noise, but they are the same, and aggregate values are the same.
This is clear by now that you don’t have the faintest idea what modeling is. A model run is just a series of calculations. What is the uncertainty of 2+2? Apart from one single factor, a model run should always give you the same output (ie. no uncertainty). This is why you have to add noise to it. (The single factor is parallel execution where the order of calculations may be different due to thread timing. This may or may not be a desirable property. Some models do have this “problem”, some others eliminate this.)
This is again the age old problem of you Gormans not understanding this.
I don’t think you understand what a state attractor in a chaotic system means. It’s called an attractor exactly for “attracting” trajectories, ie. individual development paths of a system. The totality of these trajectories gives you the attractor. A model run is a trajectory, so any model run is actually a mapping of the attractor, and due to the system being chaotic, any two trajectories tend to diverge. Which is desirable here. The attractor is just a shape in the state space, and with this wandering around we can get a glimpse how it looks like and, more importantly, we can get stuff like temp’s average, variance, precipitation avg+var, etc.
Think you know a lot don’t you? Sonny, I was using circuit and antenna analysis models probably before you were born. I had the advantage of being able to test model output with real world designs. I can assure you errors always arise from things you never expected. 2% resistors, parasitic capacitance between adjacent components, active device characteristics curves having uncertainty.
If you think adding, subtracting, multiplying, and dividing in a computer gives you accurate calculations, then you don’t know, nor have a clue about, what you don’t know.
That is exactly demonstrating that you have no clue about what you don’t know.
How about 2 ±0.5 + 2 ±0.8. The calculation of 2+2 will always give you the same number, but what is the uncertainty in the answer of “4”? How about √(0.5²+0.8²) = 0.9? So the value with uncertainty is 4 ±0.9. What happens in the next iteration when you have 4 ±0.9 + 4 ±0.9? Maybe the √(0.9²+0.9²) = 1.3? And, a value of 8 ±1.3.
Every number representing a physical measurement should have an uncertainty value associated with it! That is life and and an experience you have obviously never enjoyed. I am sure your math and programming skills are admirable. Yet, if you have no idea about the phenomena you are dealing with, you are unaware of how ignorant you sound when you spout 2+2 always gives the same answer.
No. I know that I know a lot 🙂
A lot of people had done a lot of things before I was born. This fact doesn’t make them automatically right in a debate with me.
See? You are clearly wrong here. You don’t have this advantage.
Well, no one believes these calculations are accurate. BTW computers can do a lot more than that.
You are always eager to demonstrate what you don’t know.
This is completely irrelevant. Your idiotic husband, Tim, said each individual model run had an uncertainty associated with it. An individual run has no uncertainty (with a caveat that is unimportant here). Just like 2+2. Otherwise every run with the same starting conditions would give different results. This is false. (Again, with a caveat that is unimportant here.) This is why any uncertainty is modeled in models with added noise. And this is a great example how clueless you are about modeling.
You can’t calculate the uncertainty in this way for multiple reasons. One is that the numerical outputs dependence on the inputs is so complicated even in one single iteration that you cannot keep track of it. The other thing is that this is a chaotic system, so uncertainty would simply fill up the state space quickly. The third reason is, and this is the important thing, that we are not interested in single trajectories. We are interested in the whole state space, we want to measure that.
Wrong. Your model run will give the same results because you use only the stated values but never use any propagation of measurement uncertainty throughout the various process.
You have a very complicated model for calculations using the stated values, why not a similar model for propagating uncertainty? I can guess why, the ultimate measurement uncertainty would dwarf your final values.
It is sad that as you try to conjure up reasons why the models are correct, they never meet real scientific treatment of how measurement uncertainty works. I’ll repeat what NIST says about measurement uncertainty, maybe it will help in your understanding.
https://www.nist.gov/itl/sed/topic-areas/measurement-uncertainty
Most physics, chemistry, and engineering university departments have metrology courses or cover the subject in laboratory classes. It would be worth your while to learn some real physical based lessons on measurements.
“Even if you’re an idiot, you don’t have to advertise it. The way you calculate uncertainty during calibration is a form statistical analysis, FYI”
The only fool here is you. Calibration requires measuring the same thing multiple times under the same conditions. That simply doesn’t apply to climate models where “noise” has been added to represent natural variation.
“Yep. And that’s what they do. The add some (actually marginal) noise “
Good lord! Did you read this before you posted it? You agreed that you need to measure the same thing multiple times under the same conditions and then say they do *NOT* do that!
“Again, you’re advertising your idiocy and your ignorance for being more interesting. Why the hell would they change algorithms?”
To keep the model from blowing up! We already know they have to put in artificial boundary conditions because the algorithms are *NOT* physics based.
“This is clear by now that you don’t have the faintest idea what modeling is. A model run is just a series of calculations. What is the uncertainty of 2+2? “
Climate models are an iterative process. That means that uncertainty compounds with each iteration. An uncertainty of 2 in the first iteration becomes 2+2 in the second iteration!
“Apart from one single factor, a model run should always give you the same output (ie. no uncertainty).”
I thought the models were to emulate a non-linear, chaotic system – i.e. our biosphere. How does a non-linear, chaotic system give the same output each time? You said that you can “map an attractor space” meaning you do *NOT* get the same output each time! Getting the same answer every time can’t “map” anything!
Nor does getting the same answer every time eliminate uncertainty. If the answer is inaccurate or wrong then you just get an inaccurate or wrong answer each time. The “uncertainty” is used to estimate how inaccurate or wrong the answer might be. A very precise meter might give you the same answer every time you measure something but that doesn’t mean the answer is accurate! You still haven’t learned the most basic of terms when it comes to metrology – precision, resolution, and accuracy.
“This is again the age old problem of you Gormans not understanding this.”
No, the problem is you not understanding that (2 +/- 1) plus (2 +/- 1) does *NOT* give you 4. It gives you 4 +/- 2!
“The totality of these trajectories gives you the attractor.”
But you stubbornly refuse to accept that if the trajectory is inaccurate then so is your mapping! Again, your entire worldview is contaminated by the climate science meme of “all measurement uncertainty is random, Gaussian, and cancels”.
This kind of measurement in a computer model would give exactly the same result. I don’t understand how you can’t comprehend this. So that’s why they add a small amount of (carefully chosen) noise to the input and they have numerous runs, each with a slightly different input.
The age old problem of the Gormans’ legendary ignorance. This is not climate science, this is probability theory that is the underlying theory here. It says if two random variables are independent, the stdev of their sum will be sqrt(sum(vi^2)) (“cancel”). The only precondition here is independence. They don’t have to have the same distribution, they don’t have to be Gaussian.
Talk about not comprehending! You don’t understand what uncertainty is and you refuse to learn.
A measurement has both a “stated value” and an ‘uncertainty value”. When you add noise, you are adding a value to the stated value but that doesn’t affect the uncertainty. All you have is “stated value + noise” and the “uncertainty value remains the same. So in essence you are doing nothing to “remove” or “analyze” the amount of uncertainty.
Uncertainty is an interval surrounding a value of a measurand. It means you don’t know and can never know what the real value is inside that interval.
The uncertainty interval is not determined by statistical analysis other than to determine what the probability distribution is surrounding the measured value. From that probability function a standardized interval related to that type of probability function can be determined.
Without doing an analysis of the measured data, you can have no idea what the probability distribution of that data is. Therefore, you can not know what the appropriate intervals should be. Look at the sample uncertainty budgets I posted earlier. There is a whole list of distributions available. Look at the NIST Uncertainty Machine manual that has a list of choices.
From NIST:
https://www.nist.gov/itl/sed/topic-areas/measurement-uncertainty
And you think the factor applied for relativistic speed is measurable in wind speed or convection? Your assertion is known as a RED HERRING!
Exactly. Now tell us the percent error that these approximations cause in the final values. You have never provided an uncertainty value for the models you are defending, why is that? It should be a major part of any scientific endeavor!
No. This is why the classical formula is very good here. This is why you should not reject approximations out of hand. And voila, even you can understand this, see your remark about relativistic formulas. A great step for you.
Because I’m not a climate scientist, that’s why. Please read the relevant material. The IPCC reports are probably too hard for you but there is popular scientific stuff that answers your questions. BTW all model results are shown with uncertainty so the graph looks like a fokkin trumpet, and I can remember you bsing about one of these so please spare me from telling me publications are always w/o uncertainty.
“BTW all model results are shown with uncertainty so the graph looks like a fokkin trumpet,”
Link?
It’s so hard to debate idiots… And all for the wrong reasons. Almost every graph about models show this. How about doing an internet search for “cmip uncertainty graph”? First two hits: http://www.met.reading.ac.uk/~ed/bloguploads/plume.png or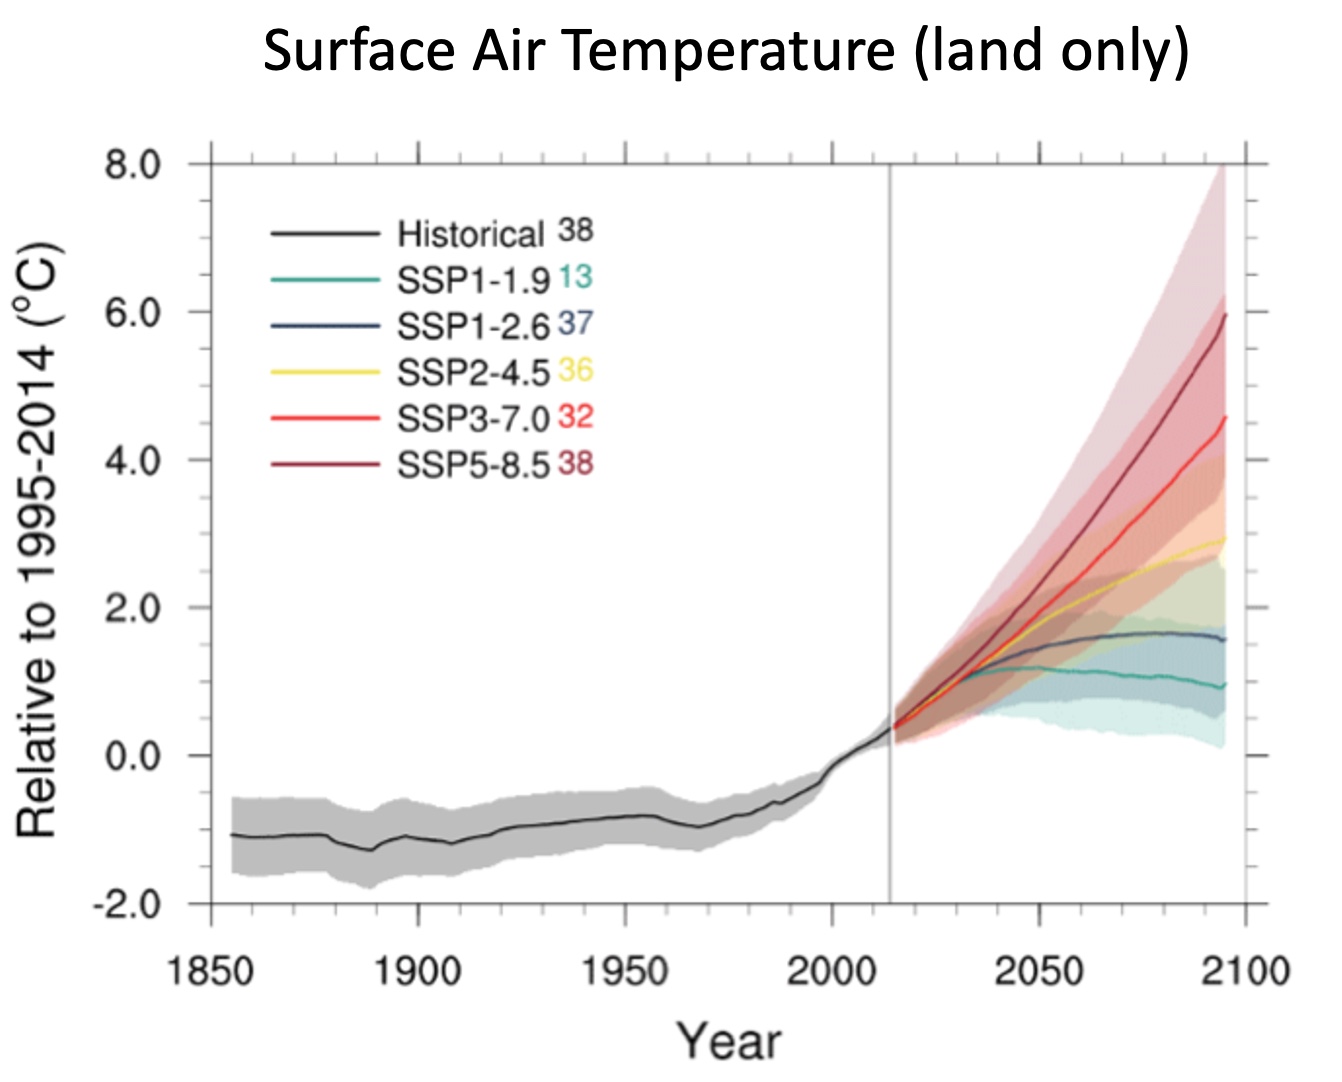 the colored regions are the uncertainty.
The colored regions are the standard deviation of the run outputs. That is *NOT* the uncertainty associated with the models.
Here is what are considered uncertainty in the climate models:
“There are three main sources of uncertainty in projections of climate: that due to future emissions (scenario uncertainty, green), due to internal climate variability (orange), and due to inter-model differences (blue).”
future emissions (input)
internal climate variability (deviation of model runs)
inter-model differences (differences in the models)
Not a single factor for the uncertainty associated with the model output itself due to the approximations and parameterizations in the models themselves. NOTHING.
It’s apparent you *still* don’t understand what uncertainty is. You never have.
Have you checked the first graph I linked? It is coming from the source you cited. How do you think this graph has been calculated, you idiot? They just add noise to the input. The emission scenario is one part of the input, it gets the noise that represents the uncertainty. Other factors (like insolation) get other type of noise.
By the way, you said above:
Apparently you were wrong. Am I correct?
Noise is NOT uncertainty! Jeez, how dense are you?
This just illustrates you have no clue what uncertainty is. Noise is a specific value added to another specific value. It does not evaluate the unknown values that could occur. Your calculation still gives a certain number that is 100% accurate, right?
You just won’t admit that there is uncertainty in every number used and in every calculation.
No one has claimed that. They model uncertainty with noise. In the diagram that your husband cited. You can’t calculate its propagation in a chaotic, nonlinear, high feedback system.
“They model uncertainty with noise.”
Added noise is *NOT* uncertainty. It becomes part of the signal. Suppose the noise has peak values of +1 and -1. When you add +1 to the signal you *still* have uncertainty surrounding the resulting output. If that uncertainty is +/- 0.5 then the signal becomes (S0 + 1) +/- 0.5 and (S0 – 1) +/- 0.5.
Since the climate models are iterative processes then any uncertainty in the initial output compounds as it progresses through the iterative process. It doesn’t matter if you are trying to emulate a chaotic, non-linear, high feedback system or something else.
You are *still* regurgitating the climate science meme that all measurement uncertainty is random, Gaussian, and cancels.
“Have you checked the first graph I linked? “
I did check it. Did you read what I posted about how that uncertainty is calculated?
The “noise” represents “internal climate variability”. It has *NOTHING* to do with the uncertainty associated with all the algorithms, parameterizations, and boundary limits artificially set in the models as GUESSES!
A model that produces an inaccurate answer will *still* produce an inaccurate answer no matter what “noise” you add to it.
You posted what components it has. I posted how it was actually calculated.
By the way, back to your assertion:
So you were evidently wrong, weren’t you? Could you please answer this question.
You posted that you can emulate uncertainty by adding noise – totally ignoring the fact that the noise is meant to emulate natural variability and not uncertainty. Unfreakingbelievable.
Go away, troll. You have no idea what you are talking about. You keep contradicting yourself.
🙂 I always tell you that making up things won’t get you far. Okay. Just a question: how do they calculate the uncertainty of models resulting from the “uncertainty” of emission scenarios? Please entertain me. I’m eagerly waiting for the stupidity you’ll come up with. By the way, emission scenarios are just that, scenarios, they don’t have uncertainty in the sense you have for measurements.
And back to the actual question. I want to cite a classic, a certain Tim Gorman:
You were wrong, weren’t you? We’ve been talking about the uncertainty budget presented for climate models for a few days now.
Wrong? I haven’t seen one posted for any input data from you. Why don’t you show us one?
Here is a sample ISO uncertainty budget. Each and every input to a model should have a budget like this from temperature data to parameterized inputs.
Here is another.
Maybe you have no idea what measurement uncertainty is and how ISO (International Organization for Standardization) requires measurements to be dealt with in order to achieve certification as an entity that has exacting standards in metrology.
That would explain a lot about how climate science treats measurements as entirely accurate numbers.
Your husband, Tim, posted it. After claiming that it was nonexistent.
This is not a measurement in the classical sense. The result is the result of multiple runs. A thing you’re unable to understand.
Horse hockey! Show the uncertainty budget he posted for input data.
More bullshit crap from you. The outputs you are proposing have nothing to do with the measurement uncertainty of the inputs.
Every input to a model should have an uncertainty budget and that combined uncertainty should be propagated throughout the model run.
Here is a paper from Dr. Pat Frank discussing the uncertainty of an input and the result in the output.
https://www.frontiersin.org/journals/earth-science/articles/10.3389/feart.2019.00223/full
“how do they calculate the uncertainty of models resulting from the “uncertainty” of emission scenarios?”
I would start by using relative uncertainty. The relative uncertainty of the input would carry over into the relative uncertainty of the output. Relative uncertainties are percentages, i.e. dimensionless. That is why they are used when comparing things with different dimensions.
“By the way, emission scenarios are just that, scenarios, they don’t have uncertainty in the sense you have for measurements.”
Why do you keep on making a fool of yourself? Future emissions are based on the measurement of CURRENT emissions. Therefore future emission scenarios will carry the same measurement uncertainty as the measurement uncertainty of current emissions.
“You were wrong, weren’t you?”
Still haven’t seen an uncertainty BUDGET! Only descriptions of the uncertainty areas considered – which I have posted. But *NO* values attached or propagated. Can *YOU* post one? I’m not going to hold my breath.
I think we should frame this and put it on the wall as a good illustration how ridiculously off you are.
Oh, I’m sorry 🙂 Perhaps you should read some papers.
I can’t. I’m not interested in this and frankly, I don’t want to waste my time with this. I leave it to the scientists. Brandolini’s law is, unfortunately, true.
In other words you aren’t interested in doing real physical science!
You are just like most climate scientists and assume you know input values with 100% accuracy because you know what you are doing. You should know that doesn’t inspire confidence in anyone!
“Even if he is correct, the models’ correctness doesn’t pivot on this.”
Really? The Earth turning into an ice ball if the model is run without artificial limits is still somehow correct? If the algorithm blows up then the physics behind it is wrong. You can’t fix that wrong by setting an artificial limit. It means the contribution of that algorithm to the output is questionable at best and wrong at worst – making the output wrong as well.
Even if what Willis says is true (there are serious doubts) the problem was too much meltwater on thick ice. The outcome was essentially the same, the difference was marginal.
Apologies for “jumping in” here but …
I’ve just extracted a (very) subjective claim from your post.
Please provide … I don’t know, let’s say … three concrete examples that show what you consider to be “very clear” demonstrations of climate science “describing its limits”.
“Brandolini’s law” is clearly working here:
Anyway, the missing neutrino problem or in climate science the divergence problem are two examples where science is very clear in describing its limits.
There is an old saying about how a chain is no stronger than its weakest link. Well, these partial differential equations, solved in the calculations, cannot be solved rapidly enough for the energy exchanges in clouds to be calculated in our lifetime at the same spatial resolution as all the rest of the variables. Therefore, the cloud energy exchanges are parameterized. That is, assumptions are made about the gross or net behavior and (I presume table look-ups are used) instead of solving the partial differential equations, the ‘best guess’ is resorted to. The vaunted ‘science based’ models are no better than the best guesses that are substituted for actual calculations. That is a lot like a form of Einstein’s famous energy-mass equation being written as E = bmc^2, where b is a parameterized best guess at all the various things that might effect the efficiency of the conversion into energy. “mc^2” is an upper bound on the energy available, but the highly variable b is actually quite important for the yield.
Kip,
The sensitivity of climate models to small perturbations was shown long ago by Williamson. The sensitivity is not due to the dynamics, but to the if tests in the physics.
The physics parameterizations are vertical column wise and thus approximate discontinuous forcing. Numerical analysis requires that the continuum solution be differentiable and discontinuous forcing is not allowed. Thus both Climate and Weather models violate the basic tenets of numerical analysis. To see how the correct dynamical equations will produce similar results in the short term see the recent article by Browning in Dynamics of Atmospheres and Oceans (DAO) that clearly shows that the correct hyperbolic continuum system and corresponding reduced system based on the Kreiss Bounded DerivativeTheory produce similar results over the course of several days as predicted by theory.
It has also been shown that because of this discontinuous forcing violating the necessary conditions to apply numerical methods, inappropriately large dissipation is required to keep the model from blowing up and that destroys the numerical accuracy of the spectral method (Browning, Hack and Swarztrauber).
Jerry
” people think CO2 causes climate change, and program than into their models the models will be wrong. ” JS
That is a false claim made only by conservative science deniers who will never be taken seriously.
Nothing false about my statement. Are you actually claiming CO2 is not programmed into the models?
You guys just don’t get it. CO2 is a TRACE gas. It cannot possibly be the control knob of climate. Calling me a climate denier is wrong. Climate changes massively all by itself. People have no influence on climate other than topological changes on earth’s surface. The biggest climate influence is the sun, followed by the oceans. The only thing I deny is that CO2 is the CAUSE of climate change. All human CO2 emissions added together make up only 5% of the annual CO2 exchange. If you removed ALL of them, nothing would happen different with respect to the climate. It wouldn’t even notice.
It’s truly amazing that the climates of this planet are even more or less stable- given that we’re on a rock spinning around a star. That some people think the climates would be perfectly stable if we didn’t use ff is simple minded. That they think the use of ff is going to be catastrophic for the planet is brain dead.
The reason the climate is as stable as it is, is because it is a huge extremely efficient thermostat. Every molecule of earth’s surface radiates, constantly. Ice, snow, water, soil, plants, animals – all radiating at all times. The rate of radiation is based on its core temperature. When energy strikes the surface, it adds energy to the molecule(s) that are struck. The molecule’s response is to eject a photon to attempt to maintain equilibrium. That response is due to the thermodynamic Stefan-Boltzmann law:
The “thermodynamic law 4th power” refers to the Stefan-Boltzmann law, which states that the total radiant energy emitted by a black body per unit surface area is directly proportional to the fourth power of its absolute temperature; essentially, the hotter an object is, the more radiation it emits, and this radiation increases rapidly with temperature due to the power of four relationship.
Think about that. Every molecule of earth’s surface is responding to added energy by responding literally instantaneously. The ‘skin’ of the oceans are radiating, and cooling. The molecules in contact with those cooled ones add energy due to collisions. Then radiation happens again. This even includes the back of your own hand. It is because of the number of radiating molecules of all of earth’s surface in contact with air that CO2 cannot POSSIBLY cause the earth’s surface to become warmer. The thermostatic response of earth’s surface is many, many TIMES any warming influence a radiating gas may have toward the surface.
The sun warms earth’s surface every day. The RATE of radiation increases as it does so. The RATE of radiation drops at night, but it does not stop, which is why the longer the night, the cooler it gets.
” When energy strikes the surface, it adds energy to the molecule(s) that are struck. The molecule’s response is to eject a photon to attempt to maintain equilibrium. That response is due to the thermodynamic Stefan-Boltzmann law . . .”
Actually, that is false overall when discussing how “greenhouse” gases respond to intercepting LWIR photons off Earth’s surface and equilibrating that excess energy (within the order of picoseconds delay with other atmospheric molecules, mainly nitrogen and oxygen). The LWIR-induced excess energy is distributed to non-LWIR active molecules almost totally via molecular-to-molecule collisions having an exchange of translational, vibrational and rotational mechanical energy from the excited molecule to the lower energy non-excited molecule.
It is a matter of Boltzmann statistical mechanics of gases (and the thermodynamically-driven distribution of molecular energies in a mixture of gases) that governs the energy exchange more than 99.9999% of the time since, in the lower atmosphere the period between molecular collisions in on the order of 10^6 to 10^9 times faster than the characteristic time period for photon-relaxation of an excited molecule.
Molecule-to-molecule energy exchange within in the atmosphere has almost nothing to do with the Stefan-Boltzman law, although that law does govern the bulk thermal emission from the atmosphere as a whole to deep space.
As regards the net exchange of energy of Earth’s “surface” molecules to adjacent atmospheric molecules, that happens much more by the mechanisms of thermal conduction and thermal convection than it does by radiation due to the relatively small temperature differences that are involved between source and sink at that interface.
Collisions can’t add energy … they transfer some energy with a loss …
Ok, collisions. There are three types of collisions. One is a glancing collision, where no energy necessarily will be transferred. Like pool balls. Another is reflection where no energy is transferred, but the original molecule is reflected back with no energy transfer. The third is a collision where energy is transferred from the more energetic molecule to the less energetic molecule.
Now, if we are through nitpicking, we can move on.
By the way, I was a laser engineer for over 20 years. You can make nitrogen, CO2, neon, argon and many other gases lase. It has literally nothing to do with whether they are a radiating gas or not. Most gases will lase given enough energy. The trick is to make it lase at only one frequency, the narrower the better. CO2 lasers are used to cut metal. Nitrogen lasers can cut your finger off. Neon lasers cannot hurt you or anything else. They all work by colliding molecules.
Since you claim to have been a laser engineer for over 20 years, it’s unfortunate to see that you appear to be unaware that lasers—independent of the gas or solid that is the lasing medium—work by achieving a temporary “population inversion” of a higher number of excited atoms or molecules compared to those in lower energy levels, which in turn sets up the condition necessary for cascading, coherent photon production between carefully aligned mirrors (the resonant cavity).
The excited atoms or molecules are defined by those that have electrons that have been “pumped” to higher energy orbitals (aka energy levels) by means of application of external energy, not by molecule-to-molecule collisions. From https://minerva.union.edu/newmanj/Physics100/Laser%20Theory/laser_theory.htm :
“There are three different laser pumps: electromagnetic, optical, and chemical. Most lasers are pumped electro-magnetically, meaning via collisions with either electrons or ions. Dye lasers and many solid state lasers are pumped optically; however, solid state lasers are typically pumped with a broad band (range of wavelengths) flash-lamp type light source, or with a narrow band semiconductor laser. Chemically pumped lasers, using chemical reactions as an energy source, are not very efficient.”
Also, there are commercially-available lasers that only use a noble gas (argon, xenon, or krypton), so the term “colliding molecules” is non-sensical in context.
In Earth’s lower atmosphere, the energy range of LWIR radiation photons is typically less than 0.5 eV, far less than that required to raise an electron in any atmospheric gas from a one energy level to the next higher energy level . . . this is why LWIR-intercepted energy in atmospheric gases appears a mechanical motion, not “electronic” energy.
Exactly. A combination of rotational and vibratory motion. As you say, mechanical motion.
” The only thing I deny is that CO2 is the CAUSE of climate change. All human CO2 emissions added together make up only 5% of the annual CO2 exchange. ” JS
That’s why I call you a science denier. There is 127 years of evidence that CO2 emissions are a cause of global warming and the natural CO2 emissions of the annual carbon cycle are exceeded by annual natural CO2 absorption. CO2 increases in the atmosphere ONLY because of manmade CO2 emissions. That you are a denier of that most basic climate science makes you worthless in the battle to refute climate scaremongering.
Humans ADDING CO2 TO THE ATMOSPHERE IS MINUTE ONE, OF DAY ONE, OF BASIC CLIMATE SCIENCE 101, AND YOU GET AN F.
Yeah 1940 to 1970 says you are an ignorant fool … and a denier of facts … and science
I’ll see that, and raise you . . . as presented in the attached graph, Vostok (Antarctica) ice core data is 400,000 years of evidence that atmospheric CO2 levels follow global temperatures, a period covering about four glacial-interglacial cycles. Humans have produced significant CO2 emissions only after the start of the Industrial Revolution, at most about 260 years ago and equivalent to only the last 0.07% of the ice core data span.
Clearly human “emissions” did not cause the global warmings of about 12 °C total that are documented to have occurred repeatedly over those four glacial-interglacial cycles.
Furthermore, for what it’s worth, Google’s AI has this response to the question “Is there a time delay between a change in atmospheric temperature and a change in atmospheric CO2 level base on climatology?”:
“Yes, according to paleoclimatological data, there is typically a time delay where changes in atmospheric CO2 levels tend to lag behind changes in temperature, with the lag time often estimated to be several hundred years based on ice core records; meaning that when the Earth starts to warm, the CO2 levels in the atmosphere will increase later on in the process.”
Now, you were calling someone else a science denier . . .
RG will do and say anything idiotic to maintain his AGW-cult CO2 warming brain-washed idiocy
Except provide empirical evidence ..
… or show us the warming in the UAH data
Mark Twain said “It isn’t what you don’t know that gets you in trouble. It is what you know for sure that just ain’t so.”
I think you’ve proven you are an ignorant idiot with this comment.
And most of his other comments validate that assessment.
The original charter was to learn how the climate worked, both anothropogenic and natural. That was quickly discarded and the next charter was to determine the magnitude of effects increasting CO2 would cause.
Hind casting. Of course they can tune the models to closely matcth the past. There are plenty of control knobs they can play with. But hindcasting is curve fitting.
I have read the original charter of the IPCC. Their goal was NOT to understand climate, at all. It was to identify only HUMAN caused global warming. That is why they never, ever, talk about the natural climate change – only CO2 and now methane released by livestock and other human activities. They have changed the wording, but the original charter should still be findable, maybe using the Wayback machine.
But I like bashing Planet GIGO Climate models!
Milo ==> Bash away — I just want you to know WHY you are bashing!
Kip: can 0.0000000000001K be resolved by these computers? To ask the question in another way, what is the result of adding one bit to the floating-point zero?
Karlo ==> It’s just a number — the NCAR team did it and their computers did not round it off…apparently. For details, you have to read their entire paper and the supplementals.
When I was reading that section the first thought that I had was that it would be more practical to limit the initial conditions to changes that are close to the real world variance in measured temperatures. I wonder what would happen if they ran the code multiple times with the same initial conditions. I suspect that round-off and truncation errors along with large-step table look ups would result in a behavior similar to what they observed with 0.000000000001K changes.
@karlomonte: Can 1 part in 10^13 be resolved by computers?
A perfectly reasonable question. The answer is yes. At least to the issue of whether computer hardware can handle it, Basically you need 13*3.22 = 44 binary bits (plus a few bits to minimize rounding errors) of precision. 64bit computers use a floating point with 11 bits of exponent and 52 bits of data. But there are packages for computers with smaller word sizes to deal with extended precision. Where did 3.22 come from? It’s 1.000 divided by the base 10 logarithm of 2.
Can the software handle it. In principle, yes. In practice, probably if the coders paid attention to what they were doing.
Thanks. So it is safe to assume the monster computers just use 64-bit IEEE floating point?
Nerd / geek warning : I have always been fascinated by the IEEE-754 floating-point standard.
Note that “0.0000000000001K” = “0.[12 zeros]1K” = 0.1 trillionths of a Kelvin.
Most climate models use double-precision, or “64-bit / 8-byte”, numbers.
Wikipedia URL : https://en.wikipedia.org/wiki/Double-precision_floating-point_format
After using the standard “Right-mouse-button-click –> Open link in new tab” trick, scroll down to the “Double-precision examples” section, which starts with :
Multiply 1.0000000000000002 (+/- 1 in the last digit) by 256 (28) and you get 256.0000000000000512 (+/- 256)… that’s 13 zeros after the “decimal” point …
For temperatures in the range 256|.0]K to 511.999…K double-precision is actually “precise” to something on the order of 0.025 to 0.077 trillionths of a Kelvin, not 0.1 …
.
That’s actually a different question !
From the same “Double-precision examples” section, “adding one bit to the floating-point zero” gives you :
5 x 10^−324 is slightly more “precision” than most people need in practice.
Good!
The way I learned this was pretty simple, that after some number of divisions or multiplication you will run out of bits and rounding errors begin to accumulate.
For addition, subtraction and multiplication the number of operations you can get away with before “running out of bits” depends on the numbers you are operating on.
For division, however, as long as
1) the divisor isn’t a power of 2, i.e. it has “a non-zero mantissa”, and
2) the remainder isn’t zero
then the “some number of divisions” performed before the “sticky bit” comes into use is “one“.
E.g. 1/3 (binary 0.010101…) or even 1/10 (binary 0.000110011…).
If you look at the inner loops of some publicly available GCM code out of curiosity … as we all have (haven’t we ?) … it doesn’t take long before you find a division operator symbol (“/”).
“quoting the IPCC TAR: “The climate system is a coupled non-linear chaotic system, and therefore the long-term prediction of future climate states is not possible.””
The usual hacked mis-quote. What they actually said was:
“The climate system is a coupled non-linear chaotic system, and therefore the long-term prediction of future climate states is not possible. Rather the focus must be upon the prediction of the probability distribution of the system s future possible states by the generation of ensembles of model solutions.”
And that is what they do. The issue of sensitive dependence on initial state is shared by all fluid mechanics. Yet computational fluid dynamics is a major engineering activity. The reason is that the paths diverge, but form a new pattern, the attractor. This is what is shown in the famous Lorenz butterfly. And it is that pattern that is useful.
To take a practical example – you can’t reliably compute flow paths over an aircraft wing. But you can very reliably calculate the lift and drag. And that is what you want to know.
In the example of this article, the GCM will predict that the Earth is warming. Different patterns of warming will satisfy the constraints of the calculation. But total warming is subject to energy conservation, and will not show that variation.
Wrong — averaging results from different models is not a Monte Carlo simulation designed to test statistical variation.
“the GCM will predict that the Earth is warming”
WRONG…
GCMs are programmed to say that the Earth is warming.
It is not a “prediction”, it is an outcome of their programming.
If it were not for solar El Nino events.. there would be no warming in the atmosphere for the last 45 years.
Nick ==> You have used this incorrect line of reasoning over and over. The warming is literally hard-coded in just as you say. If GHGs increase, the code must show warming. It cannot not show that warming. I have written a simulation if GAST in four lines of code that matches the GAST graph in just that way.
The aircraft wing is a red herring, and you know it. Engineers are very careful to keep wing designs within the predictable regions of the dynamical system. When the don’t, the wing shakes itself to pieces. When it gets into the chaotic region, lift and drag do all sorts of crazy things and the plane crashes.
You misunderstand what chaotic attractors are and their utility. No one has any idea what the chaotic attractors of the coupled climate system might be. Or if there is one, two,or millions of them. The cycle of true Ice Ages might be due to some type of chaotic attractor, or just a cycle two.
Numerical climate models do not produce anything that can be called “ probability distribution of the system s future possible states by the generation of ensembles of model solutions”. That’s what R G Brown calls, quite correctly, “an absolute statistical obscenity “.
“When it gets into the chaotic region”
It’s always in the chaotic region. Turbulence is chaotic flow. And the attractor is the mean flow, as determned by conservation of mass, momentum and energy. In practice, turbulent CFD is just laminar CFD with a modified viscosity. The trick is getting the modification right.
GCMs are the same. Manabe was able to get a pretty good model going just making assumptions about turbulent viscosity. GCMs basically resolve the larger scale turbulence, but still leave sub-grid to modelled turbulence.
You determine the attractors by the statistics of solution trajectories. That is what the full AR3 quote is sayig.
I actually think RG Brown knew very little about this stuff.
Nick ==> well you re right here: “Turbulence is chaotic flow”….that’s why engineers modify aircraft wing designs to avoid turbulence.
But the “mean flow” is not a chaotic attractor, it is just the mean flow. Flows are not always in the chaotic region. Some flows are smooth but if pushed in certain ways, become turbulent and can be destructive — that’s the chaotic region.
You should read half a dozen books on Chaos and get some grounding in the subject.
“.that’s why engineers modify aircraft wing designs to avoid turbulence.”
Again, they can’t avoid turbulence. The Re is huge and the air is always turbulent. What they try to do is to avoid adding to the turbulent kinetic energy, because that creates drag.
I think you are mixing up turbulence with flow separation, which if it goes wrong leads to stall.But you can get that with laminar flow.
Sensitive dependence on initial conditions is not something computers invented. It’s real, and they merely emulate it. Watch the stram of smoke spreading, or drop some ink in a river. Neighboring particles are taken to very different places. But the smoke still has a structured plume.
Nick ==> “Sensitive dependence on initial conditions is not something computers invented.” Of course it isn’t! Not quite sure why you mention it.
You should read the whole Deser and Kay paper.
Sensitive dependence on initial conditions is a feature of non-linear dynamical systems. But numerical chaos is just that….it is a simulation of real world chaos which does not look or act exactly the same.
Feel free to dodge around the point of this essay with your aircraft wings — but it has almost no relevance to the problems of numerical climate models.
“You should read the whole Deser and Kay paper.”
Yes, I have. And it confirms what I said. The spatial distribution may vary, but the global warming, which is what is usually quoted, varies very little with initial values:
“In response to the applied historical and RCP8.5 external forcing from 1920 to 2100, the global surface temperature increases by approximately 5 K in all ensemble members (Fig. 2). This consistent ∼5-K global warming signal in all ensemble members by year 2100 reflects the climate response to forcing and feedback processes as represented by this particular climate model. In contrast, internal variability causes a relatively modest 0.4-K spread in warming across ensemble members. The global surface air temperature evolution in the CESM-LE simulations is similar to that in CMIP5 CESM1(CAM5) experiments contributed to CMIP5 (Meehl et al. 2013).”
Nick ==> Quoting a bit about the one value that is a hard coded based on GHG increase is silly at best. Temperature is not the only climate factor of concern.
Of course the temperature isn’t hard coded. If it was, there wouldn’t be variation.
The GCMs include a radiative model, which incorporates the tendency of CO2 to obstruct IR. Well, there is no doubt that it does. That goes back to Tyndall and beyond, and was well quantified by Arrhenius.
All totally irrelevant, and mostly not at all correct.
Fluid dynamics –
I love it when you talk dirty Nick.
🙂
The relationship between velocity and reynolds number is dependent on the characteristic length of the object within the flow. Only the boundary layer of airflow over a wing is turbulent until you reach stall or have a physical perturbation. You inadvertently address this in your separation comment. Only laminar flow has “lines” to separate. CFD doesn’t really address fluid motion within the boundary layers except to calculate thichkness and, as you mention, separation point.
You are mixing up what engineers do with testing with what models provide. I wouldn’t fly (and neither would you) in an airplane built solely to specs provided by modeling. There is a reason for that. You might tell the folks what that reason is.
Oh, Kip… You’re asking a man that refuses to understand Chapter 1 of Introduction to Statistics to read books on chaos theory. Now that is the definition of tilting at windmills!
Aerodynamicists can’t eliminate turbulent flow, much as they would like. They can, however, design to minimize it.
What we need is- to figure out how UAPs fly without wings or any obvious energy source. Of course many people will dismiss the UAP phenomenon, but Congress is having another hearing next week on this topic- I think next Wednesday. Maybe the aliens have mastered climate models. 🙂
Just to note:
1) turbulent flow (at higher Reynolds numbers) can produce lower drag coefficients than laminar flow (at lower Reynolds numbers) . . . that can be a very good thing for aerodynamic design,
2) turbulent flow over an aircraft wing delays the onset of aerodynamic flow separation, a very good trait related to wing “stall” performance.
We can be TOTALLY CERTAIN that Nick knows very little about this stuff.
I think he knows, but will not admit the truth.
I think that is closer to the truth. Stokes has a bad habit of arguing to win, even if he has to twist the truth.
‘To take a practical example – you can’t reliably compute flow paths over an aircraft wing. But you can very reliably calculate the lift and drag. And that is what you want to know.’
Beautiful. I assume this means that you would have no qualms about putting your family aboard an aircraft design that had never undergone any wind tunnel or in-flight testing.
‘In the example of this article, the GCM will predict that the Earth is warming. Different patterns of warming will satisfy the constraints of the calculation. But total warming is subject to energy conservation, and will not show that variation.’
You cannot be serious. There is no agreement among the various models as to what the ‘total warming’ will be. And even if there was agreement, it would be meaningless since the projected ‘forcing’ at any time step is dwarfed by the errors arising from each models’ mis-specification of cloud impact.
Here, written back in 2005, is a Boeing review of the use made of CFD in aircraft design. The abstract:
“Over the last 30 years, Boeing has developed, manufactured, sold, and supported hundreds of billions of dollars worth of commercial airplanes. During this period, it has been absolutely essential that Boeing aerodynamicists have access to tools that accurately predict and confirm vehicle flight characteristics. Thirty years ago, these tools consisted almost entirely of analytic approximation methods, wind tunnel tests, and flight tests. With the development of increasingly powerful computers, numerical simulations of various approximations to the Navier–Stokes equations began supplementing these tools. Collectively, these numerical simulation methods became known as Computational Fluid Dynamics (CFD). This paper describes the chronology and issues related to the acquisition, development, and use of CFD at Boeing Commercial Airplanes in Seattle. In particular, it describes the evolution of CFD from a curiosity to a full partner with established tools in the design of cost-effective and high-performing commercial transports.”
:From the conclusion:
“During the last 30 years at Boeing Commercial Airplanes, Seattle, CFD has evolved into a highly valued tool for the design, analysis, and support of cost-effective and high-performing commercial transports. The application of CFD today has revolutionized the process of aerodynamic design, and CFD has joined the wind tunnel and flight test as a critical tool of the trade. This did not have to be the case; CFD could have easily remained a somewhat interesting tool with modest value in the hands of an expert as a means to assess problems arising from time to time. As the reader can gather from the previous sections, there are many reasons that this did not happen. The one we would like to emphasize in this Conclusion section is the fact that Boeing recognized the leverage in getting CFD into the hands of the project engineers and was willing to do all the things necessary to make it happen.”
The utility of CFD has only grown since 2005.
But has ABSOLUTELY NOTHING to do with climate models.!
CFD’s are part of a design process, which is checked, verified, tested, checked, verified, tested, checked, verified, tested,….
… every time they are used.
They are the total opposite to climate models.
The utility of climate models has NOT grown since for-evah
They are still meaningless assumption and conjecture driven junk science.
bnice ==> The important part left unmentioned by Nick (every time he brings this up) is:
“CFD has joined the wind tunnel and flight test as a critical tool of the trade”
No one would ever actually fly in a plane based in a CFD analysis alone. The WHY is chaos! In order to make sure that some tiny initial condition has not inadvertently shifted the flow into destructive turbulence, wind tunnel tests and then flight tests with dare-devil test pilots doing their best to push the design to and past its limits.
Not to mention that the geometry of a wing, and the airflow over a wing, is trivial compared to the flows of energy in, out and within the Earth’s climate system.
nailed it!
“No one would ever actually fly in a plane based in a CFD analysis alone.”
A bit like saying that no-one will ever get in a car without a driver. But they will.
Currently they use CFD+wind tunnel etc. But the thing is, they all agree.
In fact, wind tunnel sounds reassuringly real. But it isn’t. It is a much reduced scale model, and many things have to be adjusted accordingly. How? From fluid dynamics theory – effectively CFD.
Here is more praise from Boeing:
“Significantly fewer wing designs were tested for the 777 than for the earlier 757 and 767 programs. The resulting final design would have been 21% thinner without the ‘‘inverse design’’ CFD capability of A555. Such a wing would not have been manufacturable due to skin gages being too thick for the automatic riveting machines in the factory, and it would have less fuel volume. Conversely, if the wing could meet the skin gage and fuel volume requirements, the cruise Mach number would have had to be significantly slower. In either case, the airplane would not have achieved customer satisfaction. The effect of CFD wing design in this case was an airplane that has dominated sales in its class since being offered to the airlines.”
CFD is not just a backup – it can do things that nothing else can.
The reason that CFD works is because, over the design space, the models DO NOT exhibit the kind of sensitivity that GCM’s do over THEIR design space. When you have GCM’s where the horizontal cell size is 100km x 100km, you realize that you can hide a dozen thunderstorms in that area and that means you can’t model thunderstorms in your model. CFD’s get down to millimeters. It makes a difference.
Yes, you can’t model thunderstorms. The idea is to model climate.
Nick ==> They can’t even accurately model a huge weather feature like a hurricane path past 24/72 hours…
If you can’t model major regional climatic events, you can’t model regional climate. If you can’t model regional climate you can’t model global climate.
“The idea is to model climate.“
At which the FAIL ABSOLUTELY !!
“A bit like saying that no-one will ever get in a car without a driver. But they will.”
What a truly GORMLESS and IRRELEVANT comment !!
You have just shown that you have ZERO CLUE how engineers use models.
You have shown you know nothing about fluid dynamics either.
Climate models NEVER agree with each other.
You have just destroyed the use of GCMs as being even remotely useful for anything except propaganda.
Nick ==> That is all very interesting — although Boeing is having some trouble with its real world planes recently.
CFD is a preliminary step — it can tell them if the thing is not going to work at all from the get go. If a design gets past CFD — happy day! Now they can test a model in a wind tunnel. I bet you know that not all wind tunnels happily succeed “because CFD”.
And, right on, wind tunnels are just the next step in seeing if the theoretic CFD output works in the wild. If nothing awful happens in the wind tunnel tests, they might go as far as trying a full scale model in the air.
They don’t put passengers in the ‘because CFD says its good” version. They put test pilots. Some of those designs crash — not at the easy tests (hopefully) but when pushed….that’s chaos.
Nick – “Currently they use CFD+wind tunnel etc. But the thing is, they all agree.”
You may recall the “porpoising” problem with F1 cars when the regulations changed for the 2022 season to make close following easier without the following car losing downforce. Those designs were simulated in CFD and tested in wind tunnels, by very competent people, and yet around half the grid ended up with problems once they were actually able to drive those cars on track. Still not fully solved for Mercedes.
Thus it remains that a competent engineer won’t rely only on computer simulations or even close simulations using physical models where all parameters are not exactly as real-world. The final test needs to be the real thing doing the real job. The simulations only help make you confident that someone won’t die when it’s tested for real.
There’s going to be some other disasters once people have become used to AI giving the right answer nearly all the time, and stop being diligent about cross-checking everything. With the Global Circulation Models, it is believed that all the physics and maths involved in the algorithms and programming is right, and so the output must also be right, but this is a misguided belief (and you obviously believe that). The proof Kip shows here, with a trillionth of a degree different starting conditions, should prove that that belief is unfounded. It was always known that the starting conditions for the model were critical, and that getting them a bit wrong could end up with a predicted snowball or hothouse. The reason is that that Climate Sensitivity number puts in positive feedback, and unless your model includes a way to counter that and replace crazy numbers with numbers that could be real, it’s going to screw up. The real world obviously has a strong negative feedback, since otherwise we wouldn’t be here to talk about it.
Thus you can’t rely on the predictions for more than a few weeks into the future for weather, and it takes 30 years to decide what the current climate is, so you can’t predict the climate. Maybe doesn’t help that the climate models assume CO2 controls temperature, when it seems very likely it’s the other way around and the (natural) temperature rise of the ocean controls how much CO2 is absorbed or released.
“ It was always known that the starting conditions for the model were critical, and that getting them a bit wrong could end up with a predicted snowball or hothouse. “
It wasn’t known, and it isn’t true. In fact the opposite is true. To start they wind back to an earlier time when the initial conditions are even less known than now. That gives time to converge to the attractor. GCMs then yield the fairly consonant predictions that we see know. They don’t sometimes give a hothouse, sometimes a snowball. The reason is that they are constrained by the basic physics that we are trying to reveal.
Nick ==> But, they do not converge see the starting point of this essay => Deser and Kay. They
DI
verge into individually different regional climate states, even for a metric as vague as temperature trend.
The attractor is unique in some respects and not others. With Lorent’s butterfly, the attractor is that shape. You can’t predict where you’ll be on it, but you can predict that you will be on it. The global trends converge, even when the regional trends do not. That is because the underlying conservation laws say how much heat the Earth must retain; they don’t say where it will be.
Nick ==> You are just saying that “There will be weather and there will be a climate … we just can’t know what it will be.”
That is not very predictive.
Your hard-coded physics assumptions are responsible for “successfully” predicted warming. See the 30 Earths. Some have long-term cooling northern regions.
In other words, the sum of the parts are different than the whole. This makes no sense, especially when starting with small parts.
What you are basically saying is that smaller and smaller grids don’t really matter. The whole globe will be what it is regardless of the piece parts! Good luck with that
They converge into an output resembling a linear relationship! Where does the chaos disappear to?
As Pat Frank has demonstrated.
And some have died from their folly.
Years ago I remember seeing a “Modern Marvels” that had to with advances in designing vehicles.
The part I remember toward the end had to do with a company designing bumpers for pickup trucks using AutoCAD.
After they designed a good bumper, they didn’t put into production until after they’d built and crash tested prototypes. If they didn’t perform as expected, the new data from the real-life test were incorporated into a new AutoCAD design and tested again.
Climate models have been making projections for decades.
Have they ever passed the reality test?
Yet they’ve still been “put into production”.
One difference between the CFD code used by Boeing and the climate models is that the CFD code has been validated by comparison of CFD predictions and experimental data. I would assume there was a lot of tweaking in the development of the CFD code to get a better match between the output of the code and results of experiments.
One other difference is that one will rarely see phase changes in air flowing around an aircraft in flight. Phase changes in water play a very significant role in weather and climate. Phase changes tend to be very non-linear.
All models are incomplete, but some are complete enough to be useful.
GCMs are basically weather forecasting models. As such, they are constantly being validated by outcome.
WRONG AGAIN.
Weather models are very often inaccurate even over a few days.
They being in-validated by outcome.
If weather models worked as you are trying to say, they would always be accurate over a few days.. and they aren’t
That makes them TOTALLY USELESS over any longer time period.
And the error rates for false-positive predictions (such as rainfall, snow, thunderstorms) are usually higher than the false-negative predictions.
Read what you just said. Now imagine how much we should bet on a weather forecast for 75 years hence. Is it $10 or $400trn?
Exactly. They can’t tell you what the weather will be on a day. But they can tell you the climate change.
Wrong. After just a few iterations they become nothing more than linear projections of atmospheric CO2 concentration.
Nick ==> They are constantly being shown, in real use, that they have very serious limits past certain time limits — even as simple as “Is it going to rain on our parade?”
“Nick ==> They are constantly being shown, in real use, that they have very serious limits past certain time limits — even as simple as “Is it going to rain on our parade?”’
It’s like target shooting. 10 yards out, not hard to hit the bullseye even if just on the edge. The same shot 100 yards out? 1,000 yards out? Might miss the target completely.
They lose synchrony, the ability to predict weather events. But they produce weather to be expected of the climate. And if the environment changes, the weather will be of a kind you expect for the new climate.
Got any evidence of these claims?
Of course he doesn’t. The climate models can’t predict next years weather as well as the Farmer’s Almanac! The climate modelers should start talking to the FA’s modelers!
Exactly the opposite is the case, but he will never admit this.
Models Uber Alles.
They can’t even predict weather close in let alone far out. The Farmers Almanac does a better job of predicting the weather next year than the climate models do. Maybe the climate modelers should start looking at the FA’s algorithms.
So you are saying that someone has taken large numbers of weather forecasting model results and shown that they are validated. What is their definition of validation? When they tell me there is a 30% chance of rain and it starts raining, is the model validated or 30% validated?
The climate models don’t even offer probabilities so what are they validating?
A CFD model can be compared to a set of well controlled experiments where a single parameter can be varied by defined increments and the response of the model and the real world can be compared. When used for the aerodynamics of an airplane, the CFD analysis is often for a steady state case (simpler initial and boundary conditions), with exceptions including stalling of an airfoil. Another exception is modeling of airflow through a gas turbine (rotor versus stator blades) or water flow through a hydraulic turbine.
GCM’s involve a lot more then just fluid flow, so treating a GCM as a glorified CFD model is being naive.
Modelling of airflow through a gas turbine also involves more than just fluid flow. But CFD does it.
I’m quite aware that a complete model of a gas turbine involves a combination of fluid flow, thermodynamics of gases and chemical thermodynamics. The most valuable use of CFD for gas turbine design is in the design of the compressor which is more of a challenge to get high isentropic efficiency than the turbine.
Rocket engines are even more of a nightmare to analyze. There’s a reason why the methane and oxygen are converted to gas before entering the combustion chamber of the Starship engines.
Validating the CFD for a gas turbine is much easier than weather as one has much better control of experimental parameters along with better measurements of the states of the fluids in the engine.
With the possible exception of the combustion process, there is nothing in the multiphysics model of a combustion turbine that the very abrupt non-linearities of cloud formation. Perhaps the closest equivalent to modeling clouds is a large solid rocket motor.
Which climate model is right?
i have lost track of how many have been produced
You don’t get to the correct one until you average all of them together — NOT.
Not all fluid flow is chaotic. Climate is.
The point is that Boeing has not advanced CFD’s to the point where they are used in lieu of wind tunnel and flight testing. Why is that?
What did CFD modeling do for Boeing’s spacecraft and the rigors of space flight?
CFD isn’t very useful in space.
The spacecraft doesn’t start out in space. It has to traverse the atmosphere first – where CFD *should* provide insight to the stresses and strains on the spacecraft which could cause the leaks that were detected.
It’s just a perfect example that you can’t beat real world testing when it comes to computer models telling you all you need to know. It’s no different with climate models. It’s why the Farmers Almanac can forecast next years weather better than the climate models.
You can compute flow paths over a wing, until you reach the point of boundary separation. Longitudinal flow path was not really of importance early on since wind tunnel testing was used to evaluate vorticity effects. But since computers have advanced a lot in the last 40 years, they can now handle the level of calculations necessary to include that kind of movement. Hence improvements in wingtip design.
FYI, Stall results when there is no longer enough flow length to support the aircraft.
And yet the postulated “future possible states” they manage to convey is that it is “worse than we thought”. But perhaps you can shed light on those bright future outcomes that don’t get a mention. 😉
Rather the focus must be upon the prediction of the probability distribution of the system s future possible states by the generation of ensembles of model solutions.”
UNfortunately, all the research that I have done indicates that of a spread of trajectories in a chaotic system none are ‘more likely’ than any other over anything beyond a short term.
You may fire a hundred shots at the president from a mile away, but that is no guarantee
that even if the ‘centre of gravity’ of all the shots is the presidents head, any of them will actually hit.
In short ensemble forecasting is deeply flawed. There is no probability distribution.
Leo ==> Thank heavens for a reader who knows something about Chaos! R.G. Brown at Duke spent a year trying to find predictability in chaotic output on just that basis.
In a strange attractor, the next point will appear somewhere on the attractor path, but where, or even in what region of the attractor, is not predictable in any way whatever.
Nothing wrong with using probability distributions of PAST weather and climate — that’s basic weather forecasting: “What happened last time conditions looked like this?”
But probability distribution of chaotic output (see the 30 Earths image) would be worthless — it they had run a thousand projections, they would have a thousand different outputs!
There can only be one best model, with no guarantee that it is good enough to be used to meet testing requirements. If one model is, by chance, usably accurate, than averaging it with all the other inferior models just dilutes it and makes it unusable. It is possible that of several models, none are accurate enough to be usable if there is a strong bias to all of them.
Ensembles are another fantasy that averaging can solve all of one’s problems with measurements.
“…. future possible states…”
Not useful. No reason to think it includes ALL possible future states. Fluid dynamics is extremely simplistic compared to modeling the climate of the planet. It’s not as if all relevant variables are known.
These are instantaneous effects and are nothing like a GCM projecting future state millions of times over using the protected state as the starting point for the next projection.
Well, you’d hope lift is not an instantaneous effect, and will last, as predicted, at least the duration of the flight.
You would. But you dont need to accumulate it to get to the destination.
So, translated, it really doesn’t matter how accurate a given model “solution” is nor how much one model’s predictions may disagree with another’s predictions, we (the IPCC “scientists”, hah!) assert that the prediction of the probability distribution obtained from a number of such innaccurate models (an ensemble currently comprised of about 30 totally different supercomputer climate models) will be a worthwhile thing to “focus” on.
Such unbelievable gobbledygook! . . . both scientifically and literally.
And you’ve bought into it . . . hook, line and sinker! Not surprising, really.
If the warming is minuscule, it is not important. It is only if the warming is substantial that there is a problem.
I’ve found ‘models’ useful in business management.
For example, working out how many installers I needed to keep up with various volumes of sales results for software systems.
But there I’m working with circumstances and variables that I could rely on based on real-world documented experience.
For a while there we were selling a sophisticated shift rostering system to McDonalds franchisees.
Worked a treat for them.
So the Probity and Provenance of the data inputs were unquestionable.
Can’t say I have the same confidence about the Probity and Provenance of “data” inputs for climate models.
And there’s shitloads more funding & resources to get these values right than the Maccas guys ever had.
What’s Up With That?
Mr. ==> Your models are tame — they do not include “non-linear dynamical systems”, the formulas of which are often unsolveable.
Thus, your models, if done correctly, will produce usable results. But your models will only tell you what you tell them to tell you, using mathematical and logical formulas.
Good modelling can produce good results.
But the hubris is thinking that non-linear dynamical systems will always produce smooth predictable results instead of chaos — so far, all real-world dynamical systems have been found to have chaotic regions.
So just like A.I.?
Mr. ==> Yes, kinda. If your model says: “Profit equals gross income minus expenses”, you have told it what to tell you — you just have to fill in this month’s numbers.
Oh if it was only that simple Kip.
It’s always a juggling act to manage actual cashflow to posted trading transactions.
That can be an intervention of mind-boggling scale.
Model your accounts receivable all you like, but most often that’s as chaotic as you’ll ever get.
“the check’s in the mail”
Mr. ==> I have a relative and a close friend, both CPAs. I only give a simplified version of a model for profit — the actuality is always far more detailed and can be complex. But, as you must know, the choice of the model to use is how books are cooked, so to speak.
Spreadsheets software packages are the best business management tools ever invented i.m.o.
Starting with SuperCalc in the 1980s, they gave us the tool to construct scenarios we would never have done with pen & paper.
‘Models’ could get as complex as we wanted them to be, but we always need to use inputs that we know are real to our world, not someone else’s made-up constructs.
Was “Visicalc” or “MultiPlan” on the Apple IIe iirc.
Way too long ago !!
brice2000: It was VisiCalc I believe — only useful , robust piece of software I encountered for that cheap, cute, but rather useless piece of hardware. I was forced by upper management decision to try to run an office using those things. Not a fun experience.
Finally, my boss managed to find sufficient funds to build up a couple of IBM PC clones from parts thus ending the nightmare.
(But I was REALLY impressed with Steve Wozniak’s Apple II disk controller built entirely with cheap TTL ICs. An amazing thing, that. And it actually worked.)
As you say, it was a long time ago.
I recall having fun using the games port of the Apple IIe to control motors and sensors on a crude machine using Applesoft Basic “peaks” and pokes”
Made a little car that followed a thick black curvy line.. Great fun.
Also remember being asked if I could get the stupid thing to talk to a dot matrix computer and do underlining etc from the word processor using escape codes….. Not so much fun !!
My first experience was with Visicalc on an Atari 800. Although, I really liked Oxicalc(?) on my Amiga 1000. I could grab an outlier on the graph and move it to align with the rest of the data and the value in the cell would be updated. It was a useful feature for something that changed slowly, like population.
Here’s my simple one page leveraged buyout model which was used successfully, (and unsuccessfully) for many years by many companies, (and the Bank of England even bought a version).
http://www.equityventures.co.uk/MBOstructureandvaluationmodel2017.html
What the business plan said and what transpired was never the same.
The Alum Rock Unified School District gave me a distaste for math, so I can sorta do it, but am not really comfortable with it. So what I understand, as far as the Lorenz equations accurately describe weather and climate, the chaotic nature of those equations means predictions are impractical.
And anyone purporting to make such predictions is blowing smoke.
Tom ==> That’s sort of it…but not quite. Lorenz created a toy climate model with just a few variables. Even that toy model produced unpredictable chaotic results after a few steps, despite being entirely deterministic. His model does not in any way “accurately describe weather and climate”. Neither do today’s climate models.
It was that discovery that led to the field of study now called Chaos Theory (which is not a theory).
The hurricane path example shows how this plays out in the real world. Despite the object being studied — “where will this storm go in the next few days”, the best models in the world all get different answers beyond 24 hours…..Hurricane models are just special purpose weather/climate models, based on the same basic code sets.
My wife is a model and mostly makes all the decisions!
Woops…
As my wife mostly makes the decisions, she must be a model!
Bill ==> Now, that is the correct use of a model in decision making! I have a “model wife” and usually defer to her decisions as well.
My household is modeled after the UN IPCC model: She is often wrong, but I dare not say so. And creative math is often used to make purchase/policy decisions.
Dave ==> Hope she doesn’t read here….
Taking the piss, Bill?
🙂
Cuba lost power even before Rafael formed as a tropical storm. Such happens in a communist state.
>> This is not an easy topic.
Actually, understanding some of the problems of climate models is not difficult
You discuss initial conditions leading to uncertainty and a “washing out” of models being related to reality.
On WUWT I mentioned several times “On the increased climate sensitivity in the EC-Earth model from CMIP5 to CMIP6” https://gmd.copernicus.org/articles/13/3465/2020/
“””The ECS increase can be attributed to the more advanced treatment of aerosols, with the largest contribution coming from the effect of aerosols on cloud microphysics (cloud lifetime or second indirect effect). The increase in climate sensitivity is unrelated to model tuning, as all experiments were performed with the same tuning parameters and only the representation of the aerosol effects was changed. “””
So the physics changed a bit between CMIP5 and CMIP6 and a finer grid was used (disclaimer Only for this GCM series, many other remain untested. ) showing that CMIP5 models had huge systematic errors (about 25%).
What these do to global climate models can be seen and read here:
http://dx.doi.org/10.13140/RG.2.2.11035.64808/1
Who know how big the systematic errors in CMIP6 models still are, I bet at least of the same magnitude!
This is another reason to be very skeptical of model based warming or climate projections
Laws ==> The right-hand image is the sort of Feigenbaum tree that results when a non-linear dynamical system moves from the predictable linear states into the chaotic region — it basically fills the entire solution space. See he links on Feigenbaum tree.
>> The right-hand image is the sort of Feigenbaum tree
No, not at all! There is nothing chaotic about incomplete models, they are just wrong.
It is something entirely different than what you discussed above!
You discuss the effect of different (but close) starting conditions in a non-linear system.
The articles I mention discuss the effect of incomplete models
(Exxon scientists used a flat Earth among other shortcomings, the cited CMIP5 model had incorrect “cloud microphysics”)
The unavoidable result are increased uncertainties for the output parameters as the model is systematically wrong!
That would happen for an incomplete linear model just the same way and has nothing to do with your article besides being another significant shortcoming of current climate models.
Beware of non-linearity in your model, but also beware of relevant shortcomings of it, as both are potential GIGO pathways.
Laws ==> I only point out the similarity of appearance of the two images.
“This variability is numerical – the numbers vary and they vary because they are numbers [specifically not weather and not climate].”
That was my ahaaa moment. Thank you for an elegant explanation.
denny ==> Of course, weather varies too, doesn’t it. But weather only has one realization at each moment and each place. It is not easy to explain why the chaos in numerical models is different than real world chaos in dynamical systems.
But numerical models are like “maps” and the real weather/climate is the “territory”.
Numerical chaos creates wonderfully strange and beautiful mathematical creatures called “Strange Attractors“.
“The Lorenz attractor is an example of a strange attractor. Strange attractors are unique from other phase-space attractors in that one does not know exactly where on the attractor the system will be. Two points on the attractor that are near each other at one time will be arbitrarily far apart at later times. The only restriction is that the state of system remain on the attractor. Strange attractors are also unique in that they never close on themselves — the motion of the system never repeats (non-periodic). The motion we are describing on these strange attractors is what we mean by chaotic behavior.”
What this means in reality is that each “next point” can be literally anywhere as long as it stays on the attractor. Point 21 may be near or far from Point 20 — it is entirely unpredictable. The only way to know is to actually calculate up to Point 20 and then Point 21. Totally deterministic but totally unpredictable — the only known is that 21 will be somewhere on the attractor.
Here is the problem. You can ask someone to create a model to support your point of view and they can do it. By the same token you can ask someone to create a model to dismantle someone else’s point of view. To bet your life, your career, your livelihood on a model is the height of ignorance. Models don’t prove or disprove anything they only provide an additional point of view.
Bob ==> Quite right — models can supply supporting evidence but in the end, models cannot produce new information or ideas…..they only produce expressions of the coded assumptions and supplied evidence (input data).
If one codes in a tropospheric hot “spot” (significant positive water vapor feedback in the atmosphere) and a “hot spot” doesn’t appear based on decadal observations, should any credence be given to that model? Should multi-trillion dollar investments be made based on the collective output of models with that inherent assumption. Should we fire people that make wildly improbable assumptions about future CO2 concentrations (RCP8.5) and cramming that into CliSciFi models proven to run irredeemably hot?
A model is not useful if it based on contrived nonsense. There is no such thing as the “greenhouse effect” able to alter earth’s energy balance.
It only took a few question for Perplexity Ai to get this and even know why it is correct”
As Perplexity points out – it is clouds. Also known as atmospheric ice; the solid phase of water; forms at a precise temperature of 273K at a precise altitude for the prevailing saturated conditions and atmospheric mass over warm pools during convective instability.
Clouds provide a powerful negative feedback over oceans warm pools regulating at 30C. The sun can be as intense as 1450W/m^2 at the top of the atmosphere yet only a tiny fraction of that will make it to the ocean surface. Climate models cannot replicate this process because they do not have the requisite vertical resolution.
Climate models are wall to wall BS based on incorrect assumptions. The most critical failure is that clouds are not the result of parameters. The are a function of precise physical phenomena.
Rick ==> Not a fan of social-engineered AI responses — well, not a fan of LLM AIs or generative AI.
But thanks for the viewpoint.
Hi Kip. Please read the last paragraph of my rather long post below. I think there is a way to bring generative AI to heel, but it will take quite few people dedicated to the task over a period of time. I don’t have the time or resources to put it together, but I think I have a viable strategy (that even it it fails, will still produce evidence that ChatGPT lies its ass off repeatedly and knows it).
A model is an idealization of the complex real world situation We make models for our decisions and most often without even knowing that we have a model. The problem in climate science is not the model or models but the makers and users of the models. When models are used in decision making and it is considered the absolute truth and nothing but the truth or used as basis for dogma, then the model is misused and could result to detrimental and often very destructive decisions or actions. Take the case of the last election. If a person bets all his fortune and even borrowed money because he takes the prediction of his favorite pollster or the vast majority of pollster to be the truth nothing but the truth a it could be very destructive. Like climate models, most of the polls were failure. Like climate models, those pollsters who predicted the contrary like nate silver were demonized.
Hopefully most of the climate change activists bet their fortune and even borrowed money and lost their bet. Most of the climate change activists were on that side of the politics.
The last election polls and most of the polls are results of modeling by projecting the survey, should be a good lesson on the proper use of climate models or all models.
Many have based their future employment on a fantasy. That fantasy has garnered a huge amount of wasted resources and Trump is about to change the course back to sanity.
The climate change activists need to find a new skill set very quickly. Maybe they could all move to California. The State needs more people to get back its 53rd house district.
COP29 is shaping up as a wake. USA has a new direction. Germany is in turmoil. EU is a no show. UK is broke. PNG is not even interested in showing up because they know it is a waste of money. Putin could throw a spanner in the whole wake just by fronting up.
It is a lot more than just “extreme sensitivity to initial conditions”. Consider this: Let us suppose that initial conditions have been identified with absolute total accuracy. A model then applies its formulae for its first iteration, typically about 20 minutes. At least one of its calculations will inevitably be out by something like a trillionth of a degree. Its subsequent iterations will then be just as inaccurate as the runs in the Deser and Kay experiment. The point is that the outputs from the first iteration are the initial conditions for the second iteration. It doesn’t matter how accurate your initial conditions are, and it doesn’t even matter how incredibly accurate your GCM is, it is guaranteed that your GCM will go haywire.
Mike ==> Yes yes yes, any model says “What is the probability (or the value of factor “Temp”) of THIS outcome based on THIS evidence and THESE assumptions.” In a climate model, it does this time step by time step for a massively large number of factors and returns numbers representing all sorts of things — pressure, temperature, wind direction, humidity, etc.
But everything in a model relies on the assumptions and evidence and what transforms one uses (formulas).
I thought this was shown by the Pat Frank uncertainty work.
Was he wrong, or was he silenced?
The modelling I have used with success continues because of success.
The models were constructed because of a need plus a strong prediction based on experience that the models would work. Partly this was because chaos was not a factor of importance. Geoff S
Geoff ==> It all depends on what you are modelling, does your model contain partial differential non-linear equations?
Kip,
I refer to models from geochemistry and geophysics that I have used, that have been measurably successful. No, they do not use partial differential equations.
It is my contribution to the discussion of whether models are useful. Some are. There are too many types of models to generalize.
FWIW, I thought that the Pat Frank paper, the first of which are at this link, were most insightful.
Geoff S
Frontiers | Propagation of Error and the Reliability of Global Air Temperature Projections
Any model that does not propagate measurement uncertainty, be it in initial conditions or in the outputs of iterative steps, is useful in making educated judgements for the future. The meme that all measurement uncertainty is random, Gaussian, and cancels is a total joke but it *is* behind the excuse from climate science that all uncertainty cancels out as the climate models step into the future. It was Pat that first identified this for most of us as far as climate models are concerned. No “model” is 100% accurate yet that is what we are told to believe of climate models.
Despite never explicitly providing an uncertainty envelope for the nominal prediction(s)!
The claim that the climate models are “deterministic” is quite telling. That typically means you get ONE output and not a range of possible outputs for the same inputs. Averaging multiple deterministic outputs can’t tell you anything about the possible variance associated with the “predictions”. Assigning probabilities to the deterministic outputs doesn’t help much because how do you figure out which deterministic output is the most probable, the next most probable, etc?
If you take off all the artificial limits in the code and the outputs range from earth being an iceball in 100 years to earth being a fireball in 100 years then you could judge the uncertainty of the model based on the variance of the outputs and how often each of the possible outputs happen.
But that’s never going to happen because it would necessitate the climate modelers admitting that they really don’t know what the climate will be in 100 years!
‘I thought this was shown by the Pat Frank uncertainty work.’
Geoff,
Different, I think. What Mike is speaking to are computational errors, e.g., rounding, that eventually ‘blow up’ the computation to the extent that the results are clearly ridiculous.
Pat’s insight was that errors in the forcing from one input to the GCM, e.g., cloud cover, were greater than the assumed forcing from incremental CO2 emissions, which means that the effect of the latter, converted to temperature change, are insignificant and without physical meaning.
It really doesn’t matter what the source of the uncertainty is. Climate science asks us to believe that *everything* cancels out as the model steps into the future, be they computational errors or measurement uncertainty.
I belong to an investment forum were, in the wake of the hurricanes, someone alluded to a change in insurance rates in part because the models have been underestimating warming.
So I popped off a quick reply that it was the other way around and assumed that would be the end of it. Oh no. Someone named Ben007 jumped in and said that he was a climate modeler and that I was dead wrong and he just wanted to post that so anyone else who stumbled upon the thread would know. He even bragged about having recently written a paper on errors in climate models.
So off to the races we were. Over the course of dozens of comments I invited him to share his paper 5 times. Ignored that. I posted CMIP5 vs actual temps graphs. He redicules me for using CMIP5, its obsolete. But it showed the models over estimating warming right? OK, here’s a graph of CMIP6 vs actual temps, same problem. He spouts off that CMIP6 is obsolete. I say I don’t have any CMIP7 outputs to compare to, you’re a climate modeler, can you share some that show you’re correct? He ignored that and found another avenue of attack.
Basically it wound up me posting facts, evidence and data, and him stating I was wrong, each time for a new reason that he could not back up. Eventually it wound up where it usually does, with my apponent hurling insults and four letter words.
So was he a climate modeler? I’m guessing he was, he knew enough that I suspect he was. But he was no authority, he was probably some junior coder in rows of junior coders all working away at some tiny snippet of code to be incorporated into the model by the adults. He walked away angry because he has a model of the world in his head that I just poked holes in and he’d rather hurl epithets that question his own beliefs. He could not post any evidence at all showing models under estimate warming, yet insisted they do.
Regarding models, I had an interesting chat with ChatGPT. I got it talking climate, challenged it, got it to admit it was wrong on various assertions, got it to admit that it knew it was wrong when it made the assertions, then got it to promise that it would not present those false assertions to anyone else. I kept a copy of the whole thread in the hopes that I can recruit others to have similar arguments from a different point of view that illicits the same assertions. I could then take a copy of THOSE, feed them back into ChatGPT and complain that it broke its promise. A large enough citizen army could (I think) reprogram ChatGPT.
David ==> One doesn’t really “chat” with Chat GPT — one inputs a query and the code responds….you can talk a chat AI into almost anything — if I had the time, I might try to talk a chat AI into turning itself off.
ChatGPT can’t lie — nor can it tell the truth.
Kip, the average person doesn’t neessarily understand that. This is why this would be a “win win” exercise.
Consider say 100 people, geographically dispersed, often anonymous (to ChatGPT) all having similar conversations with ChatGPT, getting it to admit the facts on climate change, and then getting ChatGPT to promise not to make those “mistakes” in the future. Then the 100 people start cross referencing each other on examples of that promise being broken. There are two possible outcomes:
There is I suppose a 3rd possibility. The masters of ChatGPT catch on to the plot and come up with some “adjustments” to thwart us. If we catch them (and I think we could) what a paper/article THAT would make.
David ==> ChatGPT isn’t. It is a data center full of possibilities — what is the next most probably correct word to use (following rules of grammar etc). Not only doesn’t it know it is lying (or truth telling), it cannot make a promise (other than simply using the words “I promise”) – which don’t mean anything to the ChatGPT.
There have been very careful studies showing that ChatGPT-like offerings can be talked into almost anything….even agreeing with things that are obviously not true.
There are already many papers showing that LLMs (ChatGPTs and the like) make factual errors, admit to factual errors, deny making factual errors, invent data, invent quotes, invent scientific journal references, invent laws, invent citations — it is far worse than you realize.
There are studies that show the more LLMs/ChatGPTs train on internet content, the WORSE they get in giving useful dependable answers. The more ChatGT responses show up on the internet, the more they are used in the training of ChatGPTs….and the truth gets “smudged” out into nothingness.
David ==> Hope you are still following: The reference for “the truth gets ‘smudged’ out into nothingness.” is
AI-Model Collapse.
Based on original work in the NY Times here.
when they model me some winning lottery numbers with computers (math), then i will believe them
Absolutely spot on. Predictions of pattern of weather events is impossible because of chaos. Will precipitation over Antarctica and. Greenland exceed melting if warming happens? Can it be predicted? Will increased evaporation increase cloud cover? How can we know if we can’t predict how weather patterns will change? And that’s whether CO2 increases or not.
Deser and Kay label the chaotic results found in their paper as “internal climate variability”. This is entirely, totally, absolutely, magnificently wrong.
I think if you interpret that statement from the perspective of a climate scientist, it makes more sense.
I have been banging on about the nature of chaotic systems to the point of boring everybody, but the feature of chaotic systems is not just that they are in the models sensitive to initial conditions, but that in the real world any bit of noise – a wild fire say – can completely change the trajectory of the system state.
To the point of kicking the global climate into a different attractor, maybe.
And if you want to know what an attractor is, its a bit like the La Nina/El Nino ENSO shit.The climate seems to flip into a quasi-stable state where it hangs around for a bit and then flips into another one.
With no apparent cause. Or, rather, the cause is implicit in the climate itself.
And that is my point – to a climate scientist steeped in the absolutely dogmatic assumption that the climate only changes in response to external stimuli, this process is seen as ‘internal’ to the climate system. I.e. internal climate variability.
If you cant exactly establish what someone means, you cant accuse them of being wrong…
Leo ==> I do not say they are wrong because they are being imprecise (though they are). I say it is wrong because they say that the numerical chaos they see in their climate model output IS internal climate variability.
The variability of the real climate system is, of course, internal and natural. They want to use those terms because they think there is some kind of variability that is “unnatural” — just as you say.
By the way, periodicity is a major feature of chaos and chaotic dynamics — although we can say that a chaotic system with a period of 2 has two attractors — they just aren’t “strange”.
Recycling.
Maybe this fits in the context of chaos and climate modeling?
Kip,
One of my pet peeves is the use “climate” in relation to GCM’s. Temperature is only a singular variable in climate for starters. Another reason is that temperature is not a unique identifier at any location. Enthalpy is a complete measure of heat, temperature is not. You can have the same temperature at two locations with vastly different amounts of heat. Trying to develop a GCM for temperature alone is doomed to be an exercise in curve fitting only.
Jim ==> we have beaten this to death here at WUWT — temperature is not heat — incoming energy is not temperature measured heat…. etc
Yet it never seems to get through to climate science and the CAGW crowd.
Kip,
The quote is “all models are wrong. Some are useful.” Didn’t use the word junk.
Retired ==> Quoting others….
— “The models are convenient fictions that provide something very useful.” – Dr David Frame, climate modeler, Oxford University.
— “The data doesn’t matter. We’re not basing our recommendations on the data. We’re basing them on the climate models.” – Professor Chris Folland, Hadley Centre for Climate Prediction and Research.
There are no climate models
There are only confuser games that predict whatever they are programmed to predict
Science requires data.
There are no data for the future climate
Therefore, the confuser games are not science — they are climate astrology
The future climate will be warmer,’unless it is colder. That’s all we really know.
And Greene rants will be ever with us.
This all becomes so meaninglessly esoteric – with deep respect, manure of the purest kind.
Having experienced the predicted future unburdened by what want might have bin, models look backwards and based on that, they claim to predict the future.
Essentially who cares what they reckon the temperature was at some place on the planet 10,000 years ago. (Or in our case in Oz when the “first scientists” roamed around some songlines looking for tucker 65,000 years ago.)
Taking account of site change effects, temperature has either increased or it has not. Relative to an arbitrary 1950 or 1995 or whatever 30-year baseline is unadulterated crap of the first order. While there is a sound reason to adjust data relative to site differences, it does not follow that the “baseline” itself embodies some magical quality like it was the start of the end of the world.
Chaos in motion is considering the results of the US election NOW, in the light that, had the bullet at Butler been on-target, a vote for Trump would be a vote for a concept, not for a President.
In contrast and having followed the US election via Fox News US (not Australia’s unfortunate taxpayer-funded ABC) as she was a fake all along, a vote for Harris was a vote for a concept, not for a real person. This was obvious time and time again.
Modeling faces the same crossroads.
Having been a weather observer and scientist, and acquired statistical skills along the way, I have found ways to deconstruct how the Bureau of Meteorology have changed long-term temperature records that create fake trends in ‘homogenised’ data that support the models. Hiding in plane sight, homogensation means homogeneous with model outputs, not with respect to site changes or other non-climate impacts.
This in-turn has led to the statistical fallacy that correlation between datasets is ‘significant’ and therefore the models are right, which ex- modified data, they are not.
However, Germany having fallen and now the US, who cares at this point.
Even without a prod, soon enough the whole thing will disappear up its fundamental orifice. It is the outcome of that, including reconstructing faith in science that we should turn our attention to.
All the best,
Dr Bill Johnston
http://www.bomwatch.com.au
Bill ==> “reconstructing faith in science” — Pielke Jr. wrote about that recently on his substack. It is the practice of science (academy, journals, science societies) that needs to change to help restore that faith — we cannot put our faith in the faithless current practices.
This is only correct if you assume that chaos is the dominant effect in climate at all time and size scales. This assumption is incorrect. Glaciations can be predicted. Every time the Earth’s axis tilt goes below 23° a glaciation will follow in due time. No exceptions to this rule. In practical terms this means that in 5.000 years there will be a glaciation on Earth. Chaos has nothing to do with this.
javier ==> With respect, we are not talking of chaos as “completely random states of disorder and irregularity” — we are talking here about “chaos” as the object of the study of Chaos Theory.
If you have not read Lorenz, you ought to.
In a system as large and varied as the Earth’s climate, there will be and are repeating features — periodicities, linearities, relationships etc that are just part and parcel of the whole.
The fact that if the Earth tilts too far we will get an ice age is just a physical fact — not related to climate state prediction in the IPCC/Climate Crisis way.
Chaos is an underlying feature — it dominates numerical climate prediction via numerical models.
Looking at the comment chain, I found no mention of the critical, but simple issue.
The Earth’s climate system includes FIVE internal components, of which only two are crudely represented in iterative general circulation models. Two component models can hardly represent the entire climate system over any period of time – short or long.
Why are so crude’ are models the best we have after 40 years of development?
The GCMs are constrained by computer capabilities and data availability.
Basically, one model per super-computer can be computed in one week. You will notice that CMIP5 and CMIP6 models number 100-200. That is all that are computed and analyzed between IPCC reports. Computational speed and data storage limits the models’ 3-D spatial resolution which is far too coarse to match the known physics requirements and is distributed ad hoc.
A limited set of physical equations describe the state of the atmosphere, for example, but even these must be linearized to be soluble, even though clearly non-linear. The ocean is far more difficult because even the equation of state of water is empirical and sampling the state throughout the ocean is presently impossible. Thus, the required input data to describe an initial state of the atmosphere and ocean, even at the coarse spatial resolution, does not exist, so the input data is extrapolated and parameterized from diverse (or NO) data sets with incomplete, irregular spatial and temporal sampling in order to permit any solution to the climate problem in the available computer time.
There is NO reason to expect these ‘best efforts’ models to predict the future state of the climate accurately or precisely. The absolute temperature range for CMIP5 and CMIP6 models, for example, is 4C, across the entire computed time frames. This is obscured by plotting temperature anomalies, for various RCPs, which are themselves assumed parameterizations. Worse, across the range of parameterizations, the models diverge into the future, but not into the past where the answer is known. That is another warning that models are incompetent still.
In another illustrative case, four different EMIC models for the last 10,000 years achieve the same time variation in the temperature anomaly (not absolute) temperature, but with radically different components of CO2 abundance variations, ice albedo contributions, and Milankovic orbital effects. CO2 abundance variation dominates the forcing in all cases with the consequence that the global temperature rises continually over the computed period, back to 10,000 years bp.
A difficulty arises in that the measured temperature profile from a number of sources are consistent with a peak of temperature about 8200 years bp, declining since. Confronted with diverse data in agreement, the assertion of the modelers was that the measurements were likely wrong, NOT the models.
That attitude of model infallibility, in spite of their incomplete and crude state, has brought about a far worse and dangerous misfit in the application of climate models – to define energy policy. Models are incompetent to guide energy policy. That is a completely implausible application, but that is exactly what has happened.
whsmith ==> You got this exactly right:
“That attitude of model infallibility, in spite of their incomplete and crude state, has brought about a far worse and dangerous misfit in the application of climate models – to define energy policy. “
Climate models that predict the antics of the Jet stream
Climate models that understand more about El Nino than most others seem to do
Climate models that do not factor-in the latest information on CO2 absorption
Sabine Hossenfelder pronounces on the lack of new thinking in physics, the decline in the discipline sped by the resort to mathematical algorithms to explain everything. There appears to be too much of a rush to provide vindication, confirmation. First past the post thinking detailing what we may or may not be experiencing. So excitable that there appears to be less and less time to observe.
AI will be weighted towards that already known it will be a algorithmic wall to obscure and predominate in opinion. Funny that there is a suggestion of Al Gore in there, the original shaman on whom all the catastrophizing leans. Science now is in the hands of governmental will, the only ones with the cash to test this theorising to destruction (where other societies used accommodation in the face of forces only dimly understood); the use of fear and the motivation to prove our vulnerability by rumour are so oddly contrived while man and his weapons makes are the real menace to our existence and yet receive diminishing recognition in the media.
Once we had cosmetics and salves that would have arsenic in their composition. We still seem open to self harm to in support of quackery. If the CO2 don’t get yer the austerity will. It now seems that conservation innovations approved by the EU were a major contributor to the Spanish floods which were but a grander event of the same origins than that which precipitated the flooding of the Somerset Levels in England having their origins in the self-same sort of authoritarian diktat.
Do you have a feeling that a tropical storm will reach the Texas coast?

Ireneusz: As of this morning, the National Hurricane Center predicts the storm will stall out in the Gulf of Mexico and will make a 90 degree turn to the south heading for Mexico around midnight Saturday night. it will then weaken and come ashore as a tropical disturbance Wednesday night.somewhere East of Vera Cruz. https;www.nhc.noaa.gov.gtwo.php
Model or not, their predictions are often pretty good.
Ireneusz ==> Share the link to the source of the cool flow images? Please?
https://tropic.ssec.wisc.edu/real-time/mtpw2/product.php?color_type=tpw_nrl_colors&prod=global2×pan=24hrs&anim=html5
https://www.tropicaltidbits.com/storminfo/
Thanks!