Essay by Eric Worrall
“… But it is not clear how much of this remarkable regional increase in severe rains is due to climate change, or how widespread it is …”
Landmark new research shows how global warming is messing with our rainfall
Published: July 26, 2024 6.20am AEST
Steven Sherwood Professor of Atmospheric Sciences, Climate Change Research Centre, UNSW Sydney
Anna Ukkola ARC DECRA Fellow, UNSW SydneyThe past century of human-induced warming has increased rainfall variability over 75% of the Earth’s land area – particularly over Australia, Europe and eastern North America, new research shows.
The findings, by Chinese researchers and the UK Met Office, were published overnight in the journal Science. They provide the first systematic observational evidence that climate change is making global rainfall patterns more volatile.
Climate models had predicted this variability would worsen under climate change. But these new findings show rainfall variability has already worsened over the past 100 years – especially in Australia.
…
Analysis of daily extreme rainfall totals across Australia in present and future simulations revealed future increases were likely to exceed expectations from many past studies. Rainfall is likely to increase more sharply in the most extreme events, and appears to do this nearly everywhere on the continent.
In 2022, we looked at rainfall hour-by-hour in Sydney using radar data. We found the maximum hourly rainfall increased by 40% in Sydney over the past two decades.
Our findings have major implications for Sydney’s preparedness for flash flooding. More intense downpours are likely to overwhelm stormwater systems designed for past conditions. But it is not clear how much of this remarkable regional increase in severe rains is due to climate change, or how widespread it is.
Increasing variability also means a greater risk of drought. Climate models suggest rainfall variability in many parts of Australia will keep increasing, unless greenhouse gas emissions are rapidly reduced.
A change in only a handful of heavy rainfall days can make or break a drought in Australia. This means even small changes in variability can bring more devastating droughts in the future as dry periods become drier.
…
Read more: https://theconversation.com/landmark-new-research-shows-how-global-warming-is-messing-with-our-rainfall-233432
The rainfall variability study;
Anthropogenic amplification of precipitation variability over the past century
WENXIA ZHANG, TIANJUN ZHOU, AND PEILI WU
SCIENCE
25 Jul 2024
Vol 385, Issue 6707pp. 427-432
Editor’s summary
As climate change continues, warming of the atmosphere allows it to hold more water and thus produce more precipitation. A corollary to more rain is the amplification of precipitation variability, a behavior easier to predict than to observe. Zhang et al. used global records of daily precipitation to show that this expected increase in precipitation variability is in fact detectable in the data over the past century. This trend, which is most prominent over Europe, Australia, and eastern North America, will make adaptation more difficult for societies and ecosystems. —Jesse Smith
Abstract
As the climate warms, the consequent moistening of the atmosphere increases extreme precipitation. Precipitation variability should also increase, producing larger wet-dry swings, but that is yet to be confirmed observationally. Here we show that precipitation variability has already grown globally (over 75% of land area) over the past century, as a result of accumulated anthropogenic warming. The increased variability is seen across daily to intraseasonal timescales, with daily variability increased by 1.2% per 10 years globally, and is particularly prominent over Europe, Australia, and eastern North America. Increased precipitation variability is driven mainly by thermodynamics linked to atmospheric moistening, modulated at decadal timescales by circulation changes. Amplified precipitation variability poses new challenges for weather and climate predictions, as well as for resilience and adaptation by societies and ecosystems.
Read more: https://www.science.org/doi/10.1126/science.adp0212
Another of the referenced studies;
Robust Future Changes in Meteorological Drought in CMIP6 Projections Despite Uncertainty in Precipitation
Anna M. Ukkola, Martin G. De Kauwe, Michael L. Roderick, Gab Abramowitz, Andrew J. Pitman
First published: 10 May 2020Abstract
Quantifying how climate change drives drought is a priority to inform policy and adaptation planning. We show that the latest Coupled Model Intercomparison Project (CMIP6) simulations project coherent regional patterns in meteorological drought for two emissions scenarios to 2100. We find robust projected changes in seasonal drought duration and frequency (robust over >45% of the global land area), despite a lack of agreement across models in projected changes in mean precipitation (24% of the land area). Future drought changes are larger and more consistent in CMIP6 compared to CMIP5. We find regionalized increases and decreases in drought duration and frequency that are driven by changes in both precipitation mean and variability. Conversely, drought intensity increases over most regions but is not simulated well historically by the climate models. The more robust projections of meteorological drought compared to mean precipitation in CMIP6 provides significant new opportunities for water resource planning.
Read more: https://agupubs.onlinelibrary.wiley.com/doi/10.1029/2020GL087820
The models don’t agree but they think some of their model predictions are reliable.
This seems a very short timeframe to call global warming as the culprit. Not only are there other confounding factors, such as massive land use changes, including vastly expanded irrigation and emission of dust and exhaust particulates, and some major volcanic eruptions such as Hunga Tonga, there is plenty of evidence of huge century scale shifts in rainfall which occurred well before anthropogenic warming became a potential issue.
Perhaps when climate scientists stop making so many wrong predictions we can pay more attention to what their uncomfortably divergent models predict.
Meanwhile local city administrations should be spending more money on drains anyway, even without this prediction of worsening floods. That day in 2023 while I was driving through the Sydney floods I saw a sight I’ll never forget – a council worker in flood water up to his waistline bashing at a large blocked drain under his feet with a huge pry bar, to try to save an entire street of houses from the flood. I don’t see how that kind of risky emergency action would ever be necessary if the city had done a proper job of maintaining the drains BEFORE the floods hit. I sure hope he wasn’t injured that day.
I know from the first line it is BS. There is no human induced global warming. Human induced \warming only occurs in climate models and they are fantasy stories dressed up as science.
The significant drivers of current warming are the solar output reaching its modern optimum after the minimum of the late 1600s and the gradual shift of peak solar intensity onto more land and less ocean due to the precession cycle.
Anyone who thinks that CO2 is the cause of warming should have a go at explaining why CO2 has reduced cloud at all latitudes apart from a small region of Antarctica and a few degrees just north of the Equator.
And of course, I don’t know how many times I have asked people to produce empirical scientific evidence of warming by atmospheric CO2 …
… and NEVER get a rational scientific response.
It is either too small to measure… or doesn’t exist at all.
It is the former. Anything that contributes to atmospheric mass will alter the ocean surface regulating limit that controls the solar energy thermalised.
During the Cretaceous period, the atmospheric oxygen level reached as high as 30%. That increase results in an ocean temperature sustainable limit around 33C compared with 30C under present atmosphere.
For whatever reason, carbon is being added to the atmosphere and that will be increasing the temperature by some unmeasurable amount.
Probably the warming oceans are either absorbing less or releasing more CO2, or both, due of their rising temperature because of the higher solar output over the past 100 years.
The only relevant answer is the minute change in atmospheric specific heat Cp with the addition or deletion of CO2. But, the temperature changes, however minute, do not change the energy in the atmosphere.
“Thermal energy refers to the energy contained within a system that is responsible for its temperature. Heat is the flow of thermal energy. A whole branch of physics, thermodynamics, deals with how heat is transferred between different systems and how work is done in the process (see the 1ˢᵗ law of thermodynamics).”
Correct.
Thermodynamics also involves conservation of energy.
Thermal equilibrium is mathematically akin to Kirchhoff’s Law of Electricity.
Kirchhoff also had many other expressions with quite a few related to thermodynamics.
All of Kirchhoff’s Laws, as far as I have gone, relate to energy.
Human-induced or not, the world temp has increased from about 14.8 C in 1900 to about 16.0 in 2023.
That means the atmosphere holds, on a year-round average bases, about 1.2 x 7% = 8.4% more water
There has to be 8.4% more rainfall ON A WORLDWIDE AVERAGE BASIS.
Some areas get more rain than others
That means greater rain runoff systems are required to prevent increased flooding
The Netherlands has built such a flood prevention system. It has secured its prosperity
Other countries need to follow that example, instead of unwisely spending more money on armaments, and coddling illegal, culturally different walk-ins
Local rainfall varies about +100%/-50% of its “average”, so 8.4% more rain is actually fairly difficult to verify from looking at a graph of local rainfall. Add to that tropical parts of the planet have not experienced “global warming”, and the temperate and cold parts of a planet have much less rainfall to start with….and it all adds up to a lesson in “what you can’t do with statistics” for university courses….
The atmospheric water has increased significantly since satellite records were able to measure atmospheric water globally but water runoff has not varied much from 43Gt over the past 20 years. There is a slight downward trend over the first 20 years of this century with 45.7Gt in 2000 and down to 41.9Gt in 2019 but it over a rage of of 5GT.
The water cycle over land can accelerate and produce more rain but that is simply countered by more evaporation from the land. Runoff is a function of ocean air advection to land and that has slowed down in the NH in summer months but a slight increase in winter months.
Solar Irradiance has been at its highest level over the last 100 years of any time over the last 400 years. That will heat the oceans, that can hold heat for 100 years or more, and warm the planet.
https://lasp.colorado.edu/lisird/data/historical_tsi
I’m pretty sure I don’t buy that. Two counter arguments.
First, most data I’ve seen quoted argues for the total solar radiative flux density have been within a very narrow band over far longer than the 1600s… maybe that’s incorrect by my take-away from all of those pieces is that the energy emissions in the electromagnetic bands has been fairly stable, so, I don’t see how your assertion can be true.
Second, what does seemed to have changed over the years since 1600 is the magnetic flux density and, with it, the size of the heliosphere around the Sun and, with it, its strength around the earth’s orbit with the size and strength of the Sun’s heliosphere being, functionally mediated by a few other atmospheric factors like cloud formation, inversely related to the heating or cooling of the earth.
The quieter the Sun is, sunspot-wise, the smaller or weaker the heliosphere will be at, roughly, the earth’s orbit, the cooler the earth will be because global cloud cover will be at its maximum. One estimate I’ve seen is that the increased cloud cover can block, roughly .5 watts/sq. meter, an amount that seems to be sufficient to explain the atmospheric cooling.
The more active the Sun is, sunspot-wise, the bigger and/or stronger the heliosphere will be at, roughly, the earth’s orbit, and the warmer the earth will be because global cloud cover will be at its minimum, allowing (using the .5 watts/sq meter value) the addition of that much extra solar energy to the earth’s energy balance.
Total solar radiative flux density, while a tempting place to start to explain the earth’s cooling or warming, doesn’t seem to do it because, the data show, over time, a fairly steady total solar radiative flux density without enough variability to account for the extremes in temperatures we’ve seen over the last 500 years or more.
In the mid to late 1600s the reconstructed TSI based on solar spots was 1360.1W/m2. Last year TSI averaged 1362.1W/m^2.
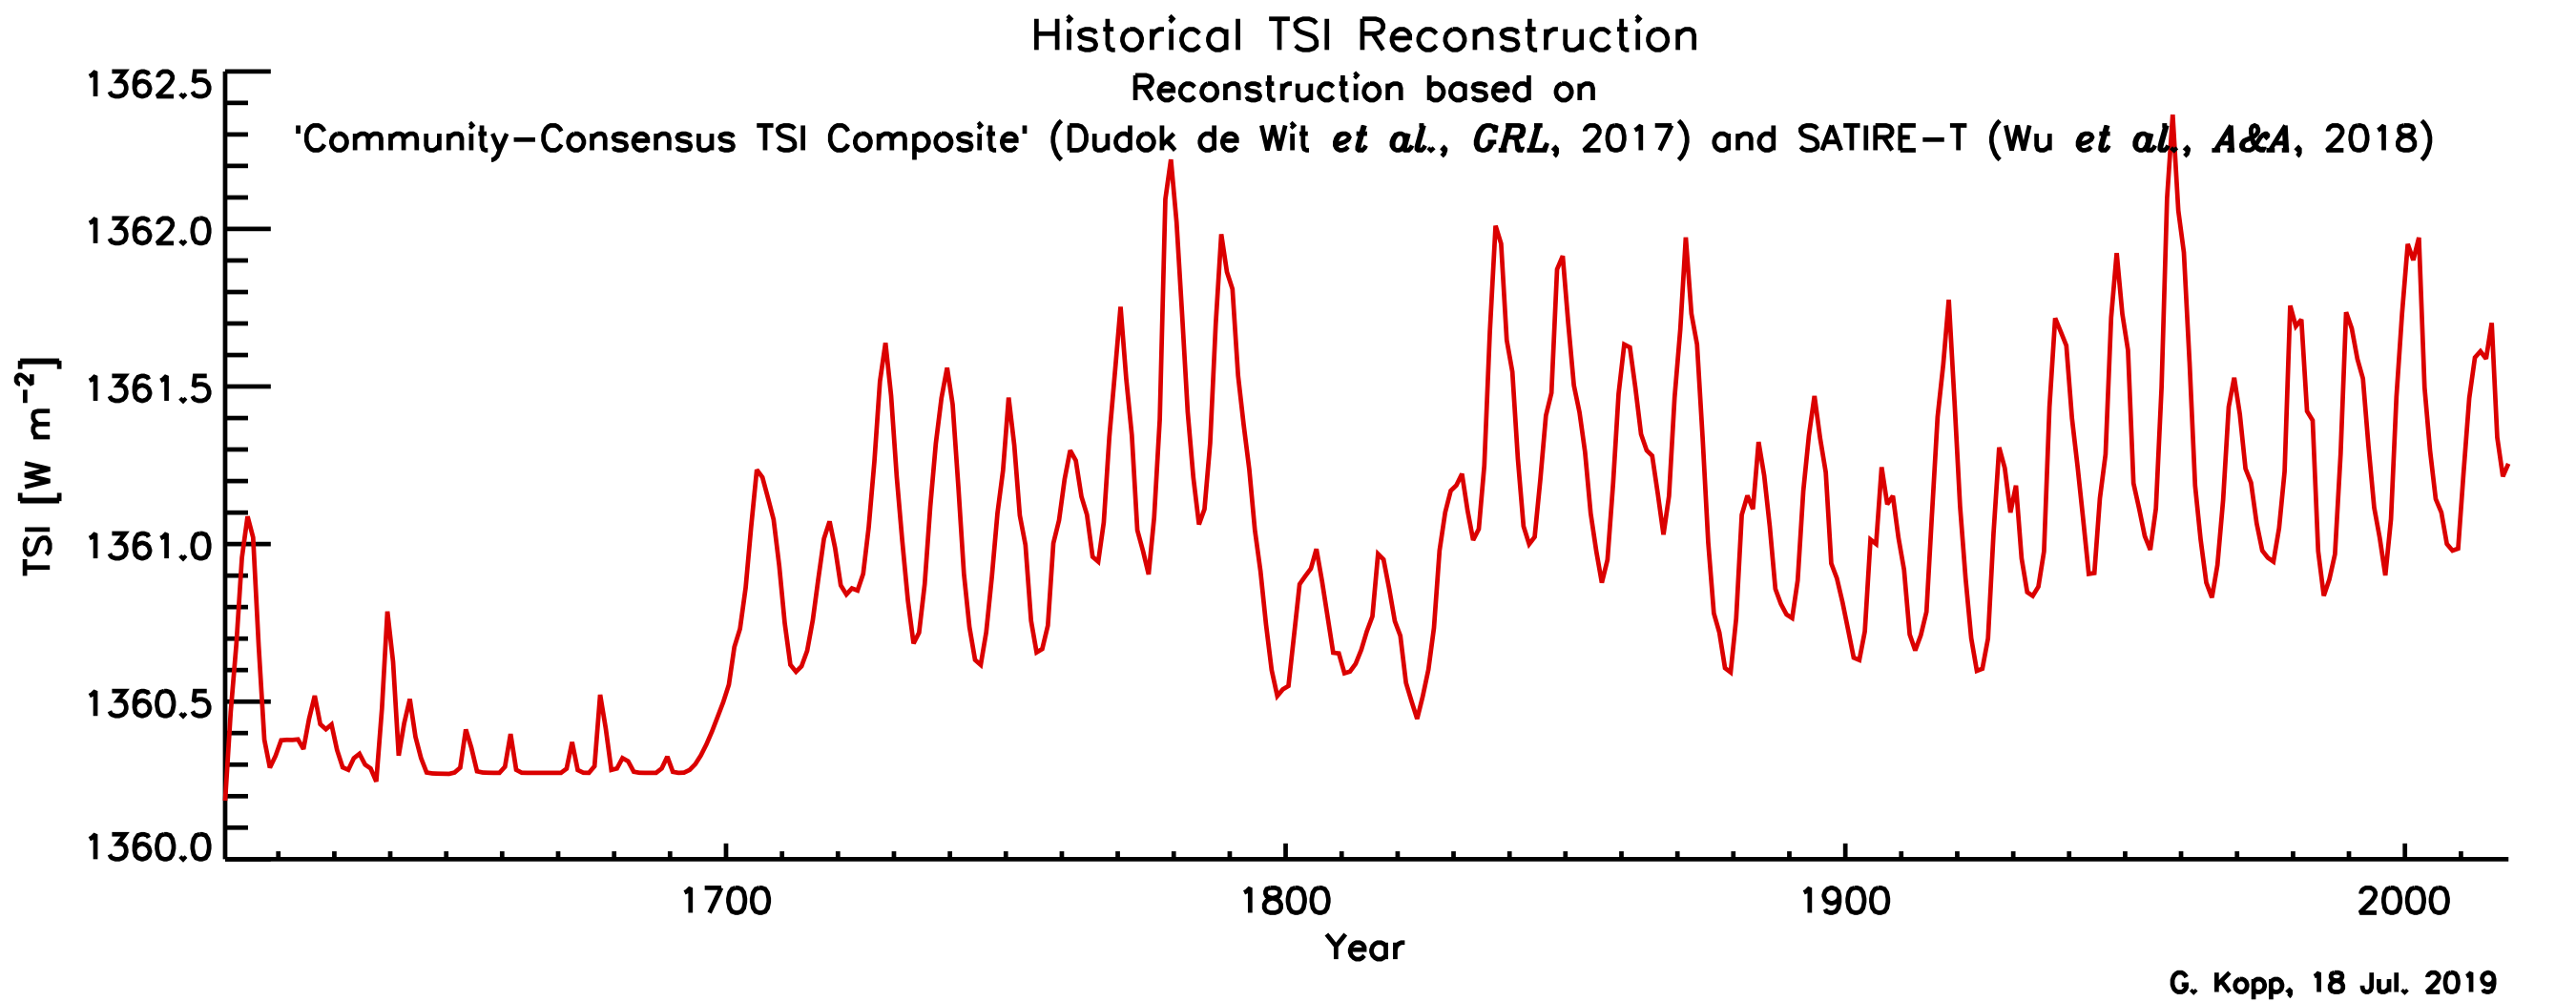
The chart shows the gradual increase in TSI from the LIA. Taking a starting point of 1360.7W/m^2 in 1850 when sea surface temperature records begin. The accumulated TSI tracks the SST with a regression coefficient of 82%. The accumulated energy above 1360.7W/m^2 is now 125ZJ but it bottomed in the 1920s at minus 25ZJ when the temperature was 0.4C below the 1850 level.
Why is that kosher? Sun spots aren’t energy flux but you’re claiming you can reconstruct TSI from sun spots and and I have to accept it? That seems like a leap of faith to me and not one that I’ve seen any justification for in the scientific literature.
But, I have seen scientific justification tying solar sun spot and SME activity levels over the centuries into the the size of the heliosphere and, by the mechanism noted above, the temperature and agricultural productivity levels of the centuries.
I’m willing to consider other theories but they need to include more than an assertion that something is true and it has to be a least a good faith effort at scientific inquiry and not just some wild theory that doesn’t stand up to even the most casual of investigations
They are not my reconstruction. There are a number of reconstructions that have good agreement. The chart I linked to came from here:
https://lasp.colorado.edu/sorce/data/tsi-data/
There are actual satellite measurements of TSI now that are used to build these reconstructions.
The main point with sunspots is that they are the longest available, consistently collected climate record dating back to the 1600s.
My work is focused on why things happen so I am looking at what drives TSI. I am yet to formally publish this work but the attached shows the torque acting on the sun about its centre of turning, which is not the barycentre of the solar system. There is a dominant cycle with period 1680 years where the sun exchanges gravitational energy to and from the planets. We are presently very close to a solar driven climate optimum similar to what occurred during the peak of the Roman Empire. The torque was veery low during the 1600s and corresponds with the quiet sun. The peak of the torque transfer from sun back to the planets occurred during the medieval warm period.
The data to create this chart is not something I produced. It is based on the ephemerides for the sun available from the JPL Horizons applet. I have just taken a close look at what is happening on the sun.
First, quoting someone else’s work, someone with ‘authority’, is, I thought, a discredited approach, replacing discussions around the science with discussions about who has the most people lined up behind them.
But, that said, is this agreement between other ‘reconstructions’ anything like climate models having good agreement? Which is a short stroll from there to settled science?
It’s time to end this exchange.
Nothing like it and you are being ignorant to even ask the question. It is simple correlation of two sets of observation. None of it modelled.
The satellite measured TSI for the SORCE Project and sunspot observations are readily available. If you are skeptical of the correlation then do your own.
The fact that I can link the TSI and sunspots directly to solar gravitational forces indicates that sunspots and TSI are linked with gravitational forces on the sun being the driver.
You’re using the word ‘linked’ and avoiding using the word ‘correlation’ and you’ve thrown in a new mechanism for transference of addition energy through solar radiative flux through gravitational forces, gravitational forces that must be new, varying levels, because we’re already accounting for the energy from gravity… this is a grand avoidance strategy.
Correlation is not causation… and unless you can show, not propose some linkage without being able to demonstrate how it works, but show… causation, using some kind of mathematical relationship in physics, chemistry, or whatever other scientific mechanism, then without showing how TSI is related to sun spot activity, it’s just another random statement that gets us no closer to understanding how sun spots affect or could effect TSI.
It’d be like discussing the price of tea in China when you’re what you’re trying to decide is what’s needed at the neighbor’s barn raising next weekend.
I guess this makes sense to you but, sorry, not to me.
The same Stephen Sherwood who promoted his bogus I found the Hot Spot paper that was addressed by Jo Nova back in 2015,
Sherwood’s devout unscientific faith in “climate change” and the hot spot
LINK
He is the one many warmist/alarmists who refers to his crap paper as proof the Hot Spot exists which I counter that the NOAA have NEVER accepted his contrived phony kridiged data set which they always ignore.
He is a classic example of a Pseudoscientist.
Google gave me nothing for “kridiged”. From context I guess it means either altered or invented.
I agree with those above, there been no change in rainfall. I have been recording rainfall in my area of SE Qld (Australia). I have also downloading rainfall from official stations in my area so I have a 131 year record of monthly rainfall (average rain of all years is 1800m). The record starts with very heavy rainfall in 1893. In February 1893 an observatory not far away measured an Australian record rainfall over 3 days (1.790m) and over 4 days (2.063m) and for the month of Feb (3.0m). The station in my measurement was a little lower. In Brisbane in 1893 there were record floods. In my area the wettest year was 1898 with 4.0m rain when there were also floods. The rainy period in the 1890’s was followed by the record dry period of the Federation drought (1900-1911) with 1902 having the least rain in my area. I lived in Sydney. I recall that at the Richmond race course there was a toilet that had marked the flood levels going back to the 1920’s. I suggest the authors of the paper from the UNSW have not looked that actual records going back to the 1890’s or reported information in newspapers of floods going back to the 1830’s.
An interesting tidbit is printed in the last segment of their article: “Despite the dramatic increase in the intensity of rapid rain bursts, we found little if any change in daily or even hourly rainfall over the same region“.
I read this to say that “Some of the actual data doesn’t support our conclusions”. This makes me conclude that their method of processing recordings of past data should be treated with skepticism. Where I live along the Guadelupe River in Texas (which some call the most flood prone river there), the floods aren’t caused by an outburst within a storm. Rather, they’re caused by high rates of rainfall over a day, or two, or even a week.
“The models don’t agree but they think some of their model predictions are reliable.”
And they will choose which “predictions” were reliable… once they actually happen. !
Simply because some rainfall is ‘truly local’ and some ‘truly isn’t’ it is very tricky to design any kind of model (especially using a logic computer) that can represent what is really going on at any meaningful scale. Like everything else resolution will reduce even the best computer attempts to deal with it to a shambles. Together with the problem of the length of time it takes to actually run a very elementary computation about weather at truly meaningful resolution scales also means you will experience the weather you are attempting to predict long before the computer finishes its forecast cycle (unless of course you cheat).. .
With Australian rainfall, its always a matter of which year you choose to start, and when to finish
Australian rainfall deciles since 1900 (bom.gov.au)
They claim variability has increased in Sydney, but they only looked at 20 years????? If you use the full record, variability (SD) for Sydney has been effectively flat.
Haven’t got Sydney data, but I once did some work on Newcastle rainfall..
(for non Australians.. Newcastle is about 150km north of Sydney)
… just found this graph of “maximum daily rainfall” for Newcastle
Finishes around 2010, but basically nothing untoward happening.
Looking at your graph, they are considering the period after that large bulge in the 1980s,90s.
Talk about cherry-picking !!
, time span, and how many samples you use. Time span should be compared against how old “rain” and “Australia” are.
Sounds a little like the end of the permanent drought hoax. At least until the next one.
It’s peppered with all the right nonsense like
“”accumulated anthropogenic warming””
Accumulated and unfounded anxiety
I’m not registering an opinion either way but this report talks about rainfall variability. Every time some claims are made about rainfall or drought changes, graphs showing trends are hauled out. There could indeed be no changes in totals, averages, or trends but still large changes in variability. Unless there is data evidencing no change in variability, no opinions about such a claim has any reason to be accepted.
nature is all about variability- and the variability itself is variable- and without variability- we couldn’t have evolution- we should appreciate instead of fearing it and panicky as Saint Greta demands
That opinion has nothing to do with whether or not the claim of the study, that variability in precipitation is increasing, is correct.
Quite aside from that kind of consideration, my understanding about evolution is that it has to do with long term change, not variability over days, weeks, months, decades, etc.. Something in the environment changes, long term, in such a way that some species can not survive the changes or some other species now have such an improved advantage that they can readily outcompete some other species (perhaps how BRICS may be developing to outcompete western monetary policy (generalized legal government theft from the citizens)). Thus the new conditions promote the rise of some species and the demise of others.
From the article: “The past century of human-induced warming has increased rainfall variability over 75% of the Earth’s land area – particularly over Australia, Europe and eastern North America, new research shows. ”
Rainfall is about the same around here, and I’ve been watching it longer than the period in this study. I didn’t need any hourly radar data to judge that.
So I guess I live in an area that doesn’t experience human-induced variability in rainfall.
Climate Alarmists see what they want to see. They should stick to real-world observations and throw their models in the trash. If they wanted the truth. But they don’t want the truth, they have a human-caused climate change agenda to promote.
“Climate Alarmists see what they want to see. “
Be your own fact checker, Tom
A Rough Guide to
Spotting Bad Science
https://compoundchem.com/wp-content/uploads/2014/04/A-Rough-Guide-to-Spotting-Bad-Science-20151.pdf
Book mark it!
That’s a handy look-up. The only thing I’d question is point 12.
I agree, it’s outmoded.
I’m sure we can find something else for point 12.
In todays era of climate syndication, peer reviews aren’t reviews. The rubber stamp papers with abstracts that match the narrative and do shark attacks on those that do not.
In “climate science”, journal peer-review basically means….
… “does it tell the correct story” !
Science and quality of work have absolutely nothing to do with it.
In other words, look out the window.
Well, the IPCC has stated that future climate behavior cannot be predicted because it is a –
coupled, non- linear, chaotic system.
So why are all these academics wasting taxpayer funded grant money on doing what their peak authority the IPCC has concluded can’t be done?
Keeps their paychecks rolling in, plus it not costs money to publish and academics is all about publish or perish, so even BS gets published…. for the cost.
So, unless the weather is average, every day, it’s human induced climate change. Makes sense. /s
seems that all these climate opinions are like bums-
everyone has got one.
I would also suggest it could be an artifact of more detailed Doppler radar systems, which can measure rainfall rates. Rather like detecting small tornadoes which cause no damage on the ground.
https://www.ipcc.ch/report/ar6/wg1/downloads/report/IPCC_AR6_WGI_Chapter12.pdf
IPPC states “low confidence” for any increase in floods, rainstorms, landslides, drought, “fire weather,” cyclones, hurricanes, tornadoes, sand and dust storms, hail, sea level rise, coastal flooding, and erosion”
Be careful not to over-use that true statement. The political heads of the organization could update words.
The sky is falling! The sky is falling!
Climate causes nothing. Climate, by definition, is the average of weather. Micro climate, 30 years in a localized area, has been hijacked and repurposed for global climate (30 years), yet the climate hysteria is based on an mid-1800s starting point.
Global warming causes nothing. Global warming is a normalized average trend derived from temperature variability in local areas mish-moshed into a so-called global average. While a trendline can be informative, it does not cause anything.
It’s all about weather and weather variability. All weather is caused by energy, not temperature, although differences in temperature can cause the flow of thermal energy from high-T to low-T. This thermal energy flow is the definition of heat.
As an aside:
thermalize:
verb, attain or cause to attain thermal equilibrium with the environment.
In physics, thermalisation (or thermalization) is the process of physical bodies reaching thermal equilibrium through mutual interaction. In general, the natural tendency of a system is towards a state of equipartition of energy and uniform temperature that maximizes the system’s entropy.
In other words, CO2 can not and does not thermalize IR.
It is now common media use for the word “climate” to mean “weather-the-last-three-years”. This is much easier for them to internet search the previous 3 years’s “weather” section of their local newspaper than to download and analyze 30 years of satellite weather data…
Not only that but most people were taught the word “climate” meant thousands to millions of years. Examples of the climates people were taught are the arctic, rain forests, deserts, temperate zones and tropical areas.
It is seldom if ever mention in the media that the word “climate” means only 30 years of weather and most times what they refer to as “climate” is only a few years, if that.
“a very short timeframe”
It is especially irksome to hear 10,000-year predictions based on 10-year data when one has tolerated one’s “faith tradition” ridiculed for not understanding how short a timeframe 4000 years is by the same speakers.
The photo shows the bubbling surcharge (discharge at opening) in the pipe system, due to ‘restriction’ rather than blocked pipe. HGL bump (big hydraulic losses) due to restriction because of undersized system.
On my hillside property, 2-3 times year, the storm system blows off manhole cover and floats it down the hill 15-30 feet. The City storm system includes an additional 25 acres that was scabbed onto the the original 10 acre basin system.
If your councilor was poking around in a bubbling system, he was just wasting his time. If he was poking around in a big (relatively) static pond, he may have been simply waste deep due further downstream restrictions (the clog may not have been at his feet and the higher downstream velocities pushed the HGL up 3 feet ).
You could be right, and I agree the drains should be improved, but other visits to Sydney let’s say cleaning drains never seemed a high priority.
The Tonga undersea eruption a couple of years ago is causing the weather havoc. Scientists warned back then that the weather would be affected for up to 7 years.
Oddly, this is never mentioned in scaremongering articles.
Actually, cities would do well in investing more in directing surface water to absorption sites, rather than obsessing about drains. Water tables remain healthy if water is absorbed where it falls, or close to where it falls. Water on roads/from roofs should be directed to sunken areas by the sides of roads, where greenery can gorw and thrive.
India has an annual extreme weather event – it’s called the monsoon. It has learned to manage its monsoon rainfall better not through building drains, but through digging pits to accumulate rainfall and allow it to be absorbed into the soil and subsoil. Four to five inches of rain can easily be absorbed by well-structure soil and ditches dug to hold 12-18 inches will allow far more to be absorbed over a period of days to a few weeks.
In regions which oscillate between drought and floods, the key to maintaining healthy water tables is learning how to retain the storm water where it falls, not obsessing about how to quickly return it all to the ocean, only to wail that soils are cracking up during the next drought…..
Dear Eric,
While any “climate scientist” can write this stuff (and pay to have published), it takes a certain kind of cretin to write a praise-piece on the one-way The Conversation.
It is time the UNSW put out their garbage.
Yours sincerely,
Dr Bill Johnston
http://www.bomwatch.com.au