
The Battle of the Climate Hypotheses: The Green-House Gas Forcer vs. The Winter Gatekeeper Round 2: Climate Shifts – Are They for Real?
Gabriel Oxenstierna
The climate system persistently tries to restore radiative imbalances through the meridional transport of heat via atmospheric and ocean circulation systems that control the poleward flux of latent and sensible heat, see the first article in this series, here.
The “Winter Gate-keeper hypothesis” [WGH] claims that the climate exhibits decades-long heat transport regimes separated by more or less abrupt shifts: “… climate regimes are distinct states of atmospheric circulation with different levels of poleward heat transport. Rather than changing gradually, these regimes can shift abruptly from one state to another.”[2, p. 337]
Climate regimes that are ended by climate shifts are a fundamental feature of the WGH, as they are an expression of the natural cycles that are essential to it.[2, ch. 32-33] These regimes manifest as trends in oceanic and atmospheric oscillations, in varying heat transport intensities, and in altering surface temperature trends.
Importantly, the WGH claims that changes in the flux resulting in climate shifts will be sufficient to change the radiative balance so that planet Earth either cools or warms as a result. The shifting transport regimes of heat and moisture are the fundamental explanation to climate change, says WGH.
The Green-house Gas forcer climate hypothesis doesn’t recognize the naturally occurring climate shifts on a global scale, as they don’t fit the hypothesis of a changing climate responding to gradually increasing GHG levels. Even if some climate shifts can be shown to exist, they are presumed not to be significant enough to change the global radiative balance. IPCC also doesn’t mention climate shifts or climate regimes as concepts per se.[3] Climate shifts are sorted under the category ‘internal variability’, whose effects are set to zero:

The only climate shift in the modern era that is somewhat accepted in the climate science occurred 1976. It has been studied extensively and is evident in many climate-related variables and had a lot of effects on e.g. marine ecology.[4][5][6] This is how the 1976 climate shift is described in the WGH literature:
“Recent global warming began in 1976 with a sudden climate shift in the Pacific Ocean that increased zonal atmospheric circulation and decreased poleward heat transport, affecting the global temperature trend. As a result, the multidecadal oceanic oscillations changed from a cold phase, which had led to the 1945-1975 cooling period, to a warm phase.
The abrupt climate shift of 1976 revealed the existence of multidecadal climate regimes separated by abrupt transitions. They result from changes in the global atmospheric circulation that establish distinct poleward heat transport regimes.”[2, p.342, my emph.]
The 1976 shift is thus the starting point for looking at presumptive climate shifts with opposite effects on the dominating wind patterns, the poleward heat transport and warming. One such shift happened around 1944/45 and a more recent one is claimed by the WGH to have happened around 1997.
What drives the climate shifts?
The basic concept of WGH is that polewards Meridional Transport (MT) of heat and moisture controls climate change. An increase in MT speeds up the energy transport to the polar regions, enhances radiation to space especially in the Arctic, and consequently acts as a negative feedback.
The first order driver of MT is the steep latitudinal temperature gradient (LTG; or “gradient” for short) between the tropics and the polar regions. “The LTG is a central property of Earth’s climatic system at all time scales. It drives the atmospheric-oceanic circulation and helps explain the propagation of orbital signatures through the climatic system, including the Monsoon, Arctic Oscillation, and ocean circulation.”[1, p.86][10]
The gradient arises from the differential radiative heating between tropical and polar latitudes and drives the poleward heat transport. It thereby acts as a thermodynamic engine of the planet’s climate: “MT is the climate control knob, and it responds primarily to the LTG”. [1, p.542] Now, this gradient displays a multi-decadal variation:
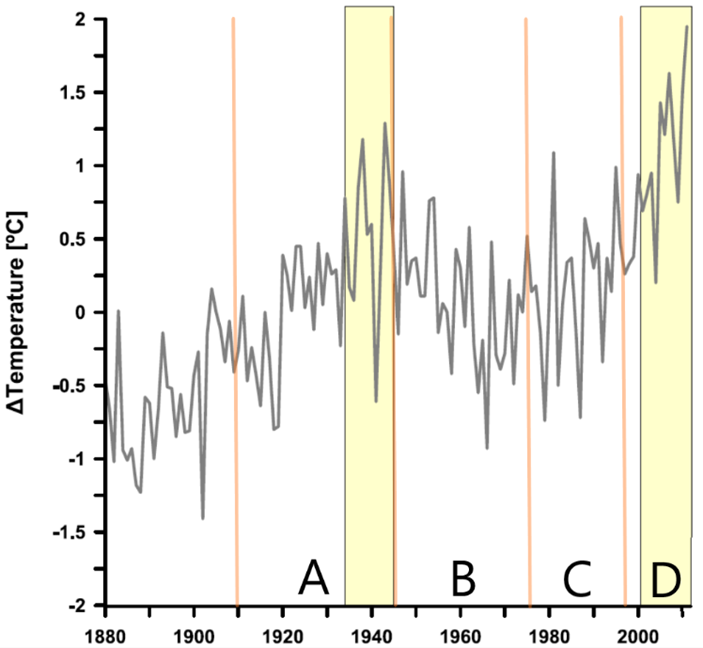
A higher temperature gradient enhances the polewards heat transport, and vice versa. During the climate shift around 1945 global temperatures peaked as the gradient reached its weakest value and heat transport slowed, (period ‘A’/yellow bar in figure 2). From there the gradient started to increase, heat transport picked up steam which helped the climate to cool down in the following decades, ‘B’:
In the 1960s and early 70s the gradient grew bigger, the poleward heat transport improved and global temperatures cooled somewhat. But again the climate shifted. In the decades after the climate shift 1976, the gradient has gotten ever smaller (‘C’ and ‘D’ in fig. 2). This has negatively influenced the heat transport since 1976 and contributed to a warming climate, especially in the high north.
Transporting heat and moisture
MT is a polewards transport of heat and moisture. Sensible heat is transported in all layers of the atmosphere up to ToA, whereas latent heat is transported as moisture (water vapor) in the lower atmosphere. Water vapor in the atmosphere acts as a means of storing heat that can be released later. (See the appendix for some further explanation.)
The total precipitable water (TPW) in the air column can be used as a proxy for the amount of moisture available for MT, and for the rate of atmospheric overturning. The climate regimes and shifts (A-D) line up nicely in the TPW developments:

The TPW increases long-term as a result of global warming and there is almost 10 percent more water in the atmosphere today than 120 years ago. Warmer air holds more water, which enhances the convection and advection processes in the water cycle. It is well established that the intensity of the tropical Hadley cells have increased, and they have also significantly expanded polewards since 1997. Also the Ferrel cells show similar increases. As a result of these shifts, we have a positive trend in the polewards export of net energy from the tropics since around 2000, driving the MT, see previous post (fig. 4).
Was there a climate shift 1997?
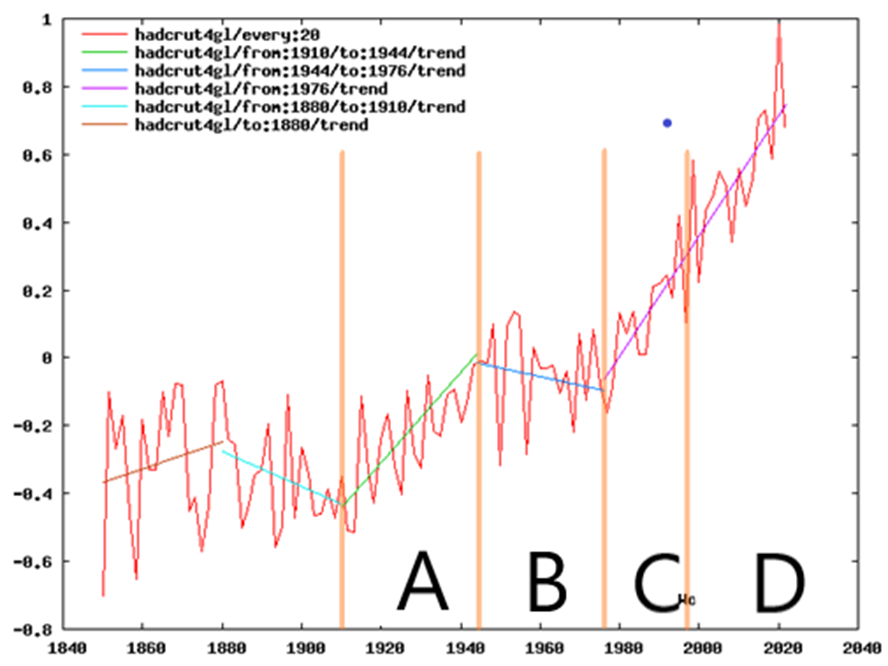
The variations in the gradient (fig. 2) as well as in TPW corroborate the claims of climate shifts in 1945 and 1976. But what about the climate shift 1997 that has been proposed by WGH? [1, ch. 11.4] We had a peak in global temperatures during the strong El Niño 1997/98, followed by a temperature hiatus up until 2015. Still, the longer-term global warming trend has remained intact since 1976 with no signs of a climatologically relevant climate shift in global temperature data (fig. 3). The gradient in figure 2 also shows no signs of a shift after 1997. There are also no signs of a climate shift 1997 in the Earth energy imbalance (EEI) or Ocean heat content (OHC) data. However, there are other signs of a shift in 1997, e.g. in the water cycle (fig. 4) and in various climate indexes in the Arctic.
There is an on-going change in the global heat transport system, and it has resulted in an increase in the magnitude of poleward transport from 1997 in spite of the LTG getting continuously smaller. Apparently, some counter-balancing factors have been more important, such as the shift in the TPW. The Arctic has had a dramatic warming during this period, the ‘Arctic amplification’, caused by enhanced heat transport in the atmosphere and the oceans. This has reduced the temperature gradient, and apparently made other factors such as the TPW shifts more important.
Changes in the water cycle are consistent with all the claimed climate shifts, including 1997. This implies that changes in the water cycle are essential to MT, as seen in the significant developments of TPW in figure 4. We also have a lot of evidence of the 1997 shift in the Arctic, as well as in cumulative indexes of various multi-decadal climate oscillations such as AMO, ENSO and the PDO.[1, fig. 11.10]
Answering the headline question: Yes, it is clear from the data and the literature that climate regimes and climate shifts driven by transport of heat and moisture are for real. That is true not only in the modern era, but has characterized the climate throughout the Holocene, and more.[10] But it is also clear, that there are no regular interactions, or regular cycles: some fundamental global climate variables involved in the 1976 shift were not affected in 1997.
Finally, green-house gas forcing via CO2 has no role to play in the climate shifts during the modern era. First of all, CO2 is monotonically increasing throughout all the mentioned climate shifts, and secondly, it’s effect on heat transport has been deemed to be “negligible”.[10]
The next round will bring the battle to the Arctic, the home arena for the WGH.
Appendix: a note on sensible and latent heat
The water cycle involves around 10 times more vertical net heat transport as latent flux compared to sensible heat transport. But if we look at meridional heat transport beyond the tropics, less than half is horizontally advected as latent energy compared to sensible heat.
The meridional heat transport in the climate system can be thought of as being maintained by three components: the dry air heat transport AHTDSE, the ocean heat transport, and the latent heat ‘joint’ mode AHTLE.[7] In the polar latitudes the transport of dry air heat dominates over the transport of latent heat:

References
[1] Vinós, Javier, Climate of the Past, Present and Future: A scientific debate, 2nd ed., Critical Science Press, 2022.
[2] Vinós, Javier. Solving the Climate Puzzle: The Sun’s Surprising Role, Critical Science Press, 2023.
[3] IPCC AR6 WG1, Summary for Policymakers (SPM), figure SPM.2, https://www.ipcc.ch/report/ar6/wg1/chapter/summary-for-policymakers/
[4] Recent observed interdecadal climate changes in the northern-hemisphere. Trenberth, AMS 1990, https://doi.org/doi:10.1175/1520-0477(1990)071<0988:ROICCI>2.0.CO;2
[5] From Anchovies to Sardines and Back: Multidecadal Change in the Pacific Ocean, Chavez and 3 co-authors, Science 2003, https://doi.org/10.1126/science.1075880
[6] Global Variations in Oceanic Evaporation (1958–2005): The Role of the Changing Wind Speed, Lisan Yu, J.of Cl. 2007, https://doi.org/10.1175/2007JCLI1714.1
[7] Decomposing the meridional heat transport in the climate system, Yang and 4 co-authors, Clim Dyn 2015, https://doi.org/10.1007/s00382-014-2380-5
[8] Ocean-atmosphere climate shift during the mid-to-late Holocene transition, Morley and 2 co-authors, 2014, https://doi.org/10.1016/j.epsl.2013.11.039
[9] A new dynamical mechanism for major climate shifts, Tsonis and 4 co-authors, https://doi.org/10.1029/2007GL030288
[10] Heat Transport Compensation in Atmosphere and Ocean over the Past 22 000 Years, Yang and 5 co-authors, Nature 2015, https://doi.org/10.1038/srep16661
The basic proposition seems to be that the WGH relies on internal system variations to drive changes in meridional heat transport to cause variations in global temperature.
I humbly suggest that that does not explain why there seems to be a link to solar variability.
In contrast I propose that solar variations drive changes to meridional heat transport which leads to variations in global temperature by altering global albedo so as to change the proportion of insolation that can be absorbed by the system.
The WGH seems to see climate variability as a consequence of changes in meridional heat transport whereas I suggest that changes in meridional heat transport are a negative system response to anything that seeks to alter the surface temperature set by the convective overturning of atmospheric mass at a given level of insolation. In the process we see climate variability.
It will be interesting to ascertain which is correct.
Actually this is not how the hypothesis has been proposed. The changes in heat transport respond to several causes, some internal and some external.
The Sun cannot explain the climate changes that took place in the 1920s and early 1930s, when there was considerably global warming under low solar activity, but it can explain why the Arctic warmed in the 1920s due to low solar activity.
In the long term the Sun is the main factor because it has long and very long cycles that affect its activity for a very long time, but over a few decades oceanic oscillations are more important because most heat and humidity are transported by the troposphere and ocean, while the Sun affects more stratospheric transport. That’s why the climate shows the same oscillations as the oceanic modes of variability, and not the solar cycles.
“The Sun cannot explain the climate changes that took place in the 1920s and early 1930s, when there was considerably global warming under low solar activity, …”
You couldn’t be wronger, as only in your mind was solar activity too low for warming in the 1920s and 1930s.
Cycles 16 & 17 were at least as high in sunspot activity as current solar cycle #25, under which there has already been notable warming.
Your laundry list, actually your wish list, of mechanisms isn’t even necessary if you only understood global warming properly as being a function of the sunspot number higher than my sun-ocean decadal warming threshold of 95 SN.
Sunspot counts are a BS proxy
We learned that since the late 1970s when satellite measurements began proving sunspots were a poor proxy for TOA TSI
The Sunspot Count Nutters will never let their beloved sunspot counts die off.
Sunspot counts are junk science.
But you know about Be10 ?
Boy you are so solar stupid.
There is much more than just sun spots controlling our climate. Javier Vinos does an excellent job describing climate’s many inter-related components in his fascinating book called: Climate of the Past, Present and Future.
Thank you for the WGH overview. Regarding the unprecedented 2022 Tonga volcano, do you see any linkage to recent tropospheric and oceanic temperature increases?
Yes, absolutely. The warming of the oceans in 2023-2024 is completely anomalous and unprecedented when compared with sea surface temperatures since 1979. It cannot respond to ENSO or slowly increasing anthropogenic forcing.
https://pbs.twimg.com/media/GNeXOOCX0AE64O2?format=jpg&name=large
And we have a good explanation for it, because the expected effect of increasing stratospheric water vapor is surface warming.
Thank you, as this is logical with known science. Too bad the media refuses to acknowledge the power of water vapor over CO2.
Well, I am not quite convinced by said “WGH”. However, it is true “climate science” can not explain the observed warming trend with their metrics. These are the total forcings named in AR6 resolved as graph..
They nicely added some forcing increment towards 1950. However, it is so little (<0.3W/m2), you would hardly get any measurable warming from it. The warming in the 1st half of the 20th century was more like 0.4K. If you relate that warming to the miniscule forcing, you would get a transient climate sensitivity 6K or higher, not to mention ECS.
Things get completely absurd if we look at it by hemisphere. The negative anthropogenic forcings were mostly in the NH. Considering that, you get a forcing chart like this for the NH..
Fair to say, it is not quite what temperature records show.
Amazing how well the urbanisation graph coincides with your top “forcings” graph. 🙂
The WGH is a different climate hypothesis to all the rest. It represents a change in paradigm.
Since the 1960s all climate change hypotheses have been based on a change in the top-of-the-atmosphere (ToA) energy fluxes.
But according to the WGH these changes have a second order contribution to climate change because the Earth is protected by a strong greenhouse armor made of water vapor and clouds that prevents the climate from changing.
However, this armor has two weak spots at the poles. And altering the amount of heat to the poles acts like the radiator of a car and is the most effective way of changing the climate. The Antarctic weak spot is protected by a very strong vortex, but the Arctic weak spot is the reason the planet has been cooling for 15 million years, the reason why it responds so much to small changes in insolation caused by small orbital changes, and the reason why it responds to the very small changes in solar activity.
This is a complete change of paradigm, and if I am correct we have been wrong about the climate for the past 60 years. Before that there were quite a few scientists that believed that the effect of tectonics on heat transport was the cause of the most important climate changes of the past, but that all was washed away by the ToA paradigm.
“This is a complete change of paradigm, and if I am correct we have been wrong about the climate for the past 60 years.”
False equivalence. You don’t have to be correct for other people to have been wrong about the climate for the past 60 years.
There still has to be a solid reason given, not hand-waving, as to why more heat was in the tropics after 1980 to drive global warming and more heat to the poles.
Climate is only 30 years of weather now so it is always like the weather changing.
As usual, there are no uncertainty boundaries shown. Real world measurements and estimates are not exact. They have probable variations around a nominal value, and the 2-sigma ‘whiskers’ should always be shown with the exception of when the 2-sigma range is smaller than the symbols used for demarcation of the sample points, diamonds in this illustration. However, that is rarely the case in climatology.
These are the best, central estimates as presented in AR6. You can also have the table..
“Uncertainty” will the not the fix the problem, as the IPCC restricts itself to basically two anthropogenic forcings: GHGs and aerosols. You could use other powerful forcings on top of that, but that is exactly what the IPCC wants to avoid at all cost, because it needs to be about anthropogenic GHGs.
When it comes to aerosols there is no room to maneuver. If you increase their impact, you get even less warming, or rather more cooling up to the 1970s and forcings match the temperature record even less. If you go the opposite way, reduce negative aerosol forcing, climate sensitivity goes down. Also then it becomes harder to explain the cooling between the 1940s and 1970s.
It is a dilemma and that “best estimate” is already the compromise. And it is not working.
https://greenhousedefect.com/the-holy-grail-of-ecs/a-cross-check-to-manns-hockey-stick
I read Javier’s book, gave it a favorable review, and find WGH a very plausible hypothesis, It doesn’t rule out some contribution by GHG, merely says there are other (bigger) natural variations at play. That is very problematic for the IPCC ‘CO2 control knob’ hypothesis, so they suppress the inconvenient fact in at least two ways.
Akasofu’s 2010 paper, Curry’s later quantitative stadium wave paper, and my qualitative essay ‘Northwest Passage’ in ebook Blowing Smoke all showed that that there is a quasi cyclical summer Arctic ice full cycle (peak, nadir, peak) of about 60 years. A natural ice peak was about 1975 based on Northwest Passage (low based on Larsen’s one year transit 1944 in just 89 days). Satellite ice coverage started in 1979, very near the natural peak.
So the alarmists projected an ice free Arctic summer by mid 2010s by not acknowledging the obvious natural quasicycle, and using a ruler instead. Of course they now have egg on their faces because the natural cycle started increasing summer Arctic ice again after the 2012 weather event low. Last years low was ~4.5 Wadhams—Wadhams being one of several who said it would be zero between 2014-2016. A Wadhams is a million km^2 of sea ice by DMI precise areal definition.
Climate shift implies a significant directional change in the 30-year average. The 30-year average SST is very linear with the 30-year integrated MEI average after 1980, the true time of the ‘shift’. I saw no attempt was made here to explain why it happened in the first place in 1980 or 1976.
“Finally, green-house gas forcing via CO2 has no role to play in the climate shifts during the modern era.”
Tsonis etal 2007 said the physical mechanism for this is not known, but they ran a model simulation about a future unknown event then used it to create a new hypothesis re CO2:
My only agreement is with “It is interesting to speculate on the climate shift after the 1970s event.”
By the WGH not providing a cause for this makes the WGH unforced, as it doesn’t answer why these synchronous states happen at all or why global warming happened after 1980.
Transport is the effect of the primary cause that has still not been identified in the WGH.
SST as a straight line on what Phil Jones, CRU, described as “mostly made up” for large parts of the SH. What’s not to like? 😉
That’s a very linear way of thinking. Climate is more complicated than you think. I recommend Phil Salmon’s article on how patterns and quasi-periodicities can emerge from chaos due to a weak external forcing through dimensionality reduction. It is a very interesting read and has a great example showing that AMO implies changes in meridional heat transport:
Salmon, P., 2024. Dimensionality reduction of chaos by feedbacks and periodic forcing is a source of natural climate change. Climate Dynamics, pp.1-19.
That’s going in the wrong direction, but it suits people who don’t have a grasp on how simple solar climate forcing is, people like you who make mountains out of molehills.
I’m not surprised that you like this paper as it has all the BS elements yours does, like the use of vacuous word-salad explanations such as
It shows me you’re still grasping for an answer at this late hour while pretending to have been on top of this already.
“Transport as climate control knob” – very funny!
No. Because there’s no evidence for them, that’s why.
Sure thing. The mid 1990s drop in cloudiness of 1.86% right at the AMO phase transition is just coincidence.
You should be able to demonstrate that the Earth taken as a heat engine shifted gears that time, that would be evidence. A drop in this or that is just a consequence of that.
The average cloudiness percentage probably has a margin of error of +/- 10%
A 1% or 2% change is statistically insignificant.
Percentage cloudiness does not measure the exact amount of solar energy blocked by clouds, which depends on types of clouds, height of clouds and the timing of couds These data do not exist for a global annual average of solar energy blocked by clouds.
But still the absorbed solar energy has been increasing, inversely related to decrease cloud.
Just because your brain-washed AGW cultism cannot allow you to accept that fact… doesn’t make it false.
There is no way to differentiate the causes of more sunlight reaching Earth’s surface
Reduced SO2 emissions and other air pollution reductions
and
Changes of cloudiness
Changes of these variables should mostly increase TMAX warming but the majority of warming since 1975 was increased TMIN
You struck out again, Mr. El Nino Nutter.
No scientific evidence for CO2 warming, that is for certain, but AGW-cultist “believe” it anyway.
And yes, there is evidence for climate shifts.. They have happened for millions of years.
I believe you have wasted your life ignoring 127 years of AGW evidence collection and the nearly 100% of scientists since 1896 who believe that evidence.
With your childish You Can’t Prove It rhetoric
Science does not prove anything, Mr. El Nino Nutter.
Science collects AGW evidence that you completely ignore
You are the opposite of the IPCC that prefers to ignore evidence of natural causes of climate change. You ignore evidence of manmade causes.
Two biased losers.
Of the “127 years of evidence” you cannot show any empirical evidence that confirms the AGW hypothesis in the real world. You also cannot provide any evidence that “100% of scientists since 1896” believe that mysterious evidence.
Cutting pollution from the shipping industry accidentally increased global warming, study suggestsBy Ben Turner published 6 hours ago
A reduction in sulfur dioxide emissions may have caused “80% of the measured increase in planetary heat uptake since 2020.”
The shipping industry’s attempt to reduce air pollution has inadvertently accelerated global warming in the short term and contributed to record-breaking sea temperatures, according to a new climate model.
Recent global shipping regulations slashed the sulfur dioxide emissions from cargo ships by a dramatic 80%. But this rapid reduction in sulfur pollution may have “created an inadvertent geoengineering termination shock with global impact,” a new study has suggested.
“The warming effect is consistent with the recent[ly] observed strong warming in 2023 and [is] expected to make the 2020s anomalously warm,” the researchers wrote. The warming is equivalent in magnitude to “80% of the measured increase in planetary heat uptake since 2020.”
And this reduction in pollution “could lead to a doubling (or more) of the warming rate in the 2020s compared with the rate since 1980,” the researchers suggested in the new study, published May 30 in the journal Communications Earth and Environment.
The new shipping regulations, which were implemented in 2020 by the International Maritime Organization (IMO) reduced the maximum sulfur content in shipping fuel from 3.5% to 0.5%, with the aim of improving air quality and preventing an estimated 30,000 premature deaths each year.
But aerosols such as sulfur dioxide particles are highly reflective, and when they are released they settle in the stratosphere and bounce the sun’s rays back into space — sometimes acting as a giant planetary sunblock.
So when the regulations brought decades of massive pollution to an end, they began an unintended geoengineering experiment. Since March 2023, the loss of the sulfurous fog — combined with accelerating global warming due to burning fossil fuels, the El Niño climate pattern and the 2022 eruption of the Hunga Tonga-Hunga Ha’apai volcano — has sent average sea surface temperatures to record-shattering highs.
However, other climate scientists have disputed some of the study’s conclusions. Gavin Schmidt, the director of NASA’s Goddard Institute for Space Studies, told Live Science that, while the researchers’ estimate for the increased solar energy entering Earth’s atmosphere is accurate, “their estimate of the temperature response is not quite right, I think.”
Schmidt pointed to an analysis made by Zeke Hausfather, a climate scientist at the Breakthrough Institute, which argues that the study’s warming calculation relies on an overly simplified model that misunderstands heat uptake from the ocean, meaning the study overstates the sulfur reduction’s warming impact.
“We are still waiting on updated analyses related to the HTHH [Hunga Tonga-Hunga Ha’apai] volcano, other aerosol emissions, the solar cycle and various aspects of internal variability,” Schmidt added. “That is on top of other analyses of the IMO rules that are ongoing.”
The findings come at a time when governments are eyeing up controversial solar radiation management (SRM) techniques, which propose to dim the sunlight reaching Earth by intentionally releasing aerosols such as sulfur dioxide into the atmosphere.
But Schmidt believes that these techniques are not viable.
“I strongly doubt that this [solar radiation management] will ever be part of any sustainable response to climate change — but the issues that underlie that conclusion have very little to do with the science and almost everything to do with how such an effort is governed and how fragile it will be to economic or geopolitical uncertainties,” Schmidt said.
story tip
We have an open thread every Saturday night where a 574 word off topic post might be more appropriate.
You could have written: story tip. Cutting pollution from the shipping industry accidentally increased global warming, study suggests and it would have gotten to me. Putting in an old open thread would also still get to me.
Okay,Here is a link to the study:
Abrupt reduction in shipping emission as an inadvertent geoengineering termination shock produces substantial radiative warmingPublished: 30 May 2024
https://www.nature.com/articles/s43247-024-01442-3
I’ve seen it. It’s all models. Do we like models when they say what we want to hear?
Strive for consistency.
I’ll probably write up a post tomorrow. It’s an ok paper but the skeptoshere is a bit over enthusiastic about it.
It makes regional predictions. Uggh.
Not really buying this one either. We need major stratospheric eruptions in the tropics to produce cooling. Why would low atmosphere emissions have any kind of major effect?
“A reduction in sulfur dioxide emissions may have caused “80% of the measured increase in planetary heat uptake since 2020.”
Mainly BS
There was a 30% decline of SO2 emissions in 2020, versus 2019, mainly from the shipping industry
That was an unusual year for the SO2 emissions declining trend that began in 1980.
It could have warmed the NH average temperature for one year because that’s where most SO2 emissions are.
The 2019 – 2020 change does not explain much of the warming after 2020
CO2 is a much stronger climate forcing than SO2, with a residence time of hundreds of years, versus 10 days for SO2
Do you have any scientific evidence that CO2 causes warming or any changes to the climate at all ??
We are all still waiting !
Still waiting for a semi-intelligent BeNasty2000 comment but I am continually disappointed
El Nino Nutters like you are why conservatives are ridiculed by people who understand the basics of climate science.
Mr. Greene attached is a chart from a heat transfer book showing emissivity of CO2 at various temperatures and pressures. Please explain how CO2 can be a climate forcing when at some temperatures and pressures its emissivity is zero up to about 750 R.
The title for the chart is “Emissivity for carbon dioxide according to Ref. 22, foot total pressure = 1 atm, 1.0 kN/m = 0.03238 atm-ft.
“Cutting pollution from the shipping industry accidentally increased global warming, study suggestsBy Ben Turner published 6 hours ago
A reduction in sulfur dioxide emissions may have caused “80% of the measured increase in planetary heat uptake since 2020.””
What caused the “heat uptake” from the 1910’s to the 1930’s. This warming was of the same magnitude as the current warming, but cutting shipping pollution had nothing to do with it. Something else caused this warming.
Hansen 1999:
Tom Abbott;
As I explained to you earlier, there was a 24 month recession between Jan 1910 and Jan 1912 that caused temps to rise because of fewer industrial SO2 aerosol emissions.from idled foundries, factories, etc.. Plus 5 others between 1912 and the start of the depression, August 1929..
ALL warming or cooling events can be correlated with changing levels of SO2 aerosols in the atmosphere.
The claims of a big change in 1976 is questionable. What happened is 5 of the previous 6 years had been La Nina years which was followed by El Nino. No one understood ENSO back then so it got lots of study.
There’s also the general warming out of the Little Ice Age that needs to be factored in. It’s probably still ongoing today. If one accepts this is real, then all one needs is the AMO driver (arctic sea ice) and volcanoes to explain climate change.
The ENSO is coupled with PDO, and usually leading PDO.
The cumulative indexes of both PDO and ENSO turned positive around 1976, after a negative path since 1944 or so.
After 1976 that they increased until around 2000, when they turned into a negative path again.
The AMO also turned around 1976.
Here is a reference to an excellent paper that details all the changes in the atmosphere taking place 1976/77 and discuss their relations to the ENSO variation:
Abrupt atmospheric torque changes and their role in the 1976–1977 climate regime shift, Marcus and 2 co-authors, AGU 2011, https://doi.org/10.1029/2010JD015032
See e.g. their fig. 8, where they look at the shift after removing the ENSO effect. Quite convincing, imho.
Thus, there is a rather strong case for the existence of this (and other) global climate shifts and that it’s not about a ‘masked’ ENSO change.
Here’s a chart demonstrating some of those turns i mentioned. Its ENSO cumulated (detrended MEI index), and with PDO turning points marked with arrows. These are indicators of when those shifts happened. Whether the shifts are climatologically significant or not, is another question.
Only to those who have not read the literature on the evidence. Just the first study identified 40 variables that had undergone a step change in 1976.
Ebbesmeyer, C.C., Cayan, D.R., McLain, D.R., Nichols, F.H., Peterson, D.H. and Redmond, K.T., 1991. 1976 step in the Pacific climate: forty environmental changes between 1968-1975 and 1977-1984. In: J.L. Betancourt and V.L. Tharp, editors. 1991. Proceedings of the Seventh Annual Pacific Climate (PACUM) Workshop, April 1990. California Department of Water Resources. Interagency Ecological Studies Program Technical Report 26.
It includes a step change in the angular momentum of the atmosphere induced by step changes in the main torques on which it depends. The entire atmospheric circulation of the Northern Hemisphere in winter experimented a step change.
Graham, N.E., 1994. Decadal-scale climate variability in the tropical and North Pacific during the 1970s and 1980s: Observations and model results. Climate Dynamics, 10, pp.135-162.
This was the year global warming started. And it cannot be explained by the increase in human forcing, so most researches ignore it, like you do. Ignoring the evidence is a path that leads to failure.
Javier Vinos:
According to plots of average anomalous Jan-Dec global temperatures, global warming began in 1980, as the result of “Clean Air” legislation passed between 1971 and 1980, which called for the reduction in industrial SO2 aerosol pollution. due to Acid Rain and health concerns.
They peaked at 139 million tons in 1980, and by 2021 they had fallen to 72 million tons, a decrease of 67 million tons. This massive decrease in the amount of atmospheric aerosol pollution has increased the intensity of the solar radiation striking the Earth’s surface, and thus is the cause of ALL of our warming since 1980.
. .
Then why is global warming slowing down? … https://wattsupwiththat.com/2023/01/07/2022-seventh-warmest-year-warming-slows-down/
John Shewchuk:
A good question.
Fallout of the water from the Hunga Tonga eruption began in late Feb of 2023, and it flushed out a lot of the industrial SO2 aerosols in the troposphere (primarily from China and India), causing the 2023 El Nino.
The volcanic fallout period usually lasts about 2 years, then the removed SO2 aerosols begin to be replaced by the emitting sources, and global warming begins to slow down.
I discussed this in a recent article
https://doi.org/10.30574/wjarr.2023.19.2.1660
The “slowing of global warming” study began with the advent of UAH satellite data — long before Tonga.
John Shewchuk.
I see that I should have read your link first. I thought that you were talking of the 2023 El Nino, which is fading away.
Javier was speaking of the 2014-2016 El Nino, which was ended by 4 volcanic eruptions in 2014 and 2015. Their injection of dimming SO2 aerosols into the stratosphere was the cause of the subsequent cooling,.as well as that from later eruptions in 2017, 2018, 2019, and 2020.
Please provide a study showing the statistical significance of prior ENSO cycles & volcanic activity. On the other hand, Javier Vinos has shown the sun has significant influence on ENSO cycles.
John Shewchuk:
The sun is the source of all of our warming.
SO2 aerosols are a haze of pollution that decreases the intensity of the solar radiation striking the Earth’s surface. If that haze is decreased enough, enough warming can occur to form an El Nino. (I have identified at least 4 causes of decreased SO2 aerosol emissions that can lead to an El Nino)).
See: “The definitive cause of La Nina and El Nino events”
https://doi.org/10.30574//wjarr.2023.17.1.0124
and “El Ninos: Their magnitudes and durations”
https://doi.org/10.30574/wjarr.2023.19.1.1306.
Neither link works. Regardless, claiming a definitive cause of ENSO (or of any climate cycle) is dangerous considering how little we know about the complex interactions of earth’s climatic systems (QBO, MJO, PDO, AMO, Stratospheric Ozone heating, etc).
John Schewchuk::
Nevertheless, ALL El Ninos that I have examined correlate with decreased SO2 aerosol emissions.
The links work, but it takes about 10 seconds for them to appear
John Shewchuk:
There is an error in the first link.
It should be: https://doi.org/10.30574/wjarr.2023.17.1.0124
There does not appear to be anything new here. All it is is a non-standard description of the naturally occuring mechanisms for energy transport around the globe. Thus if it was true then it would occur in global climate models since all of the relevant physics is included.
Furthermore none of this say anything about what the effect of rising CO2 levels will be. This winter gatekeeper hypothesis relies on the green house effect to keep the earth warm and for energy to leave at the poles. So it would be natural to expect that changing the size of the green house effect will also change how the winter gatekeeper works.
There seems to be a fundamental logical fallacy here which insists that an effect can only has a single cause. Both the winter gatekeeper hypothesis can be correct as well as the fact that rising CO2 levels are causing temperatures to increase.
There does not appear to be anything at all in your comment.
“that rising CO2 levels are causing temperatures to increase.”
A zero-evidence mantra conjecture.
You are wrong on several accounts. Meridional heat transport is a gap in our knowledge and our models. We don’t have good theories to describe it because it responds to very complicated physics. We can’t measure it properly because it is taking place in a constantly varying way over all the atmosphere and all the ocean. It is very variable with the seasons, and it responds strongly to changes in the wind that models are unable to reproduce. Climate scientists believe in an old principle called Bjerknes compensation that states that oceanic and atmospheric transport changes compensate with each other to keep transport constant, which has never been proven. It is present in models but it is different in each model and its physical basis are unknown. Evidence from Arctic warming indicates this principle is incorrect, so models and scientists are caught in a wrong paradigm they cannot dismiss.
Emissions from the poles are not known. There is a new mission to measure them for the first time:
https://phys.org/news/2024-05-nasa-ground-climate-satellite.html
My hypothesis cannot be proven wrong with current knowledge, because it fits perfectly well in it.
If the WGH-proposed mechanism accounts for just 30% of climate change, it defuses the emergency claim.
https://www.drroyspencer.com/2018/02/diagnosing-climate-sensitivity-assuming-some-natural-warming/
But the evidence suggests this mechanism is the main one, and the climate essentially always changes due to changes in heat transport.
“If the WGH-proposed mechanism accounts for just 30% of climate change, it defuses the emergency claim.”
You’ve established scientifically that the WGH accounts for exactly 0% of climate change.
Your “if…just 30%…” is just more of your hand-waving. Don’t you see that?
Javier Vinos, you haven’t even calculated that 30% number, you just pulled it out of your a**!
No, you haven’t provided anyone any quantitative reason at all to suggest this mechanism is the main one, so you are fooling yourself and anyone gullible enough to follow you.
The IPCC blames climate change on humans by ignoring evidence of natural climate change
This article blames climate change on natural causes by ignoring all evidence of manmade causes
Both approaches are propaganda, not fair and balanced science
When it comes to propaganda terms, the Climate Howlers with their “boiling oceans” beat this author with his “climate shifts”.
Both phrases are propaganda.
The debate is mainly between the Climate Change is Natural Nutters and the Climate Change is Manmade Nutters. Both are extreme positions with strong confirmation bias.
Contrary data are generally ignored,
They are inconvenient data.
FROM THS ARTICLE:
“there is almost 10 percent more water in the atmosphere today than 120 years ago.”
That claim is total BS not based on reliable data
The global average annual absolute humidity
is an inaccurate, unreliable statistic today. It was certainly not known 120 years ago.
Well,…
since you refer to poor data on humidity, i’ll comment only on the data for the TPW i used in figure 4. They are a mix of measured and reanalysed data from the ECMWF ERA5 (0.5×0.5 deg) which goes back to 1940, and ERA20C from 1900-1940. The data source: ECMWF.
Here is a recent research paper that discusses those very data:
https://doi.org/10.5194/hess-28-2123-2024
Quote: “Our results indicate a global increase in total precipitable water
(TPW) of 2% per decade from 1993–2021. … The relationship between TPW and T2m showed a variation of around 6%/K–8%/K in the 15–55°N latitude
band, aligning with theoretical estimates from the Clausius–Clapeyron equation.”
ERA5 combines vast amounts of historical observations into global estimates using advanced modelling and data assimilation systems. It’s the best data we have, and they very clearly show the shifts and regimes as in fig.4.
Here is a page with data documentation:
https://confluence.ecmwf.int/display/CKB/ERA5%3A+data+documentation#ERA5:datadocumentation-Observations
RG doesn’t “believe” any change in the climate happens naturally.
A true AGW-cultist/zealot. !
When he says “Climate Change is Manmade Nutters.“, he is describing himself.
I will not show you again and again and again the data of rel. and spec. humidity at 300mb.
You know they exist, but you always repeat your lie.
I explained why the data for an annual average global absolute humidity percentage are unreliable and worse than the low accuracy of the surface temperature data, but you keep harping on and on like a broken record Hairy Krishna.
Absolute humidity measurement globally is poor under the elevation of satellites … where most of the humidity is located.
From the post, “The climate system persistently tries to restore radiative imbalances through the meridional transport of heat via atmospheric and ocean circulation systems that control the poleward flux of latent and sensible heat,”
So wind turbines slow down heat dissipation. A not insignifigant means of earth shedding heat is circulation and convection – conduction. Slow down that process and you have warming, simply due to increasing the residence time of energy within the system.
“Slow down that process and you have warming, simply due to increasing the residence time of energy within the system. ”
Windmills are Mechanical CO2.
Wow, having read the article and 40 comments- and I understood almost none of it- is convincing me that “climate science” is nothing like chemistry and physics, truly sound sciences. The climate is just too complicated. Too many variables- many unknown variables- many unknown unknowns- and too many computer models. So for anyone to claim that “the science is settled” is just plain nuts. To rush into net zero has got to be one of the craziest policies of all time.
What’s truly insane is that here in Wokeachusetts, I bet almost 100% of the population either believes in the climate cult madness or are unwilling to speak up against it. Sure, in the last few decades, the temperature is slightly warmer- to our benefit and there is not an increase in severe weather. So, the climate here is slightly better- yet we’re about to rush off the cliff like lemmings.
The only thing settled about climate science is humans have lived through 48 years of global warming that was pleasant, … but many people fear the future climate …because they are told it can be predicted … and can only get worse, never better,
The root cause of this problem is scientists who refuse to say “we don’t know”. And they get paid for scary predictions that have a political goal: Leftist Fascism.
Joseph Zorrin:
Actually, the climate is VERY simple. See my 7:25 am post.
Javier Vinos.
Been fascinated by Solving the Climate Puzzle.
A question I have is about climate on millenial scales. If both heat and water are transported to the poles and exit to space, then over many millions of years the amount of water on the planet will decrease. Is this true?
Only heat exits into space from the poles as infrared radiation. Water is precipitated as snow or ice and recycled.
The planet loses very little water. It conserves essentially all oxygen, but a little bit of hydrogen is lost due to methanogenesis and methanolysis. Hydrogen is very light and if it does not react with oxygen, it rises to the top of the atmosphere where it is stripped from the Earth by solar wind.
Scientists calculate that up to 25% of the initial water of the oceans has been lost this way over the last 4 billion years.
Pope, E.C., Bird, D.K. and Rosing, M.T., 2012. Isotope composition and volume of Earth’s early oceans. Proceedings of the National Academy of Sciences, 109(12), pp.4371-4376.
But the rate of loss reduced greatly after the atmosphere became oxygen-rich.
Although figure 3 shows no shift in 1997, this figure below, displaying the derivatives of HadCRUT4, shows there is an inflection point in ~1997 and suggests that the shift is developing at present (red curve).
The green curve shows the change of Arctic sea ice extent. The maximum of decrease was in ~2005.
The underlying positive temperature trend remains intact, and the derivative is still positive.
Of course, it’s possible that ‘the shift is developing’. However, it’s already 27 years since 1997, and nothing much happened in all those years, climatologically speaking.
“Recent global warming began in 1976 with a sudden climate shift in the Pacific Ocean that increased zonal atmospheric circulation and decreased poleward heat transport, affecting the global temperature trend. As a result, the multidecadal oceanic oscillations changed from a cold phase, which had led to the 1945-1975 cooling period, to a warm phase.”
1970-1976 was zonal because it was a positive NAO/AO regime, that actually decreases the poleward heat transport. The negative NAO/AO regime from late 1976 increased the poleward heat transport, until the positive NAO/AO regime in the mid 1980’s, and the AMO cooled again for a few years.
“In the 1960s and early 70s the gradient grew bigger, the poleward heat transport improved and global temperatures cooled somewhat.”
That was reduced poleward heat transport, the AMO and Arctic cooled.
“There are also no signs of a climate shift 1997 in the Earth energy imbalance (EEI) or Ocean heat content (OHC) data.”
Yes there is, the upper 2000 meters saw almost no warming during the 1965-1995 cold phase of the AMO, most of the warming is since 1995.
Thanks for your comment, Ulrich.
The OHC shows very clear effects after 1976, but nothing much after 1997.
The EEI since 2000 calculated from Ceres data shows a more or less continous increase, the red curve is Loess smooth.
Here’s the OHC graph.
Clear effects after 1976, but nothing much after 1997, only some rather short-term ‘pause’.
0-700 meters is essentially the same, very little warming 1960-1995 with most of the warming since 1995.
Here is 0-700 meters in Joules as with your chart. In the 35 years from 1960 to 1995 the yearly average rises 4 units, and in the 25 years from 1995 to 2020 it rises 16 units.
So during the 1970’s there were furiously strong solar wind states, then in late 1976, that collapsed and plunged the NAO/AO into a negative regime through to 1981. That -NAO/AO regime booted the PDO into a positive phase, and drove a few years of AMO warming. Stronger solar wind states in the mid 1980’s and early 1990’s drove colder AMO anomalies via +NAO/AO regimes, then much weaker solar wind states since 1995 flipped the AMO into its warm phase via -NAO/AO regimes 1995-1999 and 2005-2012.
And the warmer AMO drives a decline in low cloud cover, apart from over the Arctic Ocean.
Solar plasma temperature and pressure:
The article appears confused:
“In the 1960s and early 70s the gradient grew bigger, the poleward heat transport improved and global temperatures cooled somewhat.”
And then: “the ‘Arctic amplification’, caused by enhanced heat transport in the atmosphere and the oceans. This has reduced the temperature gradient.”
It is not sufficiently clear what the author is trying to communicate; does the author seek to claim that a large or small observed temperature gradient is associated with more heat transport? Generally speaking, a relatively small temperature gradient is associated with more heat transport.
Note that combining sensible and latent flux in a k type T-gradient term does not account for the fact that the latent heat flux depends primarily on specific humidity gradients, which in turn depends on temperature in a nonlinear way. Since saturation-specific humidity depends approximately exponentially on temperature, an increased latent heat part would lead to a more effective heat exchange given the same value of k.
Naturally, with no heat transport, the equator–pole temperature gradient is at a maximum, but since no heat is transported, no entropy is produced by poleward heat transport. At the other extreme of very large heat transport, the temperature difference becomes very small, so that the conversion of heat occurs at roughly the same temperatures and again no entropy is produced. Consequently, there is a maximum in entropy production for an intermediate value of heat transport, resulting in an intermediate temperature gradient between the tropics and the poles. The result is to maximize radiation entropy export to the space.
These issues should be straightened out as the confused logic in the article has now been repeated several times on these pages.
Obviously the poleward heat transport was reduced during the late 1960’s to mid 1970’s.
Thanks for your comment JCM.
The two quotes from the article might seem contradictory, but are both correct. A big gradient enhances heat transport, but as more heat is transported to the Arctic, the Arctic warms and the gradient becomes smaller.
It’s a dynamic system. As we move from one shift point to another the LTG changes over time, and acts as a feedback on MT.
One of the driving forces of MT is LTG, but there are other forces as well such as the latent heat flux in the atmosphere-ocean-land coupled system
The byline to figure 2 states it correctly, and corresponds to what Morley et al. say in their paper, ref. [8, fig 4]
You say: “a relatively small temperature gradient is associated with more heat transport”. That’s obviously not correct and contradicts Morley et al.
A quote from Yang et al. [7] might clarify the feedbacks in the dynamic system: “The AHTLE [atm.heat transport of latent energy] is one of the major components of the meridional heat transport of the climate system. In the extratropics (poleward of 30°S/N) the poleward AHTLE (Fig. 9a) is resulted from atmospheric freshwater transport from the tropics (10–30°S/N) to the mid-high latitudes (Fig. 10), which tends to reduce the meridional density gradient, counteracting the effect of the meridional temperature gradient on the density gradient in the upper ocean. It plays as a brake for the poleward OHT carried by the thermal-driven meridional overturning circulation (Huang 2005).” (my emph.)
JCM
In the same paragraph as your second quote from the article, I write:
“There is an on-going change in the global heat transport system, and it has resulted in an increase in the magnitude of poleward transport from 1997 in spite of the LTG getting continuously smaller.”
Thus, even as the smaller LTG has influenced MT negatively, it’s still the case that MT has been growing, apparently due to other factors such as the increasing humidity and latent energy available.
The kinetic poleward heat transport is continuously depleting the driving temperature difference. A higher temperature gradient suggests a less efficient transport process.
The driver is the difference in solar radiation in tropics v pole.
Physically, heat is transported from one half the Earth to the other under the period of insolation. This yields an optimal depletion factor 1/2 for the transport and an additional 1/2 for the sun facing disc at any given time.
Optimal transport is simply (Rs_tropic – Rs_pole) / 4
Rs denotes the insolation forcing.
The radiative insolation temperature climatologically is about 300 W/m2 in tropics, and 175 W/m2 at pole. This yields an optimal kintetic transport about 30 W/m2, and a driving temperature difference about 35K.
The value of kinetic poleward transport is approximated simply by the geometry of solar heating across the Earth, nothing more, and resembles observation.
This means kinetic transport (your MT) is bound at a thermodynamic optimum, with no additional freedom. Thus the only freedom in total transport can be derived from variations in latent flux, with depends on the saturation temperature, not radiation temperature.
In terms of total net vertical transport and Earth energy balance, which defines the Carnot efficiency by radiative boundary conditions, a blackbody concept represents radiation at maximum entropy. The blackbody emission temperature of Earth bounds the lowest temperature at which the absorbed solar can be emitted to space, which represents the maximum radiative entropy export.
The blackbody emission is the coldest temperature from which work can be derived, and it yields the upper bound of how much power can maximally be derived from radiative heating of the surface and radiative cooling to space. This temperature is not the temperature of a specific height within the atmosphere, but entirely focused on the most optimistic entropy export associated with the emission temperature of outgoing longwave radiation.
It’s an incredibly complex dynamic flux system of MHT we’re talking about.
What about energy storage in the oceans, and velocities in the transport, which amounts to residence times, which all clearly affect the ‘equation’ of the energy balance?
What about the amounts of air mass transport, and the water vapour transport in the different interacting cells of the atmosphere?
What about the hydrological cycle with the latent energy transport having as big a role as the dry air transport in the th.dyn. ‘equation’? With the water vapour in the atmosphere predominately being supplied by the ocean, and with vertically integrated advection of water vapour being equal to the surface evaporation minus precipitation over the global ocean.
I see lot’s and lot’s of degrees of freedom and lot’s of potential for the MHT to influence the efficiency of radiation via changes in poleward heat transport.
Reduce complexity through the thermodynamic boundary conditions. That is the nature of the incoming and outgoing beam. Then you will discover the obvious geometric constraints. Instead of a seemingly endless freedom in internal process, it’s much easier to understand through thermodynamic limits. For the Earth in space, that is governed by radiation entropy (s). Owing to these limits, and the apparent adherence to simple geometries, ultimately the (s)ystem is always “working” as hard as it can internally. There will never be any slack in your MHT and LTG that somehow lead to transitions, it must always be working at the maximum. CMIP modelers face the same issue, bogged down in endless freedom and the resulting compensating errors. At the boundaries using natural thermodynamic laws things become much more clear.
Higher rates of poleward heat transport would have to be maintained to sustain a warmer AMO and Arctic. It’s always worked like that.
“A big gradient enhances heat transport, but as more heat is transported to the Arctic, the Arctic warms and the gradient becomes smaller.”
According to that, the AMO and Arctic should not have cooled in the 1970’s.