Guest Post by Willis Eschenbach
If aliens in spaceships saw our world, they wouldn’t name it “Earth”.
They’d name it “Water” because that’s what makes up more than 70% of the surface. And it’s also what controls the climate.
A couple days ago I stumbled across something I’d been trying to find for a while, a longer-term gridded global rainfall dataset. I finally located one at the Copernicus website. It runs from 1979 to December 2021. Here’s the global average rainfall from that site.

Figure 1. Annual average rainfall, 1979-2021
This shows some interesting aspects. The endless rainstorms of the intertropical convergence zone (ITCZ) are seen as the blue band above the Equator. The Pacific Warm Pool is marked by the blue blob of heavy rain north of Australia.
A short digression. The current central paradigm of mainstream climate science is that the change in global temperature is a lagged linear function of the change in total downwelling solar and longwave (thermal) radiation. In other words, forcing (which in the climate world generally means changes in downwelling radiation, hey, don’t blame me, I didn’t invent the term) rules temperature, and everything else averages out.
I hold a different view. I hold that a variety of emergent climate phenomena act in various ways, places, and times to thermoregulate the climate. One of the strongest of these phenomena is the daily emergence of tropical thunderstorms. When ocean temperatures exceed some local limit, thunderstorms form, rain falls, and the surface is cooled. As a result, in the current generally warming climate, we should expect an increase in tropical thunderstorms.
To investigate this prediction, I took a look at the rainfall trends. Figure 2 shows those, in millimeters per decade. Blue is getting wetter, and red is drying.

Figure 2. Rainfall trends, 1° latitude x 1° longitude gridcells.
As my theory would predict, the warming is leading to increased rainfall over the Pacific Warm Pool and around the Intertropical Convergence Zone.
However, the reason that I was looking for the rainfall dataset was not for the rain per se. It was because the rain is a measure of the evaporative cooling of the surface. The global average rainfall is about one meter per year. It takes ~ 80 watts per square meter (W/m2) of radiation over a one year period to evaporate one meter of seawater. In addition, there’s a cooling of another ~ 2.5 W/m2 due to the cold rain falling on the surface.
This means that globally, rainfall directly cools the surface by ~ 82 W/m2.
What I didn’t know until I got the Copernicus rainfall dataset was how that cooling is distributed around the planet. Here’s a view of that. Of course, it looks like Figure 1, only with different units.

Figure 3. Average ongoing cooling from rainfall, 1979-2021
The cooling is centered over the Pacific Warm Pool in the western Pacific. This is the warmest open ocean area. It’s well known that the average temperature of the Pacific Warm Pool never gets warmer than about ~ 30°C … and clearly, the 250+ W/m2 cooling of the warm pool due to rain is among the reasons.
Now, I wanted this information because it is a main part of the effect of clouds on temperature. The other main part is the separate and independent effect of the clouds on total radiation hitting the surface. Clouds warm some parts of the planet and cool others, by a combination of cooling by reflecting sunshine and warming by increased downwelling longwave radiation. Overall, these changes in radiation due to clouds cool the planet by about ~ 20 W/m2. Here’s how that is distributed around the planet.

Figure 3. Average ongoing cooling and warming from the cloud radiative effect, 2000-2023
Note the spatial similarity between the surface cloud radiative effect and the cooling due to the rainfall. No surprise there.
Note also the system’s efficiency—the clouds’ cooling effects (rainfall + radiation) are focused on the warmest areas. And this is true at both the local and the global scale—thunderstorms form preferentially over local surface hot spots. This gives the most cooling for the smallest effort.
Adding these two different cloud effects together gives us a measure of most of the effect of clouds on the surface temperature. I say “most of” because there are some other cooling effects. These include:
- Snow, sleet, hail, and graupel. Since these are frozen, there’s additional surface cooling from the melting of the ice.
- Clear dry descending air around thunderstorms. Because most of the water as well as most of the aerosols have been stripped out of the air by rainfall, there’s far less water vapor and aerosols to absorb radiation leaving the surface. This allows for greater surface radiation making it to space, cooling the surface.
- A cold wind from the condensation level of the atmosphere is entrained by the falling rain and hits the surface vertically. This wind then spreads out when it hits the surface, cooling a much larger surface area around each rain cloud.
Setting those other cooling effects aside for the moment, here’s the distribution of total cloud cooling (radiative plus rainfall) around the planet.

Figure 4. Full effect of clouds on the surface temperature
Note that rather than the ~ -20 W/m2 cooling from just the radiative effects of the clouds, the true effect of the clouds is about 100 W/m2, and there are large areas where the cooling exceeds -300 W/m2.
Next, we can take a look at the relationship between total cloud cooling (radiative plus rainfall) and surface temperature. This is clearest over the 70% of the surface that is water. Here’s that relationship.

Figure 5. Scatterplot, total cloud cooling (rainfall plus radiation) versus sea surface temperature. Each blue dot is a 1° latitude by 1° longitude area of the ocean surface.
This is exactly the shape we’d expect to see in a thermoregulatory system. As the sea surface temperature increases, the total cloud cooling reduces … but only up to about 26°C. Above that, the cloud cooling increases very rapidly, quickly becoming around -300 to -400 W/m2 of cooling as the sea surface temperature gets up close to ~ 30°C.
Now, the yellow line in Figure 5 shows the slope of the cloud cooling/temperature relationship, which is how much the cloud cooling changes for every 1°C of surface warming. And over at the right of Figure 5, that slope is ~ -100 to ~ -150 W/m2 of increased cooling for every 1°C of surface warming.
In closing, let me note that since 1950, CO2 has theoretically increased downwelling radiation by something on the order of 1.4 W/m2 … and that would be totally undone by a mere 1.4% increase in cloud cooling. In that context, bear in mind that global cloud cooling changes by up to 9% from one month to the next, and we never even notice …
[CODA] The important thing about cloud cooling is that it is temperature-controlled. It has nothing to do with forcing. When tropical sea surface temperatures go above about 26°C, it rains, regardless of the forcing. Period. See below.

Figure 6. Pacific equatorial rainfall, 5° north to 5° south.
My regards to all, and remember—rather than cursing the storm, learn to dance in the rain …
w.
As Always: Please quote the exact words you are discussing. It avoids endless arguments. And me, I’m going to be in town today when this publishes, so play fair, no eye gouging, and may the best wo/man win …
Discover more from Watts Up With That?
Subscribe to get the latest posts sent to your email.
“Graupel!” Yea, I learned a new word today! 😀
And I love seeing follow-on work, building on that marvelous 2015 article of yours, Willis.
Fluidia is a deathworld where unceasing convection tries to kill you.
I was already convinced. Now I am more convinced.
Separate observation. The climate models can’t do clouds well. Every AR has made this point—clouds are the climate model weak link. So cannot come close to modeling what WS has shown is most important. Climate ‘science’ fail.
And if clouds are the weak link, modeling of precipitation will be poor too. In this paper characterizing the GFDL CM4.0 climate model, there is Figure 18, which shows the precipitation RMSE (root mean square error) of the CMIP5 models for comparison. CM4.0 gives ~1 mm/day RMSE. That is about a third of the global average total precipitation of a meter or so. (The caption gives the GPCP v2.3 data set as the reference for computation of the error.)
https://agupubs.onlinelibrary.wiley.com/doi/full/10.1029/2019MS001829
Actually what Willis’ work shows is that parametrising clouds is fairly simple. All you need to do is put his LOWESS fit into a climate model and hey-presto you have a model that includes all of his supposed thermoregulation.
But none of this analysis is concerned with climate change. All it does is explain how the current climate system responses. What it cannot do is tell you how the system will respond to a change in CO2 levels.
And if this thermoregulation system worked then surely there would not have been a little ice age or a medieval warm period, both of which appear to be articles of faith to people on this webiste.
‘And if this thermoregulation system worked then surely there would not have been a little ice age or a medieval warm period…’
So, are you saying these never happened or that they were caused by changes in our CO2 emissions?
All I am doing is pointing out the contradictions between believing in past climate change (no matter what the cause) and a “thermoregulation system” (again not matter how it works) that keeps the temperature constant.
If you believe in the little ice age then how do you reconcile that with the existence of a “thermoregulatory system”? It would seem that there are two possibilities, either it is too weak to stop such changes or it works on such a long time scale (i.e. over centuries) that only now are we see the effects of it. So which is it?
Alternatively you could believe in the most recent temperature reconstructions that do not show any significant changes in temperature over the last 2000 years since that is exactly what Willis’ theory would predict. So not Roman Warm period, no Medieval Warm period and no little ice age.
Door number three is that you could come to grips with the fact that the Earth’s climate system effectively maintains thermal stasis around whatever set points are dictated by exogenous factors, or combinations thereof, such as orbital mechanics, plate tectonics, galactic cosmic rays, etc. These and other influences allow for climates ranging from hot house to ice house conditions, all of which have been shown to occur independently of CO2 concentration.
If you need further proof, go look in a mirror; if you can see yourself you can take comfort that using fossil fuels hasn’t caused the oceans to either boil off or freeze over.
So how do you know that CO2 isn’t also an exogenous factor that determines the set point? What you appear to be saying is that there is no contradiction between CO2 warming the earth and there being a thermoregulatory mechanism.
Now you need to answer the question is what counts as an “exogenous” fact that can warm the earth and what factors aren’t and which will be countered by a thermoregulatory mechanism?
Izaak, you seem to think that a thermoregulatory system should control temperature with little variation. My oven has such a system. When I set the temp to 350F, the temperature inside increases slowly and maintains it between 345 and 355 depending on the heat capacity of the machine, heat losses, how often I open the door, when I put food in and the temperature and heat capacity of the food. Why do you think that the climate shouldn’t vary a few degrees on either side of a grand average because of all the variable factors Frank from NoVa listed, and perhaps many more.
‘So how do you know that CO2 isn’t also an exogenous factor that determines the set point?’
One could certainly stipulate that, except all the evidence covering time periods ranging from the Pleistocene (ice cores) to the Eocene (deep sea cores) clearly indicates that the variability of CO2 concentration doesn’t affect climate. Lots of to- and fro-ing, doublings and halvings without any impact, aside from those readily attributable to orbital mechanics and/or the opening and closing of sea ways.
All this should clearly makes sense because we know that all the radiant energy CO2 absorbs below the tropopause is lost by collision with other molecules and becomes part of the Earth’s overall black-body radiation field, which is eventually radiated to space across all the TOA black-body wave lengths (h/t Pat Frank).
A more mundane example would be my recent experience with changing out the outdoor condensing unit of my home’s ac system, Once the new unit was in place, the technician only needed to verify that the refrigerant ‘charge’ was set to provide ‘about’ 10 DF of sub-cooling on the liquid line between the condenser coil and its outlet. This is because the TXV on the indoor evaporator coil automatically adjusts the flow of refrigerant through that coil in order ensure that the refrigerant returning to the condenser’s compressor is in the form of a superheated vapor.
The analogy to CO2 is that there is a couple of DF leeway around setting the charge at 10 DF, meaning the system will function (maintain stasis) perfectly under varying conditions of load even if the tech was off a tad. Of course, if I don’t bother to change out the filters or if there is a leak in the system or a restriction anywhere in the line sets or any other number of problems, that’s a different issue.
CO2 plays a 0.68% role regarding retained energy in the atmospheric. That is not much of a control knob
This is but one part of a whole Horatio
Nowhere does Eschenbach claim that the thermoregulation system he proposes “keeps the temperature constant.” In fact he notes that there is warming, in case you missed it.
As my theory would predict, the warming is leading to increased rainfall over the Pacific Warm Pool and around the Intertropical Convergence Zone.
He simply points out that there is an obvious negative feedback mechanism that stabilizes temperatures that “climate scientists” either don’t know about or are loathe to acknowledge, and provides ample evidence of that negative feedback. This contradicts the completely fatuous screeching about imminent “tipping points” and warming spiraling out of control—supposedly caused by increasing CO2—from (so far unobserved and unproven) positive feedback. In fact paleoclimate studies support the theory that negative feedbacks dominate and stabilize global temperatures. CO2 was presumably 5 to 20 times higher in the Jurassic and Cambrian periods and the Earth didn’t become hothouse Venus or anything close to it. Obviously.
And what exactly is the difference between keeping the temperature constant and stabilizing it? Surely if you keep the temperature stable you are also keeping it constant? Or are you saying that CO2 can cause the temperature to rise but only at a constant rate?
As for tipping points, paleoclimate studies have shown that there are several. The start and end of ice ages being obvious ones. The earth shifts abruptly (in geological timescales at least) from one stable state to another.
Similarly how do you explain Dansgaard–Oeschger events that caused the earth to warm by more than 5 degrees over several decades? If nothing else this would be proof that there is no fast acting thermoregulatory mechanism.
You make a good point. Climate models do not handle any of these rapid changes to the climate. They have no way of modelling real climate change, not the little bit we have experienced. The climate models also are based on the idea that the increased temperature caused by CO2 in the atmosphere causes an amplified effect by increasing the moisture content of the troposphere. This has not been observed in satellite or balloon measurements. One explanation is that the increased evaporation rate just made more rain, not a more humid troposphere, which is a corollary of this article.
If you don’t know the difference between “stabilize” (stable) and “constant” you could try looking it up. But you don’t ask in order to understand. You do it to contradict, refusing to understand. Your claim about supposed evidence of “tipping points” in paleoclimate data sidesteps the crucial point I made. Once again, there is no evidence in modern data or paleoclimate data for the tipping points claimed by the climate alarmists. They shriek about an “existential threat” if we surpass some arbitrary warming limit like 1.5 °C above pre-industrial temperatures; that global climate will become unstable (the opposite of “stable” or “stabilize” in case you didn’t notice), and initiate a death spiral of increasing temperatures from positive feedbacks from which Earth cannot recover. The paleoclimate evidence showing much higher CO2 levels and much higher temperatures that never turned Earth into an uninhabitable hothouse refutes their theory, as does Eschenbach’s evidence of dominant negative feedback that stabilizes temperatures within a hospitable range. QED.
“Stabilize” does not equal “constant temperature” in case you’re not clear on that.
So what does it mean?
Izaak, you ask good questions.
Willis clearly (in my opinion) presents a ‘regulatory system’ which limits the effects that a simple increase in energy in the system may have on global temperature.
By a mechanism which the climate models do not include.
It thus seems clear that the touted ‘increase in retained energy due to increasing atmospheric CO2’ must have a far lower effect on temperatures than is modelled.
And none of this means that large sudden peturbations to the global atmosphere, oceans, or landmasses, such as volcanic winters (a likely driver of the Little Ice Age), or huge sudden meltwater releases (a likely driver of the Younger Dryas cooling) will not have a major effect for an extended period of time.
Markx,
Firstly Willis does not present a mechanism for global cooling. What he shows is how energy is transported through the climate system from hot areas to cooler areas. At no point does he discuss the radiation of that energy out into space. So given that the average temperature of the earth is about considerably less than the temperature of the tropics there is a lot of room for the earth to warm before any of his supposed mechanisms could cause a global reduction in the average temperate.
Secondly how do you know that Willis’ mechanisms are not inherently present in climate models? Climate models, model nonlinear systems so inherently can show self-organisation such as periodic oscillations like the El-Nino cycle. And while clouds effects are parameterised in such models Willis’ analysis appears to show that such parameterisation can be done using a LOWESS fitting to CERES data. Now unless you know what the parameterisation used in a global climate model is there is no way of knowing whether or not such effects are included.
Finally what counts as a large sudden perturbation depends on what timescales you are talking about. On a geological timescale doubling the amount of CO2 in the atmosphere in a century counts as a “large sudden perturbation” even if we perceive it as being slow and gradual. So there is no reason not to think that it could not have a major effect for an extended period of time.
Willis was not showing a mechanism for “global cooling”, but instead shows a mechanism for limiting global warming by a very steep increase of heat transfer when sea surface temperature reaches the 25 to 30C range. This is due in large part to the exponential rise in saturation vapor pressure of water with temperature. There is no equivalent thermo-regulatory mechanism to limit cooling, and thus little to prevent occurrences of little ice ages.
If you take a look at the estimated global temperature for the last million years or so is glacial periods start relatively abruptly, with no hard limit how low temperatures can go. On the other hand, the maximum temperatures during interglacials appear to be hitting a hard limit on warm the earth can get. Willis has shown a very plausible mechanism for why the maximum temperatures are limited.
In about 1990 before the Hocket Stink showed up, the consensus was that climate variations in the past 5000 years were In a 1 degree C. range.
+/- 0.5 Degrees C. versus 1990. THAT ESTIMATE IS ROUGH, BASED ON AN AVERAGE OF LOCAL PROXIES.
THE MARGIN OF ERROR FOR PROXY ESTIMATES IS very LIKELY LARGER THAN 0.5 DEGREES C., SO THE VARIATIONS ARE STATISTICALLY INIGNIFICANT.
If it was true that warm periods were really averaging +0.5 degrees C. warmer than 1990. then the +0.7 degree C. warming since 1990 would make 2023 warmer than any warm period in the past 5000 years.
ANECDOTES TELL US THERE WERE COLDER AND WARMER CENTURIES AND NO REASON FOR PEOPLE TO LIE ABOUT THAT.
The average temperature has been relatively well controlled in the past 10,000 years. It is true that the warming rate after 1975 is a faster warming rate than almost all 50 year periods in the ice core era. That suggests, but does not prove, that manmade warming amplified a natural warming trend after 1975.
You don’t know that, no one knows that since proxies don’t have that accuracy of absolute temperature.
The temperatures you are relying on are anomalies, i.e., ΔT, the rate of change. There is no temperature record from 10,000 years ago. The ΔT’s could all be based on an absolute temperature several degrees cooler or warmer than now. There is no way to know.
Because there is no accurate way to judge absolute temperatures, you cannot discuss “temperatures” being warmer or colder than now.
All you can say scientifically is that there might be a difference in the rate of change.
I believe you should be looking at the real earth temperatures over 2,000 years. Not Fahrenheit, not Celsius but in degrees Kelvin. About as flat a line as your going to get.
When you do, you’ll also ask yourself, “What keeps it so steady?”. Willis did just that years ago.
An interesting question, but don’t forget that the incoming solar flux, changing on its own and per the Earth’s orbital cycles, seem to be the main factor influencing the Earth’s temperature. The water-cycle control system maintains a certain setpoint for a given incoming flux and geological state (continental position, etc)
IW, I just had to respond to your nonsense. WE takes on temperature at the scale of decades. You criticize him for natural variation on the scale of centuries.
You tried but failed to confound the two. Pathetic.
Rud,
if a thermoregulatory system controls temperature variations on the scale of decades then it must also control temperature variation on the scale of centuries since a century is composed of decades. How did such a system fail to stop the earth warming after the little ice age? That happened decade after decade. And if each decade was meant to have a temperature control mechanism then there is no way the earth could have warmed across multiple decades.
Erik Magnuson already gave you a good explanation. This system does not necessarily limit cooling. It does limit warming to a certain extent.
Add that to the fact that Willis’s explanation deals mainly with the oceans rather than land temperatures limits. Since the earth is mostly water, oceans are a good place to start.
Here are some words from Mototaka Nakamura. He was a climate researcher and knows the models well. His book is available on Kindle for a very nominal fee.
And, this admission about climate models.
IW> I had a very expensive laboratory incubator that had a thermo-regulator (PID type) that controlled the temperature to +/- 0.5 C. It also had a knob that changes the setpoint in the range of 25 to 100 C. Set point and regulation are two different functions.
Thanks, Izaak. As you might have imagined, I considered this very question. Over a decade ago. See Slow Drift in Thermoregulated Systems.
Regards,
w.
Mr. E: Mr. Walton “might” have imagined it, he seems to have quite an imagination. He might also be playing whak-a-mole with us, waiting to tag AlanJ in. Thanks for ending the game so politely.
It happens a little earlier in the day?
It can do no more than “never” or “flat out”. If one were to move us further from the Sun then I wouldn’t kick in at all. Nearer and it would be continuous and more vigorous. But that is all it can do.
The shallow depression between 7degC and 20degC means the planet really wants to ice age in terms of cloud-based cooling.
As the temperature drops below 20degC, there’s more cooling, which means it’ll get colder as it cools (positive feedback), until the temperature hits about 7degC and colder makes it cool less.
There’s something external to the cloud processes preventing us from going into an ice age, because the cloud feedback really wants us to be in an ice age.
Contrariwise, runaway global warming is impossible, the cooling effect above 25degC is a massively steep slope.
whoa, I didn’t look this up until after I made the graph
https://news.ucar.edu/132755/scientists-nail-down-average-temperature-last-ice-age#:~:text=A%20team%20of%20scientists%20has,Fahrenheit%20(8%20degrees%20Celsius).
The control of the earth climate system is obviously NOT thermostatic. It is energy static. Calling a radiative energy imbalance “forcing” is the start of a deliberate attempt to create a bogus pseudo science language to divert those with some competence in phsyics from understanding the self evident reality of the Earth energy system’s big picture. How does Earth achieve, then maintain, an energy balance in space?
Energy in must equal energy out, at WHATEVER SST this requires, to create the various different negative feedback contributions to remove solar radiative energy and maintain the energy balance at the interface with space. That’s it.
Because much of this feedback (163W/m^2) is transported from the surface, within the Earth system’s internal atmosphere, the different responses to a warming through radiative imbalance have different sensitivities in terms of ultimate radiative loss to space per deg SST.
It’s a little complicated. But not very.
Viewed at the macro level of energy balance, which we measure so know, the small effects of perturbations to natural GHE by more CO2, amplification included, are easily rebalanced by the dominant negative/cooling feedbacks of many Watts/m^2 per deg K, so in a fraction of a degree change in SST. The IPCC’s ECS estimates are simple and overt nonsense when reviewed against the actual feedbacks available to the whole Earth control system, at the levels we are discussing here.
And temperatures are never static, and are controlled by enrgy balance, not CO2, which is not significant in relative scale.
SST MUST change continuously to maintain the planet’s energy balance. Whether caused by changing solar input or changes in the atmosphere, the SST MUST change to re balance the system.
It’s really not hard to understand, if you get your head out of the modellers’ rabbit holes and irrelevant detail of other people’s limited concepts and specialisation, to consider the joined up reality of the whole Earth energy system in space.
The pale BLUE dot’s blue bits have our climate backs. They are the dominant driver of the sensitive SST response to any energy imbalance, however caused. And create the small changes we do measure.
To answer the question about short term solar related or long term orbital cycles, The long term changes are doozies. The orbital eccentricity is +/- 13% radiative change, +/- 44W/m^2 if I have that right…. the Laskar cycles of precession are also 100W/m^2 in range. Things would get very interesting if the SSTs could not change to maintain Earth’s energy balance over such ranges. Which they clearly can and do. For 500Ma within 14 deg K.
Which is why the REAL negative feedback of the whole Earth energy control system is probably > 10W/m^2 per deg K. So even 100W/m^s of solar change due to eccentricity or precession can be rebalanced by 10 degrees worth of the extant natural feedbacks Earth has available from its oceans and S-B radiative effects, oh, and the net negative cloud albedo/surface warming feedback.
Hence the SST change on the Pale Blue Dot is limited to only a few degrees in 300 K over 500Ma
This is a highly stable system, heavily fed back.
How could anyone suggest it is unstable and easily unbalanced when science KNOWS it isn’t? Once such a dumb statement is ridiculed by a wall of verifiable facts, the only credible question is “how does it do that?”
And that is obvious to ANY competent competent engineer familiar with the principles of control systems who is allowed to stand back from the whole system and study the simple feedbacks that science has measured to be capable of delivering the observed and lasting balance of the whole Earth system in space.
CONSIDER: Start having the right argument? IMO it is better to simply dismiss GCMs, which are so ridiculously presumptive so hopelessly flawed, and prefer to account for the natural reality, using what we know because we have measured it, and proven the basic phsyics we apply.
Deny their whole fraudulent pseudo science approach with reality, its false “facts” and its phoney language, all created to deceive, not explain the truth. Better to use plain science language to present the quite different and real system we have measured and KNOW, than what is made up in models that are provably hopeless at predicting anything, because they are wrong. Based on presumptions we can prove to be false from the first claims.
Present the empirical model using the numbers that are real and regular science. Deny the lies of charlatans with facts we measure, and they don’t?
Arguing irrelevant details down deceitful rabbit holes, created by scientific inadequates to avoid such scrutiny, was always designed to distract those who can ask questions into the wrong arguments and hence from the simple, obvious, measureable, extant realities, the natural physical absolutes of .. The Pale Blue Dot.
we already know from direct observation of TOA how the system responds to CO2 levels
a small greenhouse effect is observable in clear areas, but overall cloud cover changes dominate the radiative balance
CO2 enthusiasts will stretch themselves into knots to tell you the larger effect is somehow a function of the smaller, but this is obviously unphysical
the maximum possible climate response to CO2 is limited by TOA observations to something on the order of a half-degree of warming per doubling, or around a tenth of what the IPCC claims
https://judithcurry.com/2021/10/10/radiative-energy-flux-variations-from-2000-2020/
“The climate models can’t do clouds well”
Irrelevant
The climate models are programmed to scare people. They make no attempt at accurate forecasts. The Russian INM may be the one exception.
That’s why I call them Climate Confuser Games.
The estimated ECR of CO2 keeps increasing even though it was likely already too high in the late 1970s.
Natural causes of climate change have been marginalized since1988.
It is also an unproven theory that long term climate trends can be predicted (no matter how “good” the models are).
This reminds me of how old style vacuum diffusion pumps work. You can get the same effect if you switch your kitchen faucet to spray. You can get quite a wind from that.
I had the impression that clouds were nearly impossible to measure and that most calculations were based on assumptions of impact. The article implies a more certain one. Any input on that?
I know there is a distinction between rainfall which can be measured and cloud cover which is not. Does this not imply a guesstimate?
You can see clouds quite clearly from satellites. Something of a nuisance in fact if you’re actually interested in visual or ir information from the surface. Try this site https://www.nhc.noaa.gov/gtwo.php for a display of near current cloud cover over Eastern North America and much of the Atlantic basin. However, I’m not sure if/how well rainfall can be determined from space. Someone else may know more.
Excellent work Willis. This needs to be widely circulated. Could you please make a pdf report available?
Hang on …
OK, try this.
To read it, click on the “Download” icon at top right.
Then click “Just continue with download” at the very bottom.
w.
Thanks Willis.
Thank you Willis.
Willis has really contributed, once again via his data analysis, to increasing our knowledge level surrounding tropical weather phenomena and the apparent 30 C ocean max temperature.
Where other think they might have heard unicorn flatulence, Willis comes up with the numbers.
A downvote ? WTH ?
Only surface available energy will evaporate water. Thus, surface evaporation buffers only the absorbed Solar beam. Oceanic surface evaporation is energy limited, meaning it is sensitive only to the amount of sunlight absorbed into the mixed layer. Assuming unlimited moisture, it is the duration and intensity of the solar beam that controls evaporation. For an oceanic thermoregulatory evaporative mechanism to initiate, more solar must also be absorbed. This necessarily promotes an Earth Energy Imbalance until a new equilibrium cloud cover is established; with a higher GMST. In conclusion, in response to any forcing, a hypothetical thermoregulatory oceanic evaporative mechanism can only initiate by an increase to steady-state solar absorbed.
Yes, you hit the biggest factor but I don’t think we can ignore other components of the evaporation analysis. Downwelling LWIR also will enhance evaporation. Any kind of pollution vs pure water will reduce evaporation. While these are much smaller variables, they do have an effect.
From first principles: at the surface-air interface, entropy production must be positive for the vaporization. Picture the heat (and mass) becoming more spatially distributed upon vaporization; some taken from surface and delivered to air. That is the entropy production of vaporization. Entropy production is maximized when the air becomes saturated with moisture. A huge amount of work is involved and this flux of mass and heat, which degrades to higher entropy upon the vaporization.
To accommodate the entropy production of vaporization, there must be a thermodynamic disequilibrium between incoming photons and the surface, else there is no entropy budget available. Generally speaking, Earth surface and air adjacent are practically in thermodynamic equilibrium, and no work could be generated from the ambient LWIR for this flux of mass and heat. One way to consider this is that the ambient photons flying around are distributed across the same wavelengths; i.e. they have already been shifted into a higher entropy state. For them crashing into the surface could not produce work or drive a vaporization.
In order for vaporization to occur there must be entropy production and therefore a thermodynamic disequilibrium. From an Earth system perspective, the sun represents THE energy source of very low entropy, as the sun is in thermodynamic disequilibrium with the thermal conditions of the Earth system. From this disequilibrium, work is derived which sustains the dynamics of Earth system processes and subsequently dissipated and
degraded to the higher entropy ambient condition.
One simply cannot derive the work (transfer and mass and heat) involved in vaporization from the ambient LWIR. The entire thermodynamic study of the Earth is related to how much work can be derived from solar forcing. If more work is required to initiate a planetary thermoregulatory evaporative mechanism, it can only be achieved by increasing insolation onto the surface.
Take an period of steady sunlight, say one hour duration. Put out something that is quite wet, say a cotton towel on a cloths line. It is easy to observe, especially in milder temperatures, that drying proceeds much faster with a good breeze than without, no sunlight change necessary.
The planetary wind field is conserved at a physical limit set by the solar forcing. The fundamental constraints and planetary limits are what make the study of climate distinct from internal weather variation. One simply cannot invoke a thermoregulatory mechanistic change without acknowledging that the system is already operating at its thermodynamic limit.
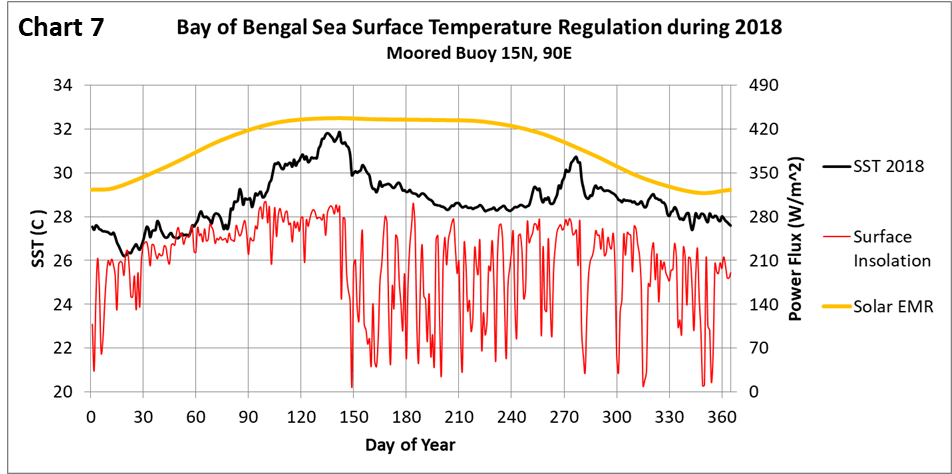
The regulating process is cyclic. It is driven by convective instability. The regulating limit is the result of the most powerful convective towers and the persistence of the associated clouds. When the 30C limit is reached, the surface heat flux is zero. The ITCZ is not static. It moves with the seasons. It takes around 20 to 30 days for the cyclic process to set in. It usually results in some overshot in surface temperature as seen here between day 105 and 135:
 ?ssl=1
The increasing peak sunlight in the NH has warmed the NH land and oceans. The most noticeable shift in regulating cloud formation is just north of the Equator:
 ?ssl=1
The chart also shows the negative feedback of the cloud but the ratio of SWR increase to OLR reduction understates the power because the warm pools move with the seasons.
The extent of NH September warm pools is increasing at 2.5% per decade so a relatively rapid change due to the shift in solar intensity. More of the NH ocean surface is reaching the regulating limit. The March 30C area in the SH is almost constant.
Notice planetary solar absorbed must increase to drive enhanced convective instability in local profiles. The instability is not limited by surface temperature per se, but by the difference between surface temperature and the outgoing radiating temperature. A thermodynamic limit is reached when the temperature difference between surface and outgoing radiating temperature exceeds 45C, expressed as a peak turbulent flux of 150 W/m2. For a 303K surface, the minimum cloud top temperature to reach the limit is approximately 258K.
West coast South Island New Zealand has falling rainfall trend and a reduced evaporative cooling.
It could explain some of the glacial retreat in that region.
Fantastic work and answers a lot about regional advection.
I think John Clausen would agree with Willis that the IPCC has underestimated cloud feedback. From his recent Clintel presentation:
‘The IPCC’s 2021 AR6 report (p.978) claims that climate stabilizing natural feedback mechanisms have a net (total) stabilizing strength of -1.16 ÷ 0.6 W/m/K. My cloud feedback mechanism has a net stabilizing strength of anywhere between -5.7 to -12.7 W/m/K, depending of one’s assumptions regarding the albedo of clouds.’
I was disappointed he didn’t seem to be aware of Willis’ thermostat hypothesis.
Indeed. But cloud feedback is a big topic for climate research, notwithstanding the Alarmists belief that the ‘science is settled’.
What I think is novel about Clausen’s approach is that he purports to show that the IPCC has blown the calculation for clouds’ contribution to albedo. If this is born out, it’s lights out for Team Alarmism. I use the term ‘purported’ because Clausen’s presentation itself is (how should I say this) very difficult to follow.
Apparently, someone (SEPP?) is working on a transcript of the video, which is available at the link below. Part II is where he specifically gets into clouds if you’re interested.
Willis,
You will never become accepted by the climate research community while you persist in using the best data you can!
/sarc
I have no problem with the general view that clouds/rain provide an strong influence on the surface temperature of Earth. However, I don’t believe this feedback mechanism is a significant factor in the current climate changes we have been seeing.
I don’t believe this is true. The solar aspect is true, but the enhanced greenhouse effect is based mainly on decreases in OLR, not downwelling IR. They believe the effective radiation altitude increases which causes the change.
CO2 based DWIR does not warm the surface of Earth because it originates within the atmospheric boundary layer. This layer and the surface are constantly exchanging energy due to conduction as they are trying to reach equilibrium. The change in DWIR energy from increased CO2 simply changes the balance sheet in the conducted energy slightly. A little more energy conducts back into the atmosphere.
You do however get a little bit more evaporative cooling. That’s right, DWIR at the surface is a cooling forcing caused by increases in CO2.
“the enhanced greenhouse effect is based mainly on decreases in OLR, not downwelling IR”.
That is the theory but i read that OLR has in fact increased which falsifies it. I cant remember the source. It might even be on this platform in a previous article..
I can assist you with that, bally.
w.
The idea that OLR having increased falsifies the GHG hypothesis is interesting. If solar input is roughly constant, as per the climate models, then increasing GHG interception of OLR should return some as ILR which should increase surface OLR until TOA OLR reaches the exact same value that it had before. So on the face of it, yes it does invalidate the GHG hypothesis. But unfortunately, that part of the GHG hypothesis doesn’t work, so they had to multiply the GHG effect in the models by 3, using spurious feedbacks. The spurious cloud feedback in particular complicates things a lot. The fact is that clouds explain the increasing OLR, but because the models have a spurious cloud feedback, they too can be (mis)portrayed as causing TOA OLR increase. I suspect that if someone did all the numbers the GHG hypothesis would still be disproved, but it does require more work.
The modelers are very much aware that observations and the models themselves don’t agree with the ‘canonical’ mechanism for CO2-forced greenhouse warming:
From Donohoe et al [PNAS, 2014]
‘The greenhouse effect is well-established. Increased concentrations of greenhouse gases, such as CO2, reduce the amount of outgoing longwave radiation (OLR) to space; thus, energy accumulates in the climate system, and the planet warms. However, climate models forced with CO2 reveal that global energy accumulation is, instead, primarily caused by an increase in absorbed solar radiation (ASR). This study resolves this apparent paradox. The solution is in the climate feedbacks that increase ASR with warming—the moistening of the atmosphere and the reduction of snow and sea ice cover. Observations and model simulations suggest that even though global warming is set into motion by greenhouse gases that reduce OLR, it is ultimately sustained by the climate feedbacks that enhance ASR. ‘greenhouse effect is well-established. Increased concen-
trations of greenhouse gases, such as CO
https://www.pnas.org/doi/10.1073/pnas.1412190111
If you’re comfortable that this doesn’t smack of special pleading, please let me know.
Yes, it has increased but so has solar energy reaching the surface. This makes the analysis more difficult because at constant CO2 an increase in solar energy should increase OLR. It allows them to argue the reason for the increase was solar energy and it would have increased more without CO2.
Deleted
Bubble points are hard to argue with.
“Now, the yellow line in Figure 3 ” 3 paragraphs from the bottom. I think you meant figure 5. Story tip. Always like your articles.
Thanks, fixed. I hate typos.
Glad you like my writing.
w.
I know I am swimming upstream, but precision is necessary in mathematics and science in order to facilitate communications with maximum signal to noise ratios.
I abhor the use of “forcing function,” “heat trapping,” and “positive feedback” abused by climatologists in an effort to create the perception they know what they are talking about.
I also firmly believe when talking: energy is in joules (J) and power is in watts (W). Just as another item I disagree with, the use of W/m^2 in describing every aspect of atmospheric and oceanic energy flows. W/m^2 is the field strength of an electromagnetic field.
When talking about energy, take the W/m^2 and multiply it by the area (m^2) and the number of seconds. 1 J = 1 W-s.
Anyway, my rant is done.
Energy flow can described in a variety of ways, amongst them the W/m2 used here. Since “flow” is a temporal parameter time is included with the term for power, and thus it describes the flow of energy with time as a function of area. We use it in many fields of engineering, of which electromagnetics is but one.
In my understanding “electromagnetic field strength” is described as V/m.
W/m^ does not include time, therefore it is not energy flow.
V/m is also used in electromagnetics. One versus the other is application dependent. When doing skin depth penetration calculations, V/m is commonly used. When doing link margin analysis, W/m^2 is more useful.
Did you read my mind?
A force is measured in Newtons, not Watts per square meter!
Using the non-SI unit Watt-hours instead of Joules is pervasive, but leads to seemingly endless errors of mistakes such as confusing MWh (energy) and MW (power).
W/m^2 or (J/s)/m^2 is energy flow/second through an area, or flux
Only if you have poor eyesight or can’t read scientific stuff properly. In atomic physics we use eV, not Joules.
More proof the earth’s weather (and associated long term climate) are driven the the thermal engine that is our home.
30 C for ocean temps is interesting- we see the same thing here in the NE Caribbean- once the ocean hits 30C , it rarely gets much warmer
Strange. I thought the UN Secretary General stated last summer that the ocean was no longer warm but now boiling! If not in the Caribbean, then where? Oh, yeah, off the coast of Florida. Close. Although they never actually showed any boiling water. He may not know the definition of boiling. Maybe someone showed him an ocean of pentene.
As I recall it, he mistook a shallow, muddy pool of everglade water near the coast for the ocean. It wasn’t boiling, of course, but it is a place where the water often gets very warm from sunlight being absorbed by all the mineral and organic material in the water and because there is very little circulation through it. Pure alarmist propaganda.
A hot spring in Yellowstone Park?
That guy should be put in jail, for inane, unscientific scare-mongering
No. Put him in the Hot Spring.
Away from the serious science it is worth saying that the The UN Secretaries general are self evidently pantomime fools, ignorant, delusional, drivelling demonstrable nonsense, or they know they’re lying.
An absolute disgrace to the office and the organisation that once had such great ideals, to end wars and relieve emergencies, which it barely tries to do now, because becoming a Marxist World Government on behalf of the globalist elites is a lot easier, and employs a huge bureaucracy of pointless 3rd World grifters.
But that’s not “science”…..so I will try to create some pseudo science as they do, the Catt Curve in economic “science”. (They make it up in models, so that’s OK. No reality required, bill the client before the facts are gathered to prove it wrong).
So: Left wing bureaucracy expands linearly to absorb all the wealth generated by value adding population in the private sector that is not “saved” by controlling elite capitalists and banks. The surplus created by those that actually do the work to add value to resources using human innovation is taxed to absorb it all to fund more bureaucarcy, to mange laws that are good for people, as far as is possible without public order breakdown. THis totally regressive bureaucracy include ALL government outside of front line roles, and ALL unaccountable monopoly agencies, QANGOs and pointless University pseudo science departments, any such bodies which add no value to the people forced to pay for them. And sociologists.
Climate “scientists” figure highly in this group, supporting a specially created pseudo science created to falsely justify the largest ever fiscal fraud enacted by law on the productive people’s of the West, short of a World War.
Any good?
That is because evaporation is very high
Look up the curve
On the 30 Limit……
I had already given this some thought, because it is a well-known “Mystery”.
I propose that when the 303 deg degree ocean SST is reached during interglacials, there is a surplus of heat to be lost in the tropics, where 50% of the solar energy is deposited, perhaps because the dominant evaporative loss of heat from the ocean surface can no longer function, because the atmosphere is saturated with water vapour – 100% humidity at 30% deg C.
Under such conditions. The oceans must find way to relieve the energy imbalance so carry the surplus heat to the north and south in the extant currents, and the atmosphere can also move latent heat in saturated water vapour North and South, BUT latent heat as released in cloud formation goes to space, so simply cools the Earth, it doesn’t warm its extremities, mostly.
And the atmosphere itself has little heat capacity of significance compared to the ocean..
This transfer of excess energy towards the Poles could explain why the more extreme latitudes of the northern and southern hemispheres experienced subtropical climate during the Eemian period, when they were hippopotami in the Rhine and the Thames at 50 deg North, and in fact further north, and there was no ice on Greenland.
nb:The cause was almost certainly the cyclic maximums of all three Milankovitch cycles occurring in phase/at the same time 130Ka BP. Which gave a doozy of an interglacial, as we say in science. Go to “Ludicrous heat…..”, Captain Sanders.
So I suggest saturated vapour pressure conditions being reached over the tropical oceans at 30 deg C is the causal limit, but my water vapour thermodynamics is not advanced. Is this rubbish?
As with my above explanation of the whole Earth energy balance, and the dominant regulation of that whole system balance makes clear, nature will always try to balance imbalances, between points on Earth’s surface, and between Earth and space, so, once the tropics can no longer balance themselves, the heat must flow to somewhere colder, by all means possible. Oh gosh, what will the Pllar Bears all do? Survive fine, perhaps turn a bit browner, get a bear tan?
Simples! How’s that? That is my theory, which is mine….. Any weathermen about to comment? As Bob Dylan might have said, “You don’t need a Weatherman to know which way the heat flows”, (you need Maxwell…. but hey… 😉 ) Where is Mr Bastardi?
What do others think?
PS All I know for now is that saturated vapour pressure at 30 deg is c.42mBar, and that seems to be about the daily max number at the equator….. So above that it must stop evaporating into the atmosphere? But then the water would get hotter, so the increased temperature gradient versus cooler waters perhaps create stronger heat transfer away from the Tropics. Whatever….
I suppose that’s the same saturation as fog/MIst/whatever at 10 deg, say… so 12mBar:
https://www.hamiltoncompany.com/process-analytics/dissolved-oxygen-knowledge/considerations-for-oxygen-measurement/saturated-vapor-pressure?
30 deg, not 303. We’re not Venus yet. Even if Antonio thinks so. He is such a total moron he’s unbelievable, literally. Which is good for the truth. Even Joe public can see this man is a drivelling idiot, on what little science they do know.
Question. What is the humidity when that happens? My bet is it has reached saturated vapour pressure, sthe strongest cooling has ceased to work and some other transfer in the ocean kicks in to move the energy elsewhere, to where its cooler, conduction or advection…..
“rather than cursing the storm, learn to dance in the rain”
zap,pow!
seriously, Izaak has an interesting point. Would changes in incoming solar flux be sufficient to change the “setpoint” of this regulation system? Or must there be something else?
See above on the control of the whole Earth system energy balance.
The setpoint is the energy balance, so energy in (the Sun’s) equals energy out, the Outgoing LWIR returned to space. The SST that does this is not a fixed value, it’s whatever it has to be to maintain thermal equilibrium with space, whether the perturbations to the system are external or internal. It’s a natural balance. CO2 is never a control in this system. In any accurate description of the whole Earth enrgy balance system.
But YES, it is a multivariate control system that manages the energy balance, which requires a changing energy flux setpoint IF solar energy changes.
But NOT if the change is in the internal atmospheric energy transfer function, by CO2, and the solar energy stays the same, obs.
nb: It gets more complicated with extreme events that also reflect or obstruct incoming solar enrgy, beyond the radiation balance, when we must consider total incident solar energy balance, some of which is reflected, and atmospheric reflection can also change, Willis’s clouds, and the feedback copes with that as well..
Those excepted….
Effects like CO2 GHE anomaly need a change in SST to maintain the same energy balance, by modifying the energy radiated by the surface, mainly the ocean surface by evaporation. Which also brings more clouds which adds reflective albedo control to that radiative control…. simples :-)….
CO2 change makes a small and increasingly smaller per ppm contribution to the creation of change in the atmospheric energy transfer system, and has NOTHING to do with controlling the energy balance, which it simply perturbs, and that perturbation is rebalanced by the dominant controls (evaporation and S-B effect for sure, plus some cloud feedback TBD) that generate the necessary radiative change to re-balance the perturbation to the energy system that CO2 increase has caused. In a fraction of a degree as regards 1.6W/m^2 effects of AGW to date. Not a problem. The rest of the change must be natural. I believe this truth to be self evident……….
Hope I said that clearly enough….
“CO2 has theoretically increased downwelling radiation by something on the order of 1.4 W/m2 … and that would be totally undone by a mere 1.4% increase in cloud cooling.”. The IPCC agrees with you.
“ Clouds, which cover about 60% of the Earth’s surface, are responsible for up to two thirds of the planetary albedo, which is about 30%. An albedo decrease of only 1%, bringing the Earth’s albedo from 30% to 29%, would cause an increase in the black-body radiative equilibrium temperature of about 1°C, a highly significant value, roughly equivalent to the direct radiative effect of a doubling of the atmospheric CO2 concentration.”
from the IPCC report AR4 1.5.2
The Figure 1 rainfall map is very interesting. The southern tropical Atlantic between Brazil and Africa is remarkably dry as is the southern tropical Pacific off the coast of South America almost all the way to the middle of the Pacific. In fact the areas with lower rainfall take up a lot of the world. And I didn’t know just how much rain falls in the northern tropical Atlantic and Pacific and north of Australia. That’s a lot of water.
I am indebted to Willis Eschenbach every time he produces these fascinating statistical insights into What Nature Does for Us.
As chaotically hidden from our view as most electric storms may be they are a part of a system that regulates hot and cold energy clashes in a way that puts to shame our tiny contribution to “natural” carbon dioxide in the our Planet Water’s atmosphere. There are huge amounts of energy in every single storm, enough to provide electricity to meet our needs for decades to come if only we could find ways to harness it.
We occupy but a tiny fraction of the thirty percent land cover of our planet and yet there is a school of lunacy that believes we can challenge and change the power of nature by burning fossil fuel to keep us warm, safe and in better living conditions than before.
Nature habitually puts us in our places and it is about time we recognised the challenges as part of our learning curve and not a reason to cover the face of the planet with PV panels and wind turbines just because they seem a green [sic] and easy way to capture Nature’s power when we may come to realise they may be much more damaging to Nature’s Health than ever burning fossil fuel was.
We need to get real and stop believing we are so clever and virtuous when we are plainly not. Nature may not know our word efficiency but She certainly teaches us a lot about it if only we’d pay attention.
I would like to know how any changes in the cooling effects of clouds could be measure accurately
I know there is a rough estimate of the percentage of cloudiness. It is claimed that percentage declined 7% on recent decades. But that decline is likely to be too small to be statistically significant
The cooling effect of clouds depends on more than the percentage of cloudiness.
Most important are the
Types of clouds
Height of clouds
Timing of clouds
Clouds at night would have a different effect than clous during the day
So please explain how the amount of solar energy blocked by clouds can be accurately measured
And how would the warming effect of less SO2 air pollution be differentiated from the effect of changes in cloudiness?
There is a broad consensus that a warming surface leads to the negative feedbacks of higher OLR and more evaporation.
But more evaporation also means a water vapor positive feedback.
The data for global average absolute humidity is weak. Lower altitudes have poor measurements.
So far there seems to be a rise of absolute humidity from 1980 to 2000, which supports the water vapor positive feedback theory. But a flat trend after 2000, which is puzzling. Also puzzling is the decline of relative humidity after 1980
Global effects of clouds and absolute water vapor and severely hindered by poor quality data.
That’s why I am always suspicious of theories that require accurate measurements of the effects of cloud changes and/or absolute humidity changes.
Very interesting insights. I could not help noticing that the highly temperature sensitive range of 26-30 degrees C surface sea temperature in figure 5 is the same range found for almost all reef building corals. They are brilliantly adapted to be able to survive the rapid changes that occur.
Figure 5 ??
Thanks, Dan, fixed.
w.
“It takes ~ 80 watts per square meter (W/m2) of radiation over a one year period to evaporate one meter of seawater.”
Is the 80 watts a cumulative number over a year? Or is the 80 watts of forcing continuously applied (on average)
Am I correct in assuming that all the forcings reported are instantaneously observed (on average)?
It’s 80 W/m2 of forcing continuously applied for a year.
And yes, you’re correct.
w.
And 1 meter is the average rainfall over the planet and 80 watts or thereabouts is usually the latent heat or evapo-transpiration number given on Trenberth style energy budget charts.
Interesting number… I make the heat to evaporate 1 cubic metre/1 tonne of water to be 2.26TJ. And 80W/m^2 for a year to be 2.52 TJ. Not a number I have done before.
So yes, “circa”.
And that’s the amount of rain that comes back down? Quel Surprise!
And 86.4W/m^2 is also the amount of LWIR that condensation releases to space …. Interesting…… roughly….