From Dr. Roy Spencer’s Global Warming Blog
by Roy W. Spencer, Ph. D.
The Version 6 global average lower tropospheric temperature (LT) anomaly for February, 2024 was +0.93 deg. C departure from the 1991-2020 mean, up from the January, 2024 anomaly of +0.86 deg. C, and equaling the record high monthly anomaly of +0.93 deg. C set in October, 2023.

The linear warming trend since January, 1979 remains at +0.15 C/decade (+0.13 C/decade over the global-averaged oceans, and +0.20 C/decade over global-averaged land).
A new monthly record high temperature was set in February for the global-average ocean, +0.91 deg. C.
The following table lists various regional LT departures from the 30-year (1991-2020) average for the last 14 months (record highs are in red):
| YEAR | MO | GLOBE | NHEM. | SHEM. | TROPIC | USA48 | ARCTIC | AUST |
| 2023 | Jan | -0.04 | +0.05 | -0.13 | -0.38 | +0.12 | -0.12 | -0.50 |
| 2023 | Feb | +0.09 | +0.17 | +0.00 | -0.10 | +0.68 | -0.24 | -0.11 |
| 2023 | Mar | +0.20 | +0.24 | +0.17 | -0.13 | -1.43 | +0.17 | +0.40 |
| 2023 | Apr | +0.18 | +0.11 | +0.26 | -0.03 | -0.37 | +0.53 | +0.21 |
| 2023 | May | +0.37 | +0.30 | +0.44 | +0.40 | +0.57 | +0.66 | -0.09 |
| 2023 | June | +0.38 | +0.47 | +0.29 | +0.55 | -0.35 | +0.45 | +0.07 |
| 2023 | July | +0.64 | +0.73 | +0.56 | +0.88 | +0.53 | +0.91 | +1.44 |
| 2023 | Aug | +0.70 | +0.88 | +0.51 | +0.86 | +0.94 | +1.54 | +1.25 |
| 2023 | Sep | +0.90 | +0.94 | +0.86 | +0.93 | +0.40 | +1.13 | +1.17 |
| 2023 | Oct | +0.93 | +1.02 | +0.83 | +1.00 | +0.99 | +0.92 | +0.63 |
| 2023 | Nov | +0.91 | +1.01 | +0.82 | +1.03 | +0.65 | +1.16 | +0.42 |
| 2023 | Dec | +0.83 | +0.93 | +0.73 | +1.08 | +1.26 | +0.26 | +0.85 |
| 2024 | Jan | +0.86 | +1.06 | +0.66 | +1.27 | -0.05 | +0.40 | +1.18 |
| 2024 | Feb | +0.93 | +1.03 | +0.83 | +1.24 | +1.36 | +0.88 | +1.07 |
The full UAH Global Temperature Report, along with the LT global gridpoint anomaly image for February, 2024, and a more detailed analysis by John Christy, should be available within the next several days here.
The monthly anomalies for various regions for the four deep layers we monitor from satellites will be available in the next several days:
Lower Troposphere:
http://vortex.nsstc.uah.edu/data/msu/v6.0/tlt/uahncdc_lt_6.0.txt
Mid-Troposphere:
http://vortex.nsstc.uah.edu/data/msu/v6.0/tmt/uahncdc_mt_6.0.txt
Tropopause:
http://vortex.nsstc.uah.edu/data/msu/v6.0/ttp/uahncdc_tp_6.0.txt
Lower Stratosphere:
/vortex.nsstc.uah.edu/data/msu/v6.0/tls/uahncdc_ls_6.0.txt
Warmer IS better !
This marks 9 months in a row, where the monthly record has been broken. In this case the record for February was broken by more than 0.2°C.
The top ten warmest Februaries are now
2018, and 2023 are tied with 2003 for tenth place.
Before 2023, February 2016 was the highest anomaly of all months. March 2016 was the second highest at 0.65C. Now February 2016 is only the 7th highest anomaly.
Of the top ten highest anomalies, 8 where made in the last year.
I don’t think record breakers are the best way to assess warming, but it’s pretty clear it has been unusually warm in the last 8 months.
So what?
It is what it is.
Big El Niño going on. No surprise there.
It is surprising to many on WUWT had predicted that the warming had ended.
The warming could have ended, and the global temperature could have just spiked in the midst of this termination.
That is an interesting way to spin it. In the spirit of sticking to that theme we could call it a temporary period of negative cooling.
Or it could be long-term. The future is not written.
Long term negative cooling. It has a good ring to it.
Your response shows that you are ignorant of climate dynamics. Just because there’s a warming trend doesn’t mean it’s playing a never-ending game of warming. The climate is unpredictable and chaotic. Anything is capable of happening in the future.
Let me get this straight. Article authors and commenters alike predict that the warming has stopped over and over again. I (along with others) warned WUWT that new records were coming sooner rather than later. Then now that those records have occurred you insinuate that it somehow it confirms all of those predictions that it stopped. And I’m ignorant?
Nice subtle goal post move. Nobody said anything about never-ending warming. My comment above is about those who said the warming had ended.
Well it was certainly unpredictable for those who predicted that the warming had ended.
Nobody should attempt to make predictions; it will get warmer until it gets colder. Especially, a transient event like this makes it hard to discern where we really are as far as warming or cooling. I’ll bring up the fact, again, that Earth’s climate is dynamic; you can never rule out anything when it comes to deterministic chaos. Those predictions of cooling from the past decade could still be verified; imagine a scenario where the 2014-2024 period is just a temporary 10-year blip where the globe’s temperature remains elevated for whatever reason. Three years later, the globe resumes its cooling. Again, this is hypothetical, but it’s just the point I’m emphasizing about deterministic chaos. It has no set time; whatever happens just happens.
You made a prediction below.
Perhaps you can try to explain that to those who ruled out warming.
You’re just ignoring my main point.
I’m assuming your main point was “The warming could have ended, and the global temperature could have just spiked in the midst of this termination.” If that isn’t your main point then now would be a good time to clarify it.
My main point is that the future is always uncertain, and what we know is only what we think we know.
If by uncertain you mean unknowable then I disagree. If by uncertain you mean without perfection I agree. But we don’t need perfection to make testable predictions (like that the warming will continue) of the future.
What does chaotic and nonlinear mean to you? You can predict the time when the next drop of water will fall. And you can even test your prediction. If you predict and time it to the nearest nanosecond, how many times will it take for you to get it correct. What if you timed it to the nearest 10e-12?
Exactly.
“I (along with others) warned WUWT that new records were coming sooner rather than later.”
How very prescient of you, given that these records were assisted by an El Nino together with an unforeseeable underwater volcano? Or were you just banking on someone putting their thumb on the temperature scales somewhere, or somehow cooking the books? Given that the temperature datasets are so messed up anything really is possible, except cooling of course – that’s been taken care of.
He seems to revel in the illusion that he’s making a profound point by resurrecting past predictions, as if they carry any weight.
It’s both amusing and pitiful to witness his complete disregard for the concept of deterministic chaos. Nothing says that the globe’s temperature can’t just fall off a cliff in the future.
First…they do carry weight since it is a form of hypothesis testing.
Second…my point was that those who had predicted that the warming stopped are probably surprised by the warming. Nothing more.
First…I’m not disregarding anything.
Second…the fact that there elements of the climate system that are chaotic especially on shorter time scales does not preclude someone from predicting climatic changes especially longer time scales.
Third…you seem annoyed at me because people on WUWT 1) made predictions and 2) that didn’t pan out. Why not direct your annoyance toward them?
Sure. We could get hit by comet tomorrow hurling the Earth into new era of glacial expansion. Is it likely…no. So unless there is some cataclysmic event the atmosphere is going to continue warm at least in the near term. And just so there is no confusion…by “continue to warm” I mean with ebbs and flows involving considerable variability.
The spike event is likely to be transient until proven otherwise. It happened over the course of 5 months. That is weather, not climate. It’s incredibly illogical to use that as some sort of proof to claim that global warming is still continuing, or accelerating, etc.
Of course not. I did it myself, but I also said I would not bet on it due to deterministic chaos.
We don’t know that. Once again, I’d like to remind you that the warming could have stopped 5, 10, 25 years ago, and we could very well be cooling right now without even knowing it. Climate, according to mainstream science, is weather over a long period of time. Just ~10 years ago, we were in what many would call the Pause. Who’s to say we’re not in some short-lived elevated blip, only to return to the Pause in the future? Ten years is a blink of an eye in geologic time, as is the average human lifetime.
Yes. As I’ve been trying to explain to everyone here. ENSO is the predominant driver of short-term variability in the UAH TLT values. It is very likely that the temperature is going to drop as we transition into the next La Nina. That doesn’t mean global warming has stopped though. It just means that it has paused.
Just to be clear here…I’m using the spike as proof that predictions that global warming had stopped didn’t pan out. The spike doesn’t mean it’s going to continue. It only means that if it stopped it stopped at the peak of the spike. And I’ve said nothing about acceleration.
FWIW…I use the planetary energy imbalance as the primary line of evidence that global warming will continue.
Yes we do. It’s an inevitability based on the 1st and 2nd laws of thermodynamics. Ein > Eout therefore ΔE > 0. And since we know that energy has a tendency to disperse the imbalance will eventually get dispatched to the atmosphere. This is why I know that the 0.93 C UAH TLT value isn’t the peak. It may take another 15 years (or it may happen in March…I don’t know) but that imbalance will eventually result in a new record once again…eventually.
The atmosphere may be cooling right now. But the climate system as a whole is not. We know that because we observe the planetary energy imbalance to be positive.
We’ve always in pause. Literally, every single month in the UAH record has been in an extended pause. Some months even have the distinction of being in two separate pauses.
We are in short-lived blip. That’s what ENSO does. And as I’ve said repeatedly in these UAH monthly updates it is very likely we are already in the next pause period. That’s what happens when you superimpose short-term variability on a long-term trend.
El Niño is a factor, but it is not the only factor. It’s probably not even the dominant factor. The globe’s anomaly spiked by 0.38°C from June to July last year. That is too soon to reflect changing ENSO influence, so the origin of this change must be due to another anomalous cause. Thus, you are mistaken when using the current spike to prove that warming is continuing, even if, as you say, it won’t go any higher.
As Jim Gorman notes, you appear to lack knowledge about what chaotic and non-linear really are.
Solar energy absorption, ocean circulation patterns affecting changes in cloud cover, and changing albedo mean that Earth’s energy imbalance will vary through time.
Energy is not uniformly distributed throughout the planet, and how energy is transferred between different components, like the atmosphere or the cryosphere, are complex. Given how long Earth has existed in a stable state with ideal conditions for life, it’s very likely that the feedbacks in the system are mostly negative, which means that warming will be counteracted.
As such, a positive energy imbalance and the dispersion of energy doesn’t guarantee a warmer outcome.
Agreed. But everytime I try to explain to the WUWT that the GAT is driven by more than one factor it is met significant resistance.
The data says it is the dominant factor short time scales. The general rule is about 0.15 C per ONI value with a lag of about 4-5 months.
The ONI went from -1.0 to +2.0. That is 3.0 * 0.15 C = 0.45 C of expected movement. Strong El Nino (like what we recently saw) often result in higher augmentation values than the typical 0.15 C/ONI value. We also happen to be experiencing a period where we are at a high point in the solar cycle, volcanic aerosol forcing is low, and anthropogenic aerosol forcing is low which are almost certainly augmenting the ENSO push.
I’m not saying that it is “continuing” at least not from the recent spike. I’m saying it didn’t stop like what people here had predicted earlier. I’m saying that because the global average temperature is higher now than when they made those predictions. In fact, the temperature is currently at its highest value in the UAH record.
I didn’t say that. In fact I said the exact opposite in no certain terms. It WILL go higher…eventually.
The Gorman’s also challenge laws of physics and make numerous algebra mistakes in their posts so the appeal to authority (or faux authority) isn’t very convincing to me.
Agreed. And it goes far beyond chaotic and non-linear system. I lack some kind of knowledge in every discipline of science. And every time I gain a new insight I’m reminded of how little I actually know.
Yep.
That’s a bold statement.
Yes it does. All bodies have a finite specific heat capacity. The Earth and its atmosphere are no different. That positive energy imbalance will (without any equivocation whatsoever) cause the planet to warm further. The warming may have paused in the atmosphere for now, but it has not stopped. The 2024/02 value of 0.93 C will get eclipsed…eventually.
Okay, let’s do that calculation real quick. The peak of the La Niña last year was -0.04°C in January. -0.04 + 0.45 = 0.41°C. We’d still have an unexplained warming of 0.52°C.
Your claim that strong El Niños ‘often result in higher augmentation values isn’t very strong. The 2016 high barely topped the 1998 high, despite it being a little stronger. I don’t see very much augmentation there, and anthropogenic aerosol forcing that you mentioned was there and stronger in 2016 than in 1998.
Every ENSO phase will be different from each other, even if they are identical in ONI value. This is due to the external variables you mentioned; however, you failed to mention that external variables can also dampen the value.
Again, not true. Earth’s energy imbalance has been positive before; that didn’t stop it from turning negative during the switch from an interglacial to a glacial state.
It might be easier to explain if I just show you my model. My expectation was for UAH TLT to peak as high 0.92 C. We’re at 0.93 C so it’s only barely above the expectation. What is most notable is that the spike had an earlier onset than I was expecting. My hypothesis is that this is due to the rapid reduction in anthropogenic aerosols in the last 3 years which my model does not currently incorporate. I plan on adding it as a 5th variable soon.
Internal variables dampen the response too. It is the net effect of everything working simultaneously that matters the most. For example, a large eruption simultaneous with an El Nino can essentially dampen the perceived effect of both since they cancel. An example of this is the Pinatubo eruption which occurred as ENSO was transitioning into a strong El Nino.
I assure you…the 1LOT and 2LOT are true. With the current imbalance at around +1.5 W/m2 and a conservative e-fold time of 20 years we have least 40 years of warming still baked in and that’s assuming the imbalance isn’t getting supported by additional radiative forcing. And remember the switch from interglacial to glacial eras takes about 75000+ years to play out.
I was banking on the 1LOT and 2LOT being right.
Monckton felt it was good enough that conclusion could be drawn.
I read most of Monckton of Brenchley’s posts and we obviously recollect his conclusions somewhat differently. To my recollection, I believe the biggest clue was in the title referencing ‘the pause’ – as in a temporary halting of warming with the implication that it would likely carry on. Or perhaps you define the word ‘pause’ differently than the rest of the English-speaking world?
I define pause as a temporary halting of warming too. Monkton concluded that global warming had paused from the UAH dataset. If Monckton had believed that UAH was so messed up that anything was possible then he wouldn’t have described the period from 2010 to 2023 a pause.
Or you be truthful and say that it is just part of a totally natural El Nino event.
But you, being a “climate cultist” will want to try to spin some other BS.
Weather is unpredictable. Temperatures may stay roughly the same, go up or go down and who can predict what will happen.
Seasonal weather is predictable but the extent of the changes are not predictable. The super El Nino has not occurred. The summer rain fall in Queensland Australia is close to average or above average rather than less than average predicted from the predicted El Nino. I have some doubts about the Australian temperature in the UAH result for February. There was rain close to everyday which results in overcast and lower sunlight and lower daylight temperatures. However, night temperatures were above average due to heat release by condensation. CO2 has nothing to do with temperatures or changes in SOI or IPO.
Ya know, bfgwx, I am never certain you are grounded in reality.
I have been posting here since 2011. Don’t recall anyone ever saying warming has ended after LIA reversal. Do recall many saying various pauses refute climate model monotonic warming increases. Do recall many saying warming is about half of modeled. Do not recall any saying warming from LIA (multicenntenial natural variation) has stopped.
Maybe you are projecting or hallucinating?
Do you not remember Don Easterbrook claiming that ocean cycles meant we were headed towards a period of prolonged cooling? Or David Archibald saying the same thing but because it is all due to solar influences?
I do.
In spite of the uncertainties, there are many strange claims made on this blog. Sometime they are entertaining, sometimes they are irritating. More than a few people have their own unique ideas of that is going on.
“More than a few people have their own unique ideas of what is going on.”
That’s because there is a lot going on in Earth’s atmosphere besides CO2 increases. Lots of things could be affecting Earth’s weather. So far, CO2 appears to be a minor player in the Earth’s atmosphere.
Alarmists want to equate CO2 increases with temperature increases, but that could just be a coincidence.
After the Little Ice Age ended, it warmed just as much in the past as it has today, and the past warmings were not accompanied by increasing levels of CO2, so something other than CO2 caused those warmings. If something other than CO2 caused those warmings, then the same thing could be causing the current warming.
If the temperature trend turns down, then the climate alarmists will have lost the argument.
This warming phase is getting rather long in the tooth.
I’m not saying the majority but many people have quite different, and often enough contradictory ideas about specific aspects of weather and other areas of study such as physics, chemistry, and geology. This is not difficult to discern from reading comments and even from the articles themselves. Some make sense, as least as far as being internally consistent, some do not.
I also remember many comments telling David Archibald in particular he was wrong in what he claimed, including people who were (no longer post here) and are sceptical of man’s contribution.
I remember that, too.
He stall made the ridiculous claims and they were still publicised unquestioningly on this site. So there are people at WUWT who have predicted an end to warming. Many, in fact.
“all due to solar influences”
Do you have any evidence at all that nearly all the warming IS NOT from solar ??
True, he may have missed a bit of sub-ocean volcanic activity, but there is no evidence that the vast majority of the warming is NOT from the Sun.
You have agreed several times that all the warming in the UAH data is totally natural with no human causation.
The majority of evidence points to CO2 warming, SO2 related warming, UHI warming, other economic growth related warming and deliberate adjustments of temperature measurements to create fake warming — all part of AGW.
There is more evidence of sunlight reaching Earth’s surface. Lower SO2 pollution would do that.
The effect of clouds is unknown
Solar energy at the top of the atmosphere has not increased since the 1970s per NASA satellite data.
The stratosphere is colling — evidence of greenhouse warming
Antarctica is getting colder and not melting — more evidence of greenhouse warming
Warming is mainly TMIN — evidence of greenhouse warming and UHI warming
Colder nations except Antarctica are warming more than tropical nations
There are twice as many TMIN records set than TMAX records
There are measurements of increasing longwave downwelling radiation.
The evidence for manmade warming is stronger than the evidence for natural warming since 1975 but the correct answer is no one knows .. and the bottom line is that warming is good news.
The effects of CO2 are also unknown.
That’s a question best directed to Mr Archibald, who made the famously failed forecast.
I wrote the climate would get warmer, unless it got colder. But there was no respect for the best climate prediction in world history.
That was my prediction from 1997.
In 2010 I predicted a US invasion by aliens. And that happened. Aliens from South America and Latin America mainly. … I had predicted aliens from the planet Uranus, which I view as a half right prediction
In 1996 I predicted humans would become less intelligent over the next 30 years and that, unfortunately, appears to be coming true.
Yeah, but you alarmists, bdgwx in this case, are insinuating that “many” people here at WUWT have said the warming has stopped.
That’s just not true. Most of us can read a temperature chart.
The difference between alarmists and skeptics is alamists think the warming trend will go on forever, as long as CO2 increases, whereas skeptics say there is no evidence this will happen.
Saying temperatures remain flat while CO2 increases is not saying a cooling trend is taking over, it just says there does not seem to be a correlation between the warmth and the amounts of CO2. CO2 increases daily, the temperatures show a flat trend with the exception of El Nino years.
I’m not just insinuating it. I’m flat out saying it.
I beg to differ. And these examples aren’t just random people. They are respected enough that WUWT allows them to post entire articles.
No doubt; but many of you are very selective about the start and end dates on those temperature charts. They tend to shift a lot. By that I mean on a monthly basis.
As new monthly data come in, fresh thrashing of trends takes place to find the latest longest period of zero trend. The previous zero trend start month is rapidly abandoned if it now shows a warming trend and a new month takes its place.
No scientific forecast I have ever seen suggests that CO2 and temperatures are expected to rise in lock-step, month-by month. Natural forcings are much to strong for that to happen.
There will always be short-term periods of zero trend, even in a strongly warming climate system.
The ‘gold standard’, as I understand it, is the 30-year trend. Look to the running 30-year trend in all global climate data sets and you will get a good indication of the general direction of change (or no change).
And we may yet be – a short sharp spike in warming doesn’t invalidate cooling in the future, especially given the appalling state of most temperature datasets.
The good news is that global warming (i.e., the 1977-1998 warming) is over
The planet is no longer warming
the Modern Warm Period is over, that global warming is definitely over, dead and buried
And although only a commenter this one is interesting since it was posted a mere 27 days before the 2016 peak was topped.
This is as high as it will go. 2016 peak will not be topped.
Opinion comment with zero charts or data from a MIKE.
Post from Archibald a coolist who isn’t taken seriously as he wets his pants over every short cooling trend thinking this is the one!!!
Easterbrook prediction of a cooling trend on THREE past trends, he is fairly close on the 1945-1977 trend-based prediction and over all warming trend to year 2100.
You are not doing well here.
“You are not doing well here.”
Rud said
“Don’t recall anyone ever saying warming has ended after LIA reversal.”
bdgwx produced 3 published WUWT articles saying just that.
Warming certainly STOPPED for long periods of time.
Only El Nino events have broken the NON-WARMING periods which cover some 35 years of the last 45 years of UAH data.
So depending when those comments were made, they were most probably correct.
Just another petty meaningless comment from Nick… that FAILED completely.
Really you can’t be slow as NONE of them disputes the warming trend since the LIA ended.
Deflection and diversion. Nobody said anything about disputing the warming trend since the LIA ended. What I said is “It is surprising to many on WUWT had predicted that the warming had ended.” and I stand by that statement and even provided examples of respected article authors doing just that.
David Archibald was taken seriously enough that WUWT has published several articles he wrote.
First…that’s just patently false.
Second…that article isn’t written by Easterbrook.
BTW…what’s Andy May’s excuse?
You didn’t read the chart well since his cooling trend was short and small then it gets warmer than now up to year 2100 based on the 1945-1977 trend line.
Is this a joke or are you trying to gaslight me? I ask because his 2100 prediction based on the “1945-1977 cooling” trajectory is literally 0.5 C below where it is now.
The first three comments were totally correct at the time. You FAIL !
You have shown that nobody can predict how much warming will come at an El Nino event.
Bbbbuttt, you just don’t get it! Mr. Istvan has his recollections!!
And it’s not like those predictions are from random nobodies. It almost defies credulity that anyone could insinuate that there aren’t people who participate on this platform who predicted that warming stopped.
BTW…I didn’t include predictions from Monckton in my post above since he didn’t actually say warming had stopped. But since his monthly pause updates go hand-in-hand with the UAH updates it’s probably worth mentioning. Back in 2013 he published a prediction that the global average temperature would decline by 0.5 C by 2020. It never happened.
Or maybe he knows how the datasets are fixed?
You’re saying UAH is fixed now, too?
So you agree that it is purely from the El Nino event.
Do you have any evidence at all of any human causation??
El Nino Nutter strikes again
The ENSO cycle is temperature neutral in the long run unless you are biased and completely ignore the La Nina cooling periods.
Which you do.
There is no atmosphere warming during La-Nina phases.
Isn’t it surprising that all the $ (trillions?) spent on ethanol fuel, solar cells, EV’s, wind turbines, has done NET ZERO to the keeling curve. Isn’t this the definition of insanity?
Not surprising at all
EVs are a tiny percentage of the total auto fleet in the world
The upfront CO2 footprint for manufacturing / mining to construct EVs. windmills and solar panels should increase the CO2 growth rate for many years before any CO2 reductions begin
Also, almost 7 billion people live in nations that could not care less about Nut Zero, out of 8 billion.
“EVs are a tiny percentage of the total auto fleet in the world”
You should have mentioned that when you were trumpeting the fact that “EV sales have increased by 69 percent, year over year!”.
We shouldn’t forget that ‘traditional biomass’ produces three times the global energy than all the windmills and solar panels in the world. Way to go eh?
David, I wanted to post to let you know I’m not ignoring you. I don’t typically engage in policy discussions because I’m not well versed on it nor am I interested in it.
Thanks for the reply.
It’s the policies the create the passions on the subject.
Otherwise this would just be a discussion of the weather… I have no interest in that.
When you’re eating bugs in the cold and dark it will be too late to become well versed in it.
If you don’t believe that can happen, you must have missed the pandemic.
I see this has been beaten to death, but I find it rather humorous.
If anything WUWT is a luke-warmer blog. Anthony, Charles, Willis, Rud and many others follow that view. As a result, the number of people claiming the warming has ended is minimal. IIRC Anthony specifically banned at least one commenter of the sky dragon mentality.
And yet here we have alarmist central trying to claim WUWT is full of people claiming the warming has ended. The abject stupidity of this comment is mind bending.
Who said it had ended. The monthly Chart above has been updated and shown for many months here. Right underneath it, it says:
“The linear warming trend since January, 1979 remains at +0.15 C/decade (+0.13 C/decade over the global-averaged oceans, and +0.20 C/decade over global-averaged land).”
Got that? warming trend. REMAINS at….
“Big El Niño going on. No surprise there.”
I partially agree. It’s not a surprise that as the world keeps warming, comparable El Niños will keep breaking records. They are adding the same size spike onto an increasing base value.
On the other hand, I think this one hand been surprising in it’s timing and effect. Whether this warm spike can be attributed entirely to this El Niño, or other factors will I suspect be argued over for some time.
So why is a warming world a bad thing? You’ll agree it’s not a particularly warm phase in Earth’s climate history?
So what exactly are the problems going to be and why should i be concerned?
Another glaciation will make most of the Northern Hemisphere uninhabitable or marginal whereas warming and increased CO2 seem to be greening large areas.
Please explain your concerns
Great to see you gradually waking up to the fact that El Ninos, charged mostly by Solar energy (not by CO2 is any possible way) are the cause of the warming in the satellite temperature era.
Each major El Nino spike is accompanied by a small step change.
There is no scientific way CO2 can do this.. just AGW mantra science FICTION.
An El Nino Nutter baloney sammich
If solar energy was the primary cause of post 1975 warming, the stratosphere would be getting warmer rather than cooler
And most new surface temperature records would be TMAX, rather than TMIN records
And the Arctic would be warming in the summer months rather than during the dark winter months.
There is an underlying warming trend from CO2 increases and SO2 reductions
The El Ninos temporarily spike the underlying trend and the La Ninas temporarily flatten the underlying trend. So what?
ENSO cycles have existed during cooling periods and warming periods in past centuries There is no correlation with the global average temperature trend in the long run. Except to the dumb El Nino Nutters.
“There is an underlying warming trend from CO2 increases and SO2 reductions”
He says, with no evidence provided.
What caused the similar warmings into the 1880’s and the 1930’s? Neither CO2 or SO2 were a factor during those warmings.
Weather history is our friend.
This is a strong assertion; I’d like to see your evidence.
He doesn’t have any evidence because there is none..
His claims are what are described as unsubstantiated assertions.
That’s about all we get with alarmist climate science.
Typical science free comment from Richard.
The problem is we know from physics why CO2 doesn’t produce warming. We know from volcanic eruptions that only when SO2 is injected into the stratosphere from equatorial eruptions do we see any kind of cooling effect.
The oceans are the elephant of the climate system and the atmosphere is the tail. Multiple factors influence the oceans. Clouds, sun, orbital variations, volcanoes and possibly human pollution. Too bad climate science isn’t studying the things that actually affect the climate.
That’s the point at which we diverge – you think there is an underlying anthropogenic warming signal that is amplified by El Nino’s whereas others think there is no underlying warming signal just El Nino’s. I’m somewhere in the middle, but dispute the anthropogenic nature of the underlying warming.
I think there’s an underlying trend. I think it’s probably caused by increasing CO2, but regardless of the cause it’s absurd to say it doesn’t exist, or is in some way caused by El Niños.
It wasn’t a “big El Niño”; it was moderate. Much smaller than 1998 and 2016.
Why would you expect new temperature records to be set every time there is an El Niño? It’s obviously caused by the underlying warming trend.
Even a moderate El Niño is enough now days to set new monthly warmest global temperature records.
Again, refusal to look at the FACTS.
Enough energy released to heat the whole troposphere by nearly 1C in 6 months.
Try not to be ignorant all you life.
Why would you expect it NOT to warm up when absorbed solar energy is still increasing !!
So you agree that the current warming is not just the result of the El Nino. Your graph doesn’t show a correlation between absorbed solar energy and El Nino.
If anything the correlation goes the other way. More clouds usually seen during El Nino. That’s why we are so much warmer now.
The Hunga Tonga eruption did, in all probability, magnify the effects of the El Nino, though, so both you and TFN may be right, in part.
It’s too bad this chart hasn’t been highlighted in a thread of its own on WUWT. The clear correlation between the increase in ASR and the HTE completely explain why the current El Nino has been warmer.
Why the big reduction in clouds? Is it the water vapor or the Chlorine? Or something else? If we don’t know the specific cause then we can’t know if/when it will end. And, if it doesn’t end, the warmth will continue after the El Nino fades away.
I would check out this paper, suggests the increase in ASR could be due to the recent reduction in SO2 emissions.
https://www.columbia.edu/~jeh1/mailings/2024/AnnualT2023.2024.01.12.pdf
You’re definitely a troll.
So you’re just now realizing that?
I guess it depends which ENSO dataset you’re using.
For ONI (V5) I see :
The “biggest” El Ninos are 1983, 1997/8 and 2015/6
The “second tier” are 1987, 1991/2, 2009/10 and 2023/4 …
The latest peak doesn’t look that “much smaller” than 1997/8 and 2015/6 to me.
_ _ _ _ _ _
Honest questions looking for honest answers (/ opinions) … which I do not currently possess.
1) How much of the latest “peak” is due to “the long-term CO2 trend” ?
2) How much looks like TLT is being “driven” (mainly) by ENSO ?
3a) Is it possible that the Hunga-Tonga eruption, the last red asterisk, might have had some sort of “latent multiplier effect” ?
3b) An effect that was only “triggered” after ENSO (/ONI) rose above some unknown (and maybe even unknowable) “threshold” again ???
So far, the current El Niño is less strong than those of 97/98 and 15/16 and it does not appear to be getting stronger. Yet the current global temperature rises well above those of 97/98 and 15/16Yay Februaries!!!
The satellite record represents about 0.000001% of earth’s existence.
And that’s the part that’s most important to us.
I actually watch the weather on a regular basis, often multiple times a day as it determines how I plan my day, especially for exercise. I got a nice bike ride in today and it was warm enough that I could wear shorts and get some sunshine.
I’m hoping that that snow storm in the mountains tonight drops a nice amount of snow but not so much that roads and resorts will be closed, as is happening now in the Sierras.
I heard that it’s 10 feet of snow in the Nevada-California mountains. It doesn’t sound like the end of snow–but I could be wrong.
“the end of snow”
Once it has all fallen… That’s it.
ALL GONE. !! 🙁
If it is then you are going to fail miserably. If you cannot look at past climates and atmospheric behaviour, before the satellite data, and extrapolate behaviour from that to help look at current behaviour then all the satellites will give you is a meaningless string of numbers. Have fun playing with your numbers but you won’t find any answers there.
Funny, I don’t recall you mentioning that when Lord M was in his pomp talking about “7-years no warming in UAH”
Maybe you did bring it up and I just missed it?
Poor fungal.. foot in mouth again.
You have just admitted that the short time period of the current “slightly warm period” is basically insignificant.
That’s basically my point. In addition, sea level is lower and it’s cooler now than much of the past 10,000 years.
Sea level might have been higher and the average temperature warmer during portions of th Holocene Climate Optimum that lasted from 5000 to 9000 years ago.
A reasonable estimate is that at least 8000 years of the past 10000 years were NOT warmer than today, and possibly no centuries were warmer than 2023
Much of the past 10000 years was not warmer than 2023 except in your overactive imagination
“and possibly no centuries were warmer than 2023”
Pure, wild, ridiculous speculation.
The dinosaurs lived in a cooler climate than we have now? Farming in Greenland took place in cooler temperatures than we have now? Grapes were grown in England in cooler temperatures than we have now? Tree stumps found under glaciers means they grew when it was cooler than it is today?
All of those periods had to be warmer than today for those things to have happened.
Logic is our friend.
Dinosaurs did not live during the last 10000 years, more grapes grown in England and Wales than previously.
Actually, that’s a funny thing – dinosaurs never actually died out, they evolved as all animals do but are still here today. All birds are dinosaurs.
Grapes were grown at higher latitudes than today during the MWP in England.
The population of the country is at least 10 times what is was then.
Not so, the furthest north was in Northamptonshire whereas currently they’re grown in Yorkshire and Wales.
There are two contemporary reports of vineyards in North Yorkshire in the 1300’s.
Care to give a reference?
Interesting.
During the LIA then.
Agree, but<1 degree warmer isn’t significant. Here at Central Coast Cali, for the past 3 months, it’s about 5F cooler, wetter and windier and that is significant, one day per week at the golf course instead of 3 or 4. Global cooling! i hate it.
The Tahoe resorts are all closed today but it’s not for lack of snow.
There has been a LOT of energy released by this El Nino, hasn’t there. !
There is no scientific explanation for CO2 or human anything, causing temperature spikes like this.
Fun factoid. The ‘only’ thing that can warm the oceans is SWR solar incoming. Any IR GHE backscattering cannot penetrate ocean surface, so at most could cause mild immediate surface evaporation, so cools rather than warms. So the ocean heat being released by an El Niño trade wind reversal is NOT CO2 originated.
The simple fact that Pacific El Niño/La Niña still regularly occur despite Mauna Loa steadily rising CO2 is a qualitative observational proof.
Fun factoid: everybody already knows this. No one is claiming that downwelling LWR is directly warming the oceans.
It warms the ocean skin layer; the top few micrometres. That is enough to slow the rate at which oceans loose heat. Slower rate of heat loss, more ocean retention of heat = increased ocean heat content.
SWR is still the force putting heat into the oceans; LWR is influencing the rate at which that heat can be dissipated.
Again .. Scientific NONSENSE for start to finish.
Warming the ocean surface with LWR aids evaporation.. which COOLS the ocean surface. This has been actually proven by measurements. Same as evaporation COOLS a canvas water bag.
The only heat getting into the oceans is from the SUN and probably some sub-ocean volcanic activity.
CO2 has absolutely ZERO effect on how heat can dissipate.. that is just AGW-cult mantra based on science fiction.
Yet sea surface temperatures are at their highest on record, so…?
You are commenting from IGNORANCE, yet again.. or .. as always.
Absorbed solar energy still increasing….
Ocean temperatures are still FAR cooler than most of the last 10,000 years, barely a fraction of a degree above their coldest period only a coupe of hundred years ago.
The SUN…. is the dominant cause of energy buildup in the waters yet is mostly just in the first 100 meters that has most of the energy which is why it periodically undergo a big outflow.
It can’t be CO2 causing the ocean to warm. You said so yourself.
The SSTs have been increasing since the depth of the LIA. This started BEFORE we started to see the rise in CO2 levels.
It is the oceans doing the warming. You have cause and effect backwards.
Your logic sucks.
LWIR makes the surface hot enough to stop warmer water from evaporation.
How does LWIR make the surface just warm enough to prevent evaporation so the warmer water stays in the ocean?
Greenhouse gases do not warm
They keep some heat from escaping by deflecting some upwelling radiation back down
If more energy arrives via radiation in the top millimeter of the ocean it slows down the cooling.
Increasing CO2 concentrations in the atmosphere leads to increasing air temperatures and warming of the oceans.
Your so called science is baloney
Nope, this is counter to known physics. Well, unknown to you but still well known physics.
Where did that energy come from? Let’s see, per HITRAN 99.94% came out of the atmosphere within the first 10 meters of the surface.
What did that do to the atmosphere? Oh yeah, it cooled.
Does that cooler atmosphere touch the water which is absorbing that energy? Yup.
What happens when a cooler object is in contact with a warmer one? The 2LOT tells us that energy will flow from the warmer object to the cooler one. We usually refer to this as conduction.
So you see, the energy is simply conducted back into the atmosphere from where it originated. No surface warming occurs. However, if the energy instead caused evaporation, then energy will be removed from the water. AKA a cooling effect.
“There has been a LOT of energy released by this El Nino, hasn’t there. !”
Has there? IO wonder why that might be. Have the oceans been getting warmer since the previous El Niños?
3 La Nino in a row is certainly a chance to put more heat into the Pacific warm pool.
Yes.
Not an unusual amount. Much less that 1997-98 and 2015-16.
Yet global temperature records are falling like ten-pins.
It’s almost as if there’s an underlying warming trend; but what can it be?
Again, total BS, based on deliberate ignorance.
There has been enough energy released to warm the whole atmosphere by nearly a whole degree in just 6 months.
Why do you continue to DENY this fact, despite the data showing exactly that.
There is no “underlying atmospheric temperature trend”… that is your AGW-cult brain-washed mantra talking…
Just warming from the El Nino events.
36 out of the 45 year of atmospheric data are basically zero trend periods.
This FACT has been shown to you before.
Stop DENYING facts just to push your mindless AGW-cultism.
Here’s the NOAA ENSO Index data.
This was not a big El Nino compared to many others, including recent ones (1998 and 2016, for example).
ENSO doesn’t explain the underlying warming.
That just shows that ENSO – along with most other aspects of the climate system (or should I say the weather system) – is ill-understood.
The poor muppet thinks the ENSO is a measure of how much energy is released by the El Nino.
It is basically gormlessly ignorant of anything to do with climate.
I repeat… because the fungus has very little brain and cannot comprehend even basic FACTS.
There has been enough energy released to warm the whole atmosphere by nearly a whole degree in just 6 months.
That is what the UAH data shows.
None of his petty whinging can change that fact.
And the fungus still hasn’t given any evidence of human causation, so we can all assume it is well aware that the EL Nino is a totally natural occurance.
He doesn’t show good critical thinking skills which is why he never improves even when you post that CERES chart in front of him several times, he ignored it to make another empty reply instead.
You mean the chart that shows the current hot spell is not all due to the El Nino?
The warming of the oceans may not have been due to El Nino, but you can’t say for sure the release of that energy wasn’t.
OTOH, I personally don’t believe the ocean warming we have seen for at least 50 years is due to El Nino. It’s not due to GHGs either.
The cause is likely the same as seen in previous warm periods (HCO, Egyptian, Minoan, Roman and Medieval). However, humans may be increasing the amount of warming with our microplastic pollution.
It’s almost like something else was happening, you mean, then you make a wild guess at some underlying warming trend whilst ignoring the dirty great explosion throwing goodly amounts of seawater into the atmosphere. Hmm, intriguing.
CO2 definitely does not cause spikes
But the ENSO cycle is temperature is neutral in the long run
So you are half right, which is unusually good for you.
“but it’s pretty clear it has been unusually warm in the last 8 months”..
That’s the thing, it’s only been eight months. Not even a year yet. The question is why this particular El Niño caused such a strange spike. Maybe it has something to do with the unusually long La Niña the preceded it, who knows.
No one
Says the person who was so confident that they made this bold prediction.
It certainly hasn’t been warm in Central and East Asia recently. China has suffered an extremely cold Winter this year.
My guess is that the El Nino circulation is keeping the arctic air confined to the continent of Asia and away from the United States and Europe.
The U.S./Europe side of the hemisphere is experiencing near record warmth from mild air flows off the Pacific and Atlantic oceans, due to the El Nino circulation, while on the opposite side of the globe they are experiencing near record lows.
The Asian continent, except along the coast, does not have the mitigating factor of mild air coming off an ocean.
It hasn’t been unusually warm in my neck of the woods. The temperatures are near the records for around here, but that just tells us that similar temperatures were experienced in the past. We survived those temperatures (easily) and then the temperatures cooled for a few decades.
I would expect the same thing to happen now as happened in the past.
The Earth’s climate is cyclical. It warms for a few decades and then it cools for a few decades, and then it repeats, with about a 2.0C spread between the hottest temperatures and the coolest temperatures. We have had two and one-half climate cycles since the end of the Little Ice Age with temperature highpoints in the 1880’s and the 1930’s, both of which were equal to the temperatures today.
What comes next? If CO2 is not the control knob of the Earth’s atmosphere, and I don’t think it is, then we should expect a few decades of cooling coming in the future. Just like what happened after the last two temperature highpoints.
Here’s a visual for you, the U.S. regional temperature chart (Hansen 1999) that shows the temperature swings over the years. Keep in mind that 1998 and 2016 are statistically tied for the warmest year in the satellite era. Hansen said 1934 was 0.5C warmer than 1998, which would make it warmer than any current temperature. The United States has been in a temperature downtrend since the 1930’s even though CO2 has increased during that time. No unprecedented warming here. No indication CO2 has any effect here:
Check out the CERES data graph showing absorbed solar energy posted by bnice2000. That explains why the warming has been more significant.
1) What conclusions do you draw from this, as to what it means?
2) What conclusions do you draw from this, regarding policy?
Not just Bellman, the others too.
1) I don’t. I’ll leave that to all the experts. I have some wild speculations.
2) Again, I know nothing about policy. The main conclusion I draw is not to put any faith in short term trends. So many keep falling for all the “pauses” and hope the warming has gone away. At present I see no reason to suppose this represents an acceleration in warming. What effect it will have on policy I couldn’t say – global politics is pretty mad at the moment.
A reasonable position. But its not addressing the really difficult question we all face, those of us living in democracies, which is policy.
In the real world, global emissions will probably hit 45 billion tons or higher by 2040. In the real world the fastest growing and largest emitters will not cut back, in fact they will simply grow their economies and let emissions go where they will as a corollary. Most of the emissions will be due to coal, less but still substantial due to oil.
So the really difficult policy question for people who believe in CAGW is what you think a safe level of emissions is in 2040. How you think that could be achieved, both in terms of who, which countries, emits what, and in terms of what kind of energy is used and for what.
And you have to answer the most difficult question of all for climate activists in the English speaking countries and Germany. What do you think these countries should do, given that no-one else is going to reduce and that 45 billion tons global emissions are inevitable no matter what they do?
“What do you think these countries should do, given that no-one else is going to reduce and that 45 billion tons global emissions are inevitable no matter what they do?”
That’s the question.
What Western nation should do is stop their Net Zero efforts. Net Zero will only bankrupt those with that goal while making absolutely no difference to world CO2 levels.
The way to justify stopping Net Zero is for policy makers to delve deeply into CO2 science and they will see that it is made up solely of speculation, assumptions and unsubstantiated assertions.
There is no evidence CO2 is doing what climate alarmists claim it is doing.
Policy makers should stop implementing Net Zero because the CO2/atmosphere science is NOT settled. Not even close. Not close enough to ruin a nation’s economy over.
Wake up and smell the coffee, Policy Makers. You have us headed down the wrong road. It is time to change course and reject Net Zero as impossible to attain, and because there is no science legitimately supporting reducing CO2 levels. It’s all speculation, assumptions and unsubstantiated assertions. Not something to base one’s future on.
A start in the right direction would be to carbon tariff all products we buy from those lands. The proceeds should then be sent directly, quickly, totally to every US resident, after paying the current ~$45/carbon ton for legit 45q sequestration projects. The tax rate might adjust with better data, but we already have that 45q starting rate. The carbon requirement for those products can be relatively easily calculated with current info.
If you think that this is politically impossible due to inexorable tobacco tax type honey potting, well, got me there…
And yet you put your faith in temperature datasets that show warming in implausible hundredth’s of a degree, that are purely politically motivated and used to drive those poicies that you claim to ignore. You are blinkered to the point of near-blindness.
I don’t put that much faith in UAH – but it’s the only one people here are supposed to trust. It shows over 0.6°C warming so far – that’s 60 hundredths of a degree if you prefer.
Are you claiming that Spencer and Christie are politically motivated to downplay the amount of warming in UAH? I think that’s a serious accusation. I don’t agree with a lot of Spencer’s analysis, but I trust he doesn’t allow that to influence his data.
1) What conclusions do you draw from this, as to what it means?
My conclusion is that global warming is continuing, pretty much in line with most scientific projections based on emissions of greenhouse gases.
2) What conclusions do you draw from this, regarding policy?
My conclusion is that it would be prudent for policymakers to reduce the amount of greenhouse gases being emitted.
Your conclusion is basically arrant nonsense based on deliberate ignorance.
There is NO EVIDENCE AT ALL that CO2 causes El Nino warming…
… and since El Nino warming comprises ALL the atmospheric warming in 45 years…
… you are just gibbering mindless AGW-cult mantra.. which is all you are capable of.
Real global temperatures are WELL BELOW the anti-science of the so-called model mean.
No one is saying that, dopey.
So you now agree that The El Nino warming is TOTALLY NATURAL.
El Ninos give the only warming in the satellite data.
So you are agreeing that there has been ….
NO HUMAN CAUSED ATMOSPHERIC WARMING IN 45 YEARS.
OK.. then stop your pitiful attempts to blame humans for warming.
You weaken your own argument by your own unbalanced rhetoric far more than any rebuttal from your opponent can. You do not persuade anyone like this. What are you trying to do? If its to let off steam, this isn’t the right place. If its to persuade, failure is inevitable using these methods.
So you can’t counter anything I just said, either. !
OK. !
NO HUMAN CAUSED ATMOSPHERIC WARMING IN 45 YEARS.
Show I am wrong…….. . or don’t.
Yes, I can counter a lot of what you just said.
Its not nonsense, though it is probably wrong, and you have no reason to think it is based on deliberate ignorance.
This is correct.
Probably not true. There is probably some warming effect from CO2 emissions, and there is also probably some cyclical temperature increase not related to El Nino. The question is how large these effects are.
You also say:
This is almost certainly wrong, there is almost certainly some human caused warming. The question is how much, and how much of recent warming is due to natural cyclical movements and how much to human emissions. You would have done better to say that there is probably very little human caused….
This is just childish abuse. Totally pointless. Worse, counter productive.
You are partly right, observations are indeed below the model mean. But you fail to point out the significance of that.
Where you are wrong? The use of the model mean is wrong, but its not so-called, that is what it is. It is also, though wrong, not anti-scientific. Its not pro or anti science. Its science all right, just very bad scientific method.
An utterly meaningless conclusion.
One of many!
No, its not meaningless. It is wrong, as I point out in my reply.
You cannot conclude from comparing the recent warming with the spaghetti graphs that observations are pretty much in line with predictions based on CO2 as control knob. The spread of the spaghetti graphs makes most clearly the point that there is no useful consensus. The fact that they almost all are running hot shows observations are not in line with ‘most scientific projections’.
With respect for many good posts previous to this one. Observed temperatures are, indeed, cooler than those model-based spaghetti graphs, despite earnest attempts to cook the books to bring temperatures into line with them. The multiple posts on errors, problems and rampant adjustments in the temperature datasets should be a wake-up call that the lunatics have taken over and are now running the asylum, to all of our detriment. They, like others posting here, are so blinkered that they only see the vindication of their precious models in the manipulation of the temperature datasets, they really don’t see the dangers for all of us. This headlong rush over a cliff based on manipulated data has got to stop – we desperately need to work out what is actually happening and the dangers inherent in each decision going forward, have a proper risk assessment – something that has been glossed over and handwaved away up until now.
# 2 ignores the many benefits of warming
These statements are what I don’t see any evidence for. That there has been recent warming, there is no doubt.
That its due mainly to human CO2 emissions, rather than natural variation, is not at all clear, even to the IPCC. Again, there can be no doubt that the additional CO2 has a forcing effect. The question is how this forcing effect plays out in the climate machine, what warming it delivers. The question is how much of recent warming is due to emissions, and how much to natural variation.
That it is in line with most predictions based on emissions also cannot be correct. Look at the spaghetti graphs which are universally cited. There are no agreed scientific projections. The range of estimates is so large its more a testimony to disagreement than agreement.
Your conclusion on policy is appropriately moderate, but it brings us to the really difficult question in all of this. What level of reduction do you think the evidence justifies, and by when? How would you propose making them?
And who do you want to see making these reductions?
I mean an answer somewhat along the following lines:
Total global emissions down to x billion tons a year by 2040, method, all countries move to wind and solar power, close down coal and gas generation, close down ICE use and move transport to EVs and home heating to heat pumps.
Or whatever means you would advocate.
As to the who:
China ____
US ____
Europe ____
India ____
Indonesia ____
Russia _____
Other ____
A useful way to start is, take the UK, currently doing 450 million tons a year. We have all the data anyone would want on where these emissions are coming from, what their trend are, what their alternative energy performance is currently. It has picked a target of zero by 2050. How would you go about reaching that? What do you think UK industry and society would look like under the Net Zero situation, were it to be achieved.
And do you think the scientific evidence on global warming justifies whatever you propose?
“The question is how this forcing effect plays out in the climate machine, what warming it delivers.”
Yes, that’s the question.
What we know is CO2 is a greenhouse gas. What we don’t know is how CO2 and the Earth’s atmosphere interact and what effect this has.
We have been looking for this effect for 50 years, and haven’t found anything concrete yet.
The temperature trend at present coincides with CO2 increases. This is all climate alarmists have to hang their hat on.
A turn to a temperature downtrend would put the climate alarmists out of business.
And, btw, we always get good comments from you, michel. Thanks for contributing. 🙂
I’m not convinced this extra CO2 has had a forcing effect – we’ve not seen it at any point, even during the COVID lockdowns, and the warmists have systematically ignored every other possible influence in their pursuit of the demon CO2. Which was, if you remember, also responsible for the global cooling scare of the 70’s. So, if CO2 can do both cooling AND warming, what makes them think it’s warming now?
CO2 is the Magic Molecule, don’tchya know. It can do anything needed.
CO2 has two forcing effects.
The one you refer to is a warming effect from widening of the 15 micron absorption window,
The one you never hear about and ignored by climate scientists is evaporative cooling driven by DWIR.
Can you prove that human activity is responsible? Let’s examine that rather naive, over simplistic assumption that man burns coal, oil and gas, therefore is responsible for all atmospheric increase of CO2 and it stays there accumulating year on year. Utter garbage. Anyone claiming this is ignorant of the carbon cycle. Yes, we add billions of tons of CO2 to the atmosphere, but it is ONLY billions. There are TRILLIONS of tons of dead vegetation around the northern hemisphere right now, all decomposing into CO2 and (gasp!) methane. What we add is background noise. Next spring new growth will start to re-absorb all this lovely plant food, and the southern hemisphere flora will start to decompose. Round and round it goes. And this is only the basics. Let’s bypass the fauna stage and skip ahead to the deep carbon cycle. What do the white cliffs of Dover, Italian marble quarries, the Great Barrier Reef and the entire state of Florida have in common? Yes, these and many other locations around the planet are composed of limestone. How is limestone formed? CO2 is absorbed by from the air by the oceans, where some of it bonds with other minerals to form carbonates, most notably calcium carbonate, which all kinds of life forms incorporate into their structure. They grow, they die, they pile up on the seafloor where, over millennia, they get compressed into rock. Eventually some of the limestone will get subducted into the magma, break down and maybe some of that CO2 will find it’s way back to the atmosphere via a volcano or seabed seep. Some, from millennia ago, is being released now. These processes have not stopped, the planet as dynamic as it ever was, and we lose as much, if not more CO2 every year as we add. We are midgets in the carbon cycle. So where is the extra coming from? 140 ppm over 170 years doesn’t even equate to a rounding error. Buy yourself a CO2 meter, you can get one for about £10 ($15) on ebay. It won’t be a precise scientific instrument, but it’s good enough for government work. You will find that levels can fluctuate by more than 140 ppm in a couple of hours, sooner if the wind changes. Anyone that thinks the IPCC can pick out the “human fingerprint” from all the variable sources and sinks is delusional. Why would a system with so many huge variables ever be in equilibrium? We could stop “emitting” tomorrow and the CO2 level might still double the day after. NOBODY knows how many seabed seeps like these there are:
https://www.youtube.com/watch?v=aRYgeOMBlmQ
Also, NASA satellites have observed that over the last few decades the planet has increased biomass by more than our “emissions” can account for.
“We are midgets in the carbon cycle.”
And you are a mental midget
The carbon cycle does not add CO2 to the atmosphere year over year
In fact, Earth’s CO2 level had been declining naturally for 4.5 billion years
The only reason CO2 began increasing after 1859 is manmade CO2 emissions.
CO2 emissions were small before 1975. But after 1975 they were large enough to cause more than a tiny amount of warming.
In fact, CO2 emissions rising and SO2 emissions falling are the simple Occam’s Razor answer to why the climate was warming after 1975. They may not be th e right answer but are the possibility with the most evidence.
The El Ninos caused all the warming after 1975 is the theory of Big Dummies who never heard of La Nina cooling events.
Richard, I think you are switching cause and effect round, missing bits out and generally getting tied up in knots. The Ice ages have had a disastrous effect on CO2 levels, lowering them to the point of plant starvation – we know that CO2 goes way down during glaciation and increases during interglacials. Your assumption that CO2 has been declining naturally for 4.5 million years ignores the effect of ice ages – without them we would be at a far, far higher level of CO2. Oddly enough a German scientist measured CO2 levels at 550ppm in 1945 – higher than we have today. As to your use of Occams razor; simpler is not necessarily better if you have to ignore contrary evidence to make it plausible.
grocery prices are also up. Must be something relevant. Maybe the mechanical heat produced by so many wind turbines.
And what’s happened during the last 25 years?
The most likely meaning is that the HTE caused a reduction in clouds allowing more solar energy to warm the oceans. As usual, the oceans like to share. The big question is what in the HTE caused the reduction in clouds.
I hope while you’re wringing your hands, you don’t draw blood.
In an interview after the 15/16 El Nino high, Dr Spencer said that the uncertainty in the satellite measurements is +/- 0.2 C. Therefore the 15/16 El Nino high is not statistically different than the 97/97 El Nino high. Yes, the current calculations seem to indicate a new satellite record but does it really mean anything? Were the higher temperatures actually any different experience than previous high temperatures in the places that had high temperatures? Averaging across the planet throws away so much information.
“In an interview after the 15/16 El Nino high, Dr Spencer said that the uncertainty in the satellite measurements is +/- 0.2 C. Therefore the 15/16 El Nino high is not statistically different than the 97/97 El Nino high.”
That is correct.
Got it, the fourth warmest was back in 1998, so that proves that it is not getting warmer, right?
/sarc (of course)
/Jan
“I don’t think record breakers are the best way to assess warming, but it’s pretty clear it has been unusually warm in the last 8 months.”
The 1930’s in the United States was warmer than the current temperature.
The United States has been in a temperature downtrend since the 1930’s.
CO2 has no discernable warming effect on the United States.
The only reason you see “unusually warm” weather today is because of the bastardized temperature record. If you look at REAL temperature records from around the world, you will see it was just as warm in the Early Twentieth Century as it is today. There is no unprecedented warming today.
Getting breathless over today’s temperatures is either clueless or disengenuous depending on whether you truly believe it, or whether you are just trying to sell a human-caused climate change narrative.
“The United States has been in a temperature downtrend since the 1930’s.”
Just not true. Even if you can demonstrate that there was a few warmer years in the 1930s it does not mean there has been an overall or continuous downward trend since then. And you are still only talking about one small part of the world.
“The only reason you see “unusually warm” weather today is because of the bastardized temperature record.”
Your confirmation bias is showing. To you any data that shows the US being warmer in the 30s is accepted without question, any data that doesn’t show that is just dismissed as “bastardized”.
Well, the data that shows the US being warmer in the 1930’s is written temperature records, not computer generated, so yes, I have more confidence in written records that took place before people had a CO2 agenda. This is unbastardized data.
And written, historical temperature records from around the world show the very same temperature profile as the US temperature profile where it was just as warm in the Early Twentieth Century as it is today.
Below is a comparison of the US regional chart with the bogus, bastardized Hockey Stick “hotter and hotter and hotter” chart.
All the unmodified, historic, written temperature charts from around the world have a similar temperature profile to the US regional chart where it was just as warm in the Early Twentieth Century as it is today. None of the unmodified temperature charts from around the world have a Hocky Stick temperature profile.
That being the case, how does one get a Hockey Stick chart temperature profile from data that does not have a hockey stick profile? The only way to do that is to mannipulate the data. This is what you assume is the way the world looked in the past. But there is no evidence, outside of a computer, that this is the way the world looked.
The US chart on the left and the bogus Hockey Stick chart on the right: How do you get one from the other without bastardization?
I’ll take the written, historical record every time.
“The US chart on the left and the bogus Hockey Stick chart on the right: How do you get one from the other without bastardization?”
You do like to prove m y point don’t you? Both charts are from the same source, both use the same techniques. The only difference is one is showing just US temperatures, the other is showing global temperatures. But you just assume the US one is “un-bastardized” and the global one is “basterdized” for no reason apart from the global one showing something you don’t like.
Tell us why the U.S. has a wall around it whereby CO2 works differently. Maybe privelage!
How much more fkn data do you need to see that this warming is not related to burning of fossil fuels ??
Greater than zero evidence would be a start.
Zero correlation is evidence
Absence of evidence is not evidence of absence.
And two, there is far more than zero correlation between CO2 and temperatures.
So you have discovered a functional relationship between CO2 and ΔT.
I get A(nomaly) = 0.0076 • CO2(ppm) – 2.91
You have just proved all the models incorrect.
The only fly in the ointment is that this doesn’t predict pauses. Oh heck.
“So you have discovered a functional relationship between CO2 and ΔT”
It’s not a functional relationship.
“You have just proved all the models incorrect.”
How? As usual you try to divert from the point, which was a simple refutation of the claim there was zero correlation between CO2 and global temperatures. But, if I take the Log of CO2, this annual relationship becomes
Anomaly = 1.99 * log2(CO2) – 17.07
which if you took as an indication of Transient Climate Response would be well in line with IPCC best estimate of 1.8°C, with a likely range of 1.4 to 2.2°C. But there may be many other factors, and this is using the slowest warming data set.
If I add annual ENSO conditions into the linear regression, the rate goes up to 2.16 * log2(CO2),
“The only fly in the ointment is that this doesn’t predict pauses. Oh heck.”
Well it sort of does. There’s a lot of variation from year. It’s almost inevitable that you will see negative trends over a short period.
You are doing nothing but curve fitting. I you didn’t recognize it the whole article is fundamentally about curve fitting. Climate science has spent trillions trying to curve fit not just temperature but ΔT. It’s becoming a joke.
What are you talking about now. I was told there was zero correlation between temperature and CO2. I showed that was not correct – now you say I cheated by using curve fitting. Tell me how you would demonstrate zero correlation without some sort of fitting?
And what are you disagreeing with in this article? It’s just announcing the latest monthly UAH anomaly.
I upvoted you – you can’t downvote someone for presenting the data in a clear and non-alarmist manner. It’s obviously a strong El Nino, just a fact.
Yes, good news! There’s not a better time than winter to have relatively (still cold) temps.
Ask any reasonable person.
Still looking like a slow recovery from the Little Ice Age.
Solar activity has not yet been low enough for long enough to reverse the trend.
No sign of the sort of acceleration relied upon by proponents of the CO2 theory of climate.
Likely that atmospheric CO2 is closely linked to sea surface temperatures and the ice core record fails to capture large short term variations.
We still haven’t broken the October record despite the ever-strengthening El Niño. This is good evidence that the mid-2023 spike was unrelated to El Niño; the record highs of the last 7 months have been this mysterious spike event, now likely waning in influence, superimposed on the El Niño.
Don’t rule out the return to the Monckton pause.
We can be more confident than that even. It is guaranteed that there will be another Monckton Pause period. In fact, history tells that it has already started! This is why it is a puzzle that Monckton has ghosted WUWT at least in regards to his monthly updates.
Christopher’s time & attention is fully consumed with the launch of his “green” cucumber-fueled energy generator / storage system. There’s enormous interest from Just Stop Oil and other planet saviors.
He’s rushing to get it globally installed before the vaunted “climate crisis” arrives.
Apparently the c.c. (due any day now) is going to –
strike down upon thee with great vengeance and furious anger those who attempt to deny and mislead my brothers.
And you will know my name is
John Kerry(t.b.a.) when I lay my vengeance upon thee.Didn’t Monckton of Brenchley mention he (and others) were putting a paper together? Perhaps he’s occupied on that?
Probably. I’ve been following this site more or less since it started and grandiose pronouncements like this are common among the Monckton-types. They never seem to amount to anything.
He’s been correct about the length of every zero trend period between El Ninos.
You still haven’t provided any evidence that the El Ninos are anything but NATURAL.
That mean you have no evidence of any human caused atmospheric global warming in 45 years
I haven’t said they aren’t.
ENSO is a natural system (an ‘oscillation’ – the ‘O’ in ENSO). It has nothing to do with long term warming.
“. . . an ‘oscillation’ . . . .”
According to Mr. Stokes, chaotic systems don’t oscillate.
ENSO isn’t ‘chaotic’. It’s recurring. The exact timing isn’t predictable; but it’s not random.
An oscillation requires an in-phase positive feedback at the frequency of oscillation.
Tell what the feedback is and from whence it appears.
Again proving that your understanding of El Nino and La Nina is basically ZERO…
…. just like your understanding of anything else to do with climate.
Well Done 🙂 But we already knew that.
“It has nothing to do with long term warming.”
El Nino is part of ENSO. Totally NATURAL
It is the only warming in the last 45 years of atmospheric data.
Long term, the planet is cooler than it has been for most of the last 10,000 years.
You are talking nil-informed gibberish again.
Look at the great abundance of activity across the face of the land and sea. There is plenty of evidence for anything you care to harvest it for.
Did you use a different nom de guerre back then?
I too have followed this site since about 2008 under a couple of name changes and don’t remember any from you until fairly recently. I like to read comments and the reaction to them.
In case on the Monckton Pauses I don’t believe anyone disproved that there have been pauses in the temperature rise or why increasing CO2 should make that should be.
All the trendologists could manage is to make a lot of noise about “cherrypicking”.
IMO, no. Even I could do the work required for his pause extension posts in 15 minutes.
Not puzzling at all.
The big NATURAL El Nino has broken the 107 month zero trend.
Just like the other zero trend periods have been broken by TOTALLY NATURAL El Nino events.
Unless you are going to try to invent some totally spurious human causation for El Nino events,..
…. “AGW isn’t happening !
(as opposed to human-caused local urban warming smeared over the whole land surface)
He’ll probably wait until it’s longer than 12 months or so, before he gets excited about it
His favourite pause – the one which ran from the spike of temperature so easily seen on the graph at the top, ran for about 18 years at one time. He used to write lovingly about it, as though it were a real person.
It died a lingering death, finally meeting its demise in early 2016.
The least-squares trend from July 1997 to February 2024 is now greater than the trend for the whole dataset No wonder he’s keeping a low profile.
And the trend starting in 2010/06 which began the most recent pause at its peak is now +0.26 C/decade…almost twice that of the whole dataset.
“this mysterious spike event”
Hunga-Tonga?
It’s logical and the timing seems to fit. It’ll be a real head-scratcher getting some evidence to support it though – even though evidence no longer appears necessary to support an argument.
I think we will eventually know whether Hunga-Tonga had any discernable effect.
That’s a lot of water going up into the stratosphere.
Yes, the timing in the CERES cloud data certainly appears to be tied to HTE. The cause/effect is the big question.
One claim I’ve seen is the water vapor leads to a reduction in ozone. This could lead to more UV radiation making it into the troposphere. Would that affect cloud formation? Don’t know.
The peak length of the Monckton pause reached 107 months starting in 2014/06 on the 2023/04 update. The trend using the Monckton method from 2014/06 to 2024/02 is now +0.26 C/decade. That is an awfully high rate of warming for a period and method that was used to suggest that the warming had come to end.
Similarly, 107 months is an awfully long time for an ever increasing radiative gas such as CO2 to take a vacation from delivering on its well understood physical properties. One must also surely wonder why it always takes El Nino conditions to prod CO2 back into doing what it is famous for. I can’t think of a mechanism that would do that, can you?
You answered absolutely nothing.
Your “model-CO2” line is completely and utterly meaningless. !
It is based on ignorance, at best. !
Yeah I was curious about this as well.
I had it down for +0.2687 C/decade.
I think that maybe having a big El Nino amplified by an underwater volcanic eruption may have had a little something to do with it. Either way it’ll be interesting to see what happens next – the suggestions started a few months ago and seem split between enso neutral for a while (Anthony’s La Nada) and a gradual transition into a strong La Nina by the end of the year; another El Nino following this one appears to have no takers. Time alone will tell.
Quite right. I recall reading about the Younger Dryas event that occurred 11,000 years ago. The Northern Hemisphere cooled rapidly within a couple of decades, which reversed the prior warming trend associated with the recovery from glacial conditions.
El Nino definitely plays a role. I think the jury is still out on just how much of an effect Hunga Tonga has. The consilience of evidence so far says not much. I’m taking a more cautious stance of that myself.
Evidence is going to be a right so-and-so to get. Probably the best might be a coincidence of timing and some idea of the mechanisms in play.
While the CERES cloud data doesn’t prove HTE was the cause of most of the warming, the implication is obvious. Of course, climate alarmists will dismiss anything in order to hold on to their religion.
“The peak length of the Monckton pause reached 107 months starting in 2014/06 on the 2023/04 update.
Only to be broken by a totally natural El Nino event..
No evidence of any human causation.
El Ninos are all the AGW-cultists have to hang warming on.
You have just proven that, by doing it again.
The Monckton pause included La Nina cooling events
Bdgwx, I wrote about this previously here. Look it up.
The significance of the pause is different than Monckton claims.
In 2008 in JAMA, a ‘climate science’ paper said it would take a 11 year pause to falsify climate models. When 11 years passed, the same ‘climate scientists’ moved the same journal goal posts to 15 years. When 18 years past, they gave up on pause model posts altogether. Oops.
Just not true; it seems to muddle two denier myths. Proper references would help.
The first seems to refer to an inclusion in the 2008 climate report of the Bulletin of the AMS (there is no JAMA), which actually appeared in 2009. It said
“The simulations rule out (at the 95% level) zero trends for intervals of 15 yr or more, suggesting that an observed absence of warming of this duration is needed to create a discrepancy with the expected present-day warming rate.”
But earlier in the para, they specify that they are talking about ENSO-adjusted trends. And of course the locally popular pauses start with a huge El Nino.
Later, in 2011, Santer et al wrote in JGR atmospheres:
“Our results show that temperature records of at least 17 years in length are required for identifying human effects on global-mean tropospheric temperature.”
And so Rud et al said – look, he’s saying that 1 17 year pause disproves AGW (tho here Rud says climate models). But he’s not. He is just saying that you need at least 17 years to make a positive identification.
Only “myths” are the ones you peddle, Nick !!
You have just proven you are peddling one right now.
—
And of course the locally popular pauses start with a huge El Nino.
WRONG.. the zero trend periods END when there is a strong El Nino.
It takes a strong El Nino to break the long zero-trend periods.
The AGW-cultists rely totally on the El Ninos for atmospheric warming.
—
“Our results show that temperature records of at least 17 years in length are required for identifying human effects on global-mean tropospheric temperature.”
We now have a satellite record 45 years long.
There is no evidence of any human caused warming in 45 years of tropospheric data.
You’re wrong as usual, of course Monckton’s pauses start with a huge El Nino, projecting back to a recent hot spot is the basis of his method!
The relevant publications are [Peterson et al. 2008] and [Santer et al. 2011]. No need for me to point out what they actually said since Nick already did that and since everyone can read it for themselves.
Bdgwx – please explain to me why, in a series of posts entitled ‘The Pause’, anyone would think that it had stopped? You are not making any sense with that idea, I’m afraid.
I don’t know why people think global warming had stopped. It doesn’t make sense to me either.
Hello,
The late 2023-early 2024 values represent significant departures from the prior portrayal of a gradual overall warming trend, at least to my eyes. Will you be offering, following the update of the 4 indices that you referred to in this post, your interpretation of why these recent values in the time series are as to be expected, and why?
Thank-you. I enjoy reading, and appreciate, your contributions.
Here is the customary Australian data update of our “pause”.
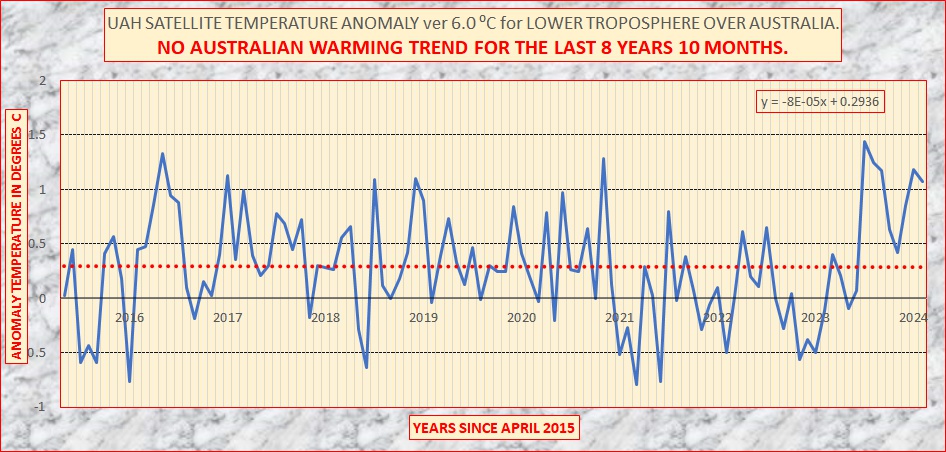
Geoff S
Geoff … my calculations are still showing Australia’s “pause” lasting 11 years and 11 months if calculated via ACORN land stations, as updated today at http://www.waclimate.net/australia-cooling.html
In summary for the first and second halves of April 2012 to February 2024, ACORN anomalies averaged 0.991C in April 2012 to March 2018, and 0.975C in April 2018 to February 2024 = anomaly cooling of -0.016C.
UAH anomalies for Australia averaged 0.208C in April 2012 to March 2018, and 0.265C in April 2018 to February 2024 = anomaly warming of +0.057C.
No drama whatsoever with your UAH calculation of an eight year, 10 month pause for lower troposphere anomalies, but it’s relevant for Australians living on the surface of their country that despite “hotter and hotter” summers, “unprecedented” climate warming, 2019 the driest and hottest year since 1910, etc, the mean temperature was a tiny bit warmer in April 2012 to March 2018 than it has been for the past five years and 11 months.
El Ninos effect the atmosphere more than the surface.
The only thing that has broken the much longer ZERO TREND in “UAH Australia”, is the El Nino.
Doesn’t seem to have effected Australia’s surface temperatures much though…
… probably because of the amount of rain we keep experiencing.
Very odd for an El Nino, which usually brings “dry” to the East of Australia.
Chris at waclimate,
Yes indeed. Here are the plots of Australia’s Bureau of Meteorology land surface anomalies compared with the satellite-based UAH for the lower troposphere over Australia.
In each case I have shown the “PAUSE” in the style of Viscount Monckton. It is 12 years via BOM and 8 years 10 months via UAH.
Note that the brown and blue lines are offset from each other because different baseline years were used to calculate the anomaly.
…..
There is not much doubt that we in Australia are in a decade-long pause from warming, but the meaning of this depends on how stringent your science is.
I would claim for general interest that most school children need not fear past global warming because they have never experienced it. Our political masters of green tinge are hell bent on claiming catastrophic, unprecedented disaster. You can believe that if you believe in the tooth fairy.
Geoff S
Well, you say “customary”, Geoff; yet I note that the start date and therefore period of ‘pause’, seem to be a moveable feast when it comes to UAH Australia.
I’ve seen ‘no warming in Australia’ charts here at WUWT that started in 2000, 2002, and 2012; probably more than those dates. Every single one now shows a warming trend.
What start date are we up to this time?
Very Monckton.
TFN,
I simply plot the data each month as it is released.
I do this because there will come a time when warming turns to cooling. These graphs will then show a cusp. That is, they will be persistently flat until they show a persistent decline.
I am not aruing that we are at a cusp now. I am simply arguing that these data show no warming for a decade or so.
It is non-scientific to try to predict the future course of these plots. Yet, the IPCC Summaries for Policy Makers place most of their fearmongering in the “predicted” years.
Even financial advisers in Australia are now advertising on TV that “Past performance is not a reliable indicator of future performance” or words to that effect. I wish that pear of prosecution might cause the IPCC Summary writers to take heed and slow their imaginations down.
Geoff S
Yeah, with the start date that maximises the latest rapidly diminishing period of zero trend. You never mention the fact that the long-term warming trend in Australia is currently running faster than the global average, according to UAH.
A few months back it was ‘more than a decade’; now it’s ‘a decade or so’. When you look at the running 30-year trends there is virtually no difference. Statistically significant long-term warming.
Yet a few paragraphs earlier you were dogmatically stating that “… there will come a time when warming turns to cooling.“
Is that a ‘scientific’ forecast, or your best guess?
TFN,
It is not a guess at all.
Any trend, be it to hotter or colder temperatures, will one day change direction, with high probability. If it did not, we would face the threat of global extinction as it became either too hot or too cold for life to exist.
All I am doing is showing a pattern that could be the flat top of a cusp before it changes direction to either warmer or cooler. I am NOT predicting anything other than that we will cease to exist if you assume that there are no curbs to increasing cold or heat.
BTW, do you agree or not that the graphs show that Aussie youngsters have not been exposed to increasing air temperatures, so should not be in a panic about climate change they have never felt?
Geoff S
All real data from Australia shows around 1880-1910 being a similar or higher temperature than now.
A large proportion of BoM sites are badly affected by urban warming, starting around 1960,70 when major expansion in Australia began.
Most sites that can be heavily urban effected have already been shallowed up by urban expansion… now we are looking at urban densification…
…. plus other people are now keeping a close eye on BoM’s shenanigans.
BoM will still try to “fudge” the data, but it will be harder for them to get away with it.
How does any of that address the fact that you guys have to keep bringing the start date forward in the UAH data to find the latest longest period of zero trend in the UAH data?
A few months ago you were talking about 17-years zero trend; now you’re down to around 8 years. In just a few months. When will you ever learn not to trust short-term fluctuations in long-term data sets?
Yawn
I do hope the Rusty Nail is ok. I don’t see any hyperventilating here.
Yes, I am well-oiled and rust-free, thank you.
Dr spencer caught me slightly off guard this month, because he mentioned on his site that the UAH computer system had collapsed and IT were re-booting everything. He was expecting a delay in the Feb update of ‘days to weeks’.
So I relaxed; took a break from the hyperventilation.
But no, here we are….
Curious. Wasn’t there another collapse reported on a different site recently? I seem to recall seeing two incidents and no I didn’t just see two announcements from UAH but I’m not sure where the other one was from.
yes, It appeared.
Still using its ignorant AGW-cult brain-washing to try to push CO2 warming garbage.
Still not providing any evidence at all of human causation for the El Nino.
My wee mate b-nasty!
Thanks for not shouting.
You have to shout when your side keeps putting their fingers in their ears and chanting “nah, nah, nah!”
Which one is fungal !!!??
Trying to talk softly to the brain-dead !
They can’t hear or comprehend anyway. !
I emphasise mainly so other people can start to understand and comprehend reality…
I know it is against your nature and ability to do so.
Yes it is best not to shout around people after getting well oiled turns into a hangover!
This is looking like an untypical El Nino, compared to other recent peaks.
Yes, my opinion is that whatever is behind the spike is waning in influence. I think we will return to the 9-year cooling trend. I won’t bet on it though; don’t bet on anything when it comes to deterministic chaos.
On February 27Spencer announced the February data would be late
It showed up on March 2
The El Nino Nutters will be thrilled.
We’re having the warmest winter with the least snow since I moved to Michigan in 1977. And we love it.
I doubt if an El Nino affects us here but …
Does anyone out there prefer colder winters over warmer winters (other than ski bums)?
This is the best climate in my lifetime, and that is a long trime. We have been getting less snow and warmer winters since the early 1980s Especially the past three years.
And every year we listen to scientists predict climate doom as our actual climate improves.
As I said before, El Ninos usually mean a dryish period in eastern Australia.
This year.. nope…rain every 3 or 4 days. Lawn is growing mushroom !
A rather “different” El Nino..
Looks like a double peak on this one, too.
Only problem I’m having is trying to keep up with the mowing !!
“This is the best climate in my lifetime”
You wouldn’t be saying that if you lived in Central Asia.
Is Greene’s real name Lazarus Long?
The Thames is boiling@ur momisugly!@ur momisugly!@ur momisugly!@ur momisugly!!!
I spy El Nino. Nice and warm.
Patience. The higher the peak, the deeper the drop. This heat is leaving the earth system by radiation.
I find it amusing that warmist/alarmists flock to posts like this because they stare at any thermometer showing a warming in its heck, they probably reach peak panic feeling faint by 5-6 pm every day when it stops warming while not posting in other science-based threads because there are no thermometers in them.
Daily panic seems to be a daily habit.
With this new heat, shouldn’t we be seeing the assorted catastrophes predicted by the “climate experts”? Are the ice caps melting and sea levels rising uncontrollably yet? Where are the mass extinctions? Where are the millions of climate refugees? Were are the boiling oceans?
The mass extinctions are only happening around working wind turbines and solar power plants. As to the rest – it all happens in really far-off places where nobody can see it! Ok that last bit should have a sarc tag but the first bit is serious.
Wasn’t there an underwater volcano that erupted a while back and released enormous amounts of warm water into the atmosphere?
Underwater eruption…yes. Enormous amounts of water…not so much. The Hunga Tonga eruption injected only about 150 MtH2O into the atmosphere. As a point of comparison since the eruption about 80000 MtCO2 got injected into the atmosphere by humans. The issue isn’t the amount of water that got injected into the atmosphere by the eruption. :The issue is where it got injected. It went into the stratosphere where even a seemingly negligible amount of 150 MtH2O represents a 10% increase in that layer. The layer is important because water vapor does not condense out very quickly like it does in the troposphere. This augments Earth’s GHE. So far the consilience of evidence says the net effect of the eruption could change the global average temperature by between -0.1 and +0.1 C. That is somewhat unique in that eruptions almost always have a negative effect on the temperature.
bdgwx,
If I said that 20 years ago you did not know what the stratosphere and troposphere were, you did not know what an El Nino was, you did not know the physics following 150 million tonnes of new water into the air – and that now you are behaving like a pontificating expert, would you agree or disagree?
At least, when I write, I try to study the sources of major comments, study conclusions of others alongside what I was taught of the science and so try avoid jumping on popular bandwagons, to avoid the fickle finger of fate determining what I blog about. Mostly, I try to show data to support my words.
Your final words here start with “That is somewhat unique …”. Somewhat unique is invalid. “Unique” is a yes/no feature, like “pregnant” that has no place in reporting of hard science. Then you claim without references that “eruptions almost always have a negative effect on temperatures.” How can you say this, when the Hunga Type of eruption seems not to have been investigated much in the past and understanding is incomplete as we write? That is one reason why references help more than bland statements of opinion.
Geoff S
I am no expert. I wouldn’t even call myself an amateur. I’m not sure if that means I agree or not.
I completely agree. Here are references for the Hunga Tonga eruption.
[Jucker et al. 2023]
[Jenkins et al. 2023]
[Zhang et al. 2022]
[Zhu et al. 2022]
[Sellitto et al. 2022]
Here are the references for volcanic forcing going back to 1750.
[Smith et al. 2020]
The data can be downloaded from the github repository.
Not sure how relevant it is to assess what anyone knew 20 years ago. What is important is the fact that he better understands the facts and “the physics” better than you, as of yesterday.
And ““That is somewhat unique …”. Somewhat unique is invalid.” is right out of a mail man’s mouth in a “Cheers” script…