By Andy May
Since the late 19th century, with the work by Svante Arrhenius, climate models have been used to estimate the amount of global warming due to human greenhouse gas emissions.[1] Due to the complexity of Earth’s weather and climate, the connection between climate change/global warming and greenhouse gases cannot be observed or measured, it can only be estimated with a model. Arrhenius constructed the first such model and speculated that temperature changed linearly with the logarithm of the CO2 concentration, specifically he estimated that as CO2 doubled in the atmosphere, surface temperature should increase 4°C.[2]
In part 1 of this series, I proposed a definition of a scientific model and described the types of models used by the IPCC in their various reports. We saw that as George Box famously said, “All models are wrong.”[3] He also said that all models reach a point where they cannot be improved, a point where (paraphrasing) attempts to refine them or make them more accurate amount to self-flagellation. We also saw that there are many examples where the sixth generation CMIP models fail to predict climate accurately. If you can’t get it right after six tries, you might have entered the realm of self-flagellation. Finally, part 1 lists the most common types of bias in the CMIP climate models and the IPCC reports.
Arrhenius’ estimate of the climate sensitivity to a doubling of CO2 of 4°C, falls within the IPCC AR6 estimate of the likely range of this value, which they abbreviate as “ECS” or the equilibrium climate sensitivity. The AR6 range is 2.5 to 4°C/2xCO2.[4] Thus according to the IPCC, Arrhenius’ estimate over 100 years ago is possibly still valid. Arrhenius concludes that the changes due to burning fossil fuels are a good thing, and writes:
“By the influence of the increasing percentage of carbonic acid [CO2] in the atmosphere, we may hope to enjoy ages with more equable and better climates, especially as regards the colder regions of the earth, ages when the earth will bring forth much more abundant crops than at present, for the benefit of rapidly propagating mankind.”[5]
Arrhenius, 1908, page 63.
Arrhenius’ model was based upon laboratory measurements of the “permeability to heat”[6] of CO2 and water vapor. He tells us that the sources of additional CO2 are volcanos or human fossil fuel consumption and the main sinks for CO2 are the ocean, the weathering of rocks by carbonic acid, and growing plants.[7] Plants are more abundant and robust when the atmospheric CO2 concentration is high and less so when it is lower. He notes that all CO2 sinks increase in strength as the CO2 concentration increases.
Arrhenius’ conclusions were mostly accepted as the world warmed from 1908 to 1945, but when the world cooled from 1945 to 1976, while CO2 was still increasing, the hypothesis fell into disrepute. The pattern of global average surface temperature change, often used as the primary metric of “climate change” is illustrated in figure 1 using the HadCRUT4 global surface temperature anomaly dataset.[8] His ideas gained favor again after 1976 when the world began to warm again. The instrumental temperature record reveals that while CO2 concentration may have some influence on climate, as the Arrhenius and IPCC climate models attempt to show, it cannot be the entire story. It is instructive that both Arrhenius and the IPCC assume, in their models, that solar variability plays no role in recent warming and cooling. Both assume that volcanos do play a role, Arrhenius thought volcanos put more CO2 into the air and caused warming[9] and the IPCC assumes that volcanic aerosol emissions reflect more sunlight and have a cooling influence.[10]
In AR6, they feed recent observations of CO2 and temperature, paleoclimate CO2 and temperature proxies from the geological record, and modeled constraints on climate sensitivity into a subjective statistical model to compute a likely ECS range of 2.5 to 4°C/2xCO2.[11] This is a change from previous reports where general circulation climate models were used to compute the ECS. As they write in AR6:
“… despite decades of model development, increases in model resolution, and advances in parametrization schemes, there has been no systematic convergence in model estimates of ECS. In fact, the overall inter-model spread in ECS for CMIP6 is larger than for CMIP5; …”[12]
AR6, WGI, page 1008.
While reading this quote from AR6, we need to remember Box’s cautions about “overelaboration and overparameterization.” It is also worrying that even after refining the IPCC/CMIP models for over 30 years, the spread in model results is not converging, it is increasing. This is a sign that the model premises[13] and/or design are flawed. It is also a clue that the conceptual IPCC model that human activities are controlling climate change,[14] has reached the end of its useful life.

The likely lower limit of 2.5°C/2xCO2 was raised from the AR5 lower limit of 1.5°C/2xCO2.[15] However, their subjective statistical model is flawed and internally inconsistent with the confidence intervals of each input variable. When Nic Lewis redid their work using an objective statistical model, with improved and more recent data, he produced an ECS range of 1.75-2.7°C/2xCO2 (5-95%ile).[16] Like the IPCC, Lewis assumes that increasing CO2 has caused nearly all the warming since the 19th century. If that assumption is incorrect and there was some natural warming due to the Modern Solar Maximum[17] then even Lewis’ calculated ECS values are too high and are maximum, not likely values.[18] A large body of evidence for an ECS less than 2°C/2xCO2 exists,[19] which supports Lewis’ view that the AR6 subjectively modeled ECS is biased high.
AR6 does mention that observation-based studies exist that produce estimates of ECS below 2°C/2xCO2 but dismisses them because they believe that the feedback to increasing CO2 and warming increases with warming.[20] This concept of climate feedback changing as the world warms to increase the warming rate is a perfect example of Box’s “overelaboration.” They write that since observation-based estimates assume that the net feedback remains constant over the period being studied (usually 1870 to 2020), the estimates are incorrect. All the authors of the Clintel AR6 assessment dispute the idea that CO2 warming feedback changed significantly from 1870 to 2020.[21]
When a favored model, such as the IPCC model that CO2 is the “control knob”[22] for climate reaches its end, it is common to reach for any idea that can save it from extinction (overelaboration). However, the idea that CO2-caused warming feedback changes radically over geologically short periods of 150 years is a very desperate reach.
Laboratory measurements show that infrared active gases, like CO2, water vapor, and some hydrocarbon gases selectively absorb some of the infrared radiation emitted by Earth’s surface.[23] When they do this, the gas molecules become excited and vibrate faster for periods of a few milliseconds to a few tenths of a second and in this excited state, they collide more often with the gas molecules around them, warming them.[24] Then they emit the remainder of the radiation they absorbed. In the denser and more humid atmosphere near Earth’s surface, this has a warming effect because almost all the emitted surface radiation joins the neighborhood thermal energy pool.[25] The higher in the atmosphere the surface radiation is absorbed, the less energy is retained in the immediate neighborhood and the more energy is emitted by the greenhouse gases as radiation, some of which goes to outer space and escapes Earth’s climate system. The altitude where more of the radiation goes to space than to the surrounding air or back to the surface is traditionally called the “top of the atmosphere” or TOA.
Summary
In this part we examined the IPCC “conceptual model” or hypothesis that attributes modern warming to human influence through our land use and greenhouse gas emissions,[26] and the idea’s 100-year plus history. While adding greenhouse gases to the atmosphere probably causes some warming there are numerous studies that suggest some of the warming is natural and unrelated to human activities. The proportion of the warming that is due to human activities is unknown, but as we have seen in this post, it is very unlikely to be either zero or 100%, it falls in the middle somewhere, and may be small.
Modern general circulation climate models (called “Earth System Models” or “ESMs” in AR6) are all based upon the idea that most or all the warming in the past 150-170 years is due to human activities, with minimal impact from volcanism or solar activity changes. However, the models do not match observations in numerous critical areas.[27] As noted above, in some cases the CMIP6 models are worse than the previous generation CMIP5 models. Since these mismatches have persisted through six iterations of the models, it is reasonable to assume the flaw is in the assumptions, that it is in the hypothesis itself. In other words, it is likely the conceptual model should be scrapped, and a new one with different assumptions constructed.
In the next part we will examine the IPCC/CMIP assumption that changes in solar activity over the past 170 years have been too small to make any difference in Earth’s climate. In part 4 we will examine the assumption that changes in atmospheric and oceanic circulation make no net difference in the climate over time, since all these changes supposedly do not change the total thermal energy (heat) stored in the climate system, they just move it around.
Download the bibliography here.
(Arrhenius S. , 1896) ↑
(Arrhenius S. , 1908, p. 53) ↑
(Box, 1976) ↑
We abbreviate the temperature increase due to a doubling of CO2 as “2xCO2.” The IPCC AR6 estimate can be found here: (IPCC, 2021, p. 926). ↑
(Arrhenius S. , 1908, p. 63) ↑
(Arrhenius S. , 1908, p. 52) ↑
(Arrhenius S. , 1908, pp. 54-55) ↑
(Morice, Kennedy, Rayner, & Jones, 2012) and (Morice C. , 2017) ↑
(Arrhenius S. , 1908, p. 55) ↑
(IPCC, 2021, pp. 961-962) ↑
(IPCC, 2021, p. 926 & 1007), (Sherwood, et al., 2020), and (Lewis, 2023) ↑
(IPCC, 2021, p. 1008), AR5 is the fifth major WGI IPCC report: (IPCC, 2013). CMIP5 are the models used in AR5. ↑
Model premises are all the assumptions and data used to build it. ↑
“Taken together with numerous formal attribution studies across an even broader range of indicators and theoretical understanding, this underpins the unequivocal attribution of observed warming of the atmosphere, ocean, and land to human influence.” AR6 WG1 TS, page 63. ↑
(IPCC, 2013, p. 81) ↑
(Lewis, 2023) ↑
The Modern Solar Maximum is from 1940 to 2000. See (Usoskin, Solanki, & Kovaltsov, 2007). ↑
(May, The Mysterious AR6 ECS, Part 4, converting observations to ECS, 2023b) and (Crok & May, 2023, p. 103) ↑
(May, The Mysterious AR6 ECS, Part 3, What is Climate Sensitivity?, 2023) ↑
(IPCC, 2021, p. 996) ↑
(Crok & May, 2023, p. 104) ↑
(Lacis, Hansen, Russell, Oinas, & Jonas, 2013), (Lacis, Schmidt, Rind, & Ruedy, 2010), and (IPCC, 2021, p. 179) ↑
(Tyndall, 1861) and (Wijngaarden & Happer, 2020) ↑
(Pierrehumbert, 2011) ↑
(Wijngaarden & Happer, 2020) and (Pierrehumbert, 2011) ↑
AR6 WG1 TS, page 63 ↑
(McKitrick & Christy, A Test of the Tropical 200- to 300-hPa Warming Rate in Climate Models, Earth and Space Science, 2018), (McKitrick & Christy, 2020), (Lewis, 2023), (IPCC, 2021, p. 990) ↑
Hadcrut4 is an “adjusted” dataset. It really should not be used for serious analysis. Also, a global temperature measure makes little sense.
All the datasets are adjusted. I refuse to use HadCRUT5, it is a total mess. HadCRUT4 is the lesser of many evils IMHO. You are correct, a global average surface temperature has little meaning and is a misleading measure of climate change, but the IPCC has decided to hang everything on it. I will have more to say on this subject in future posts.
Not just mal-adjusted, but also massively contaminated by bad urban sites, airport jets, changes of thermometers etc etc..
And contaminated by homgenization and infilling.
Which global average temperature dataset should Andy be using?
There is no such thing as a reliable “global” surface temperature fabrication.
It is a fool’s errand. He should state from the start that all the Crud series, + any surface data concocted from contaminated urban sites and is not reliable enough to do anything scientific with.
The only “mostly” reliable trend indicators are UAH and USCRN.
UAH shows no warming apart from at El Nino events. USCRN .. the same.
I’m going to let you pick that fight with Andy alone.
So you agree with everything I just said.
Thanks. 🙂
This is a badly formed question since it assumes there is such a thing as “global average temperature”. There isn’t such a thing. At the very least the variance of the components legislates against any “GAT” being able to be identified.
There *is* a reason why variance, a REQUIRED statistical descriptor for a distribution, is never actually calculated at any point in the hierarchy of “averages” used to develop a “global average temperature”. It would put the lie to the ability of a GAT being identified.
“It is instructive that both Arrhenius and the IPCC assume, in their models, that solar variability plays no role in recent warming and cooling.”
Just untrue. GCMs make full allowance for solar variation. Arrhenius did not have data, but the reason the GCMs show solar variability plays little role is a matter of measurement. TSI did not increase by enough to explain anything. That is observation, not assumption.
Nick,
You know better than that! See the attached from AR6, page 961. If this doesn’t convince you, the following quote from the next page should:
Clearly -0.02 is indistinguishable from zero.
All this, when we know from Judith Lean that the surface temperature change over one 11-year solar cycle is 0.1 deg C (5x the above) and in the upper atmosphere the change is 0.3 deg. C or 15x higher. It is gross negligence.
More in part 3, stay tuned.
“If this doesn’t convince you, the following quote from the next page should:”
Missing the point again. Yes, there was little change due to TSI. That is because there was little change in TSI, not because the models are insensitive to it. And volcanic emissions are small. And yes, there is a small cyclic change, period 11 years. But it is cyclic and adds to nothing.
I will explain more in the next post, but the bottom line is that a small change in irradiance does not necessarily mean a small change in climate. This is for a number of reasons. You are thinking thermodynamically, which is an oversimplification of the climate system. The changes in climate (e.g. storms) that we experience are dynamic.
One of the reasons AR6 likes to talk in terms of global average temperature and equate that to climate, is they can avoid the complex issues of a real planetary atmosphere, an atmosphere with convection and circulation, issues that cannot be explained thermodynamically, more on that in part 4.
Let’s bring up this again after you’ve read post #3. I’ll put it up Sunday morning with any luck – I guess that will be your Sunday evening.
As for your “cyclic comment” I deal with that also. We do not know what the TSI was during the Maunder Solar Grand Minimum, just that it was a lot lower than today in terms of its effect on climate, which is our only available metric.
We can be very sure that changes in TSI, Watt-per-Watt affect climate much more than changes in GHG back radiation.
Why would 1 W/m2 of radiative force from solar have any or more less affect on climate than a 1 W/m2 radiative force from GHGs?
minor point but the forcing mechanism is thought to result in different climate response. This does not imply that I endorse a dominant TSI mechanism. I don’t. Table 1 α column. https://agupubs.onlinelibrary.wiley.com/doi/full/10.1029/2003GL018747
Excellent article. In the HadCM3 experiment the same solar forcing resulted in a 60% smaller sensitivity than the CO2 forcing. There’s not much of explanation as to why though. I’ll have to dig deeper on this. Thanks for the awareness.
agreed. although for clarity it is meant to represent solar absorbed, as opposed a solar forcing per se.
i realize my statement could be nit picked within the context of the article but the value is typically associated with any force or feedback which changes the transmission of insolation.
Also its a 20 year old AOGCM. The slab model had the opposite result.
The frequency content. More in the next post.
Looking forward to it!
Why indeed? And while you’re explaining that, maybe you can explain how a total radiative forcing of 7.0 W/m^2, including all GHGs, aerosols and land use changes, would result in an additional 20.0 W/m^2 of IR being emitted by the surface.
https://wattsupwiththat.com/2024/02/23/a-curious-paleo-puzzle/#comment-3872410
One easy consideration is that solar radiation contains energetic frequencies that penetrate MUCH further into water than any GHG radiation possibly can and, if absorbed, cannot be re-radiated out of the water.
Whether they penetrate 1m or 10, the heat all has to come out again, else the ocens would boil in a few years. Of course the SW doesn’t re-radiate as SW, but as thermal IR, regardless of its original frequency.
By penetrating the ocean surface, the shorter solar frequencies have a longer residence time in the climate system, same with changes in TSI. Longer residence time of the energy affects both total thermal energy content and temperature. This is why solar forcing, Watt per Watt is more powerful than GHG forcing.
“ the shorter solar frequencies have a longer residence time in the climate system”
So what is the residence time? A few extra metres at the speed of light? Nanoseconds at best. How can that affect anything?
In terms of the heat flux at the surface it makes no difference. Heat goes in, heat comes out, maybe with some delay.
When the LW goes in to the depth that evaporation is happening, it makes a huge difference to what happens.
The publication JCM posted says solar forcing results in a smaller climate response watt-for-watt.
The depth of penetration of SW vs LW in the ocean does not effect residence time in the climate system since all depths of the ocean are contained within the climate system. I suspect you actually meant to say SW has a longer residence time in the ocean which could be true.
I just wonder how much it really matters since a significant amount of the energy is still taken in the mixed layer where it is turbulently mixed.
You’re around 5 orders of magnitude out there, Nick. The LW penetrates the ocean in the order of micro meters.
https://www.researchgate.net/figure/Characteristic-penetration-depth-of-radiation-into-liquid-water-at-different-wavelengths_fig1_365651992
He’s talking about shorter and longer solar wavelengths, and specifically the extra penetration of very short. There isn’t much energy in incoming solar >2µm anyway.
OK, well then…
The whole of anthropogenic climate change theory is based around longer residence time.
Another consideration is that solar warming does not cool the stratosphere like what GHG warming does.
Re:
Well you said
And you’re answering your own question now.
Because actual energy changes and passive energy changes will have different effects on feedbacks.
The answer to your question is because the sun’s radiative force can do work and the GHG’s can’t.
They both do equal amounts of work; just in different ways.
The work-energy theorem states that the work done on an object is equal to the change in the kinetic energy of that object.
CO2 doesn’t overall change the kinetic energy of the atmosphere, it just changes where the energy is. The same energy flows through the system as it always did.
Whereas additional energy from the sun, does change the kinetic energy of the atmosphere.
Andy,
You may find this useful regarding the roles of water vapor and CO2 and GW
The Greenhouse Model and CO2 Contribution
https://www.windtaskforce.org/profiles/blogs/the-greenhouse-model-and-co2-contribution
Dr. Cyril Huijsmans, a Dutch Research Scientist Retired from Shell
.
The Greenhouse model, as is universally presented, appears to be incorrect.
Molecular collisions and convection, rather than re-radiation back to earth, is the energy transfer mechanism.
The black body radiation of the earth, after absorption by greenhouse gases, is quickly converted into kinetic energy, and becomes part of the thermal pool of the atmosphere.
The atmosphere should not be treated as a black body radiator, as there is no thermodynamic equilibrium. Even for a local thermodynamic equilibrium, one cannot define its boundaries in the sense of the premises of Planck’s law.
Furthermore, the maximum possible contribution of CO2 to the greenhouse warming is limited to about 7% of the total warming potential from black body radiation.
This is solely based on the black body energy availability from Planck’s energy distribution in the range of the CO2 absorption wavelengths.
To achieve this maximum possible contribution, about 0.15% of the current presence of CO2 molecules in the atmosphere would participate, i.e., less than 1 ppm of CO2 concentration in the atmosphere.
Water vapor, WV, is the most important greenhouse gas and contributes about 93% of the greenhouse warming.
With the current concentrations of WV and CO2, the black body energy is fully absorbed, i.e., saturated.
.
NOTE: These articles have similar results using WV and CO2 ppm in atmosphere.
https://www.windtaskforce.org/profiles/blogs/hunga-tonga-volcanic-eruption
https://www.windtaskforce.org/profiles/blogs/natural-forces-cause-periodic-global-warming
The Huijsmans work seems very credible in its treatment of radiatively excited CO2 decaying by collision rather than radiation until it reaches the upper troposphere.
He showed, very small percentages of the CO2 and WV ppm are needed for total absorption of the available photons at their unique frequencies, i.e., the part of the remaining ppm that gets excited is de-energized by collisions
Has it been published in the ‘literature’? I can think of billions of reasons why it hasn’t, none of which have anything to do with science.
It was originally posted on LinkedIn with many typos and poor English, and some errors.
I spent some time cleaning it up, and breaking it up in sections, so it would be easier to read.
Even though I understand the physics, it is a dense subject, because some parts of higher level physics were not taught in graduate school at RPI, at that time, the late 60s.
Based on views, there seems to be quite a lot of interest after the clean up.
I am hoping Dr. Happer, etc., will look at it
The air-earth interface is effectively at equilibrium. Air behaves as an ideal gas at the earths surface by following pressure and temperature relationship, thus independent of composition – in including CO2.
So yes indeed, convention and conduction via mass density moves the heat.
https://youtu.be/wzK27AcnS0g?si=GhwGk3xNXSNV2lOM
Nick I would like to further investigate your hypothesis that TSI only creates small, cyclic changes.
Can you please direct me to the TSI data for the period of the Holocene Climatic Optimum for the years 9,500 to 5,500 BP?
Here are two that I just randomly selected. There are others. Note that reconstructions going back that far do not attempt to quantify the short term (11 yr cycles) cyclic changes that Nick was talking about but you can at least see the long term variation.
[Steinhilber et al. 2009]
[Vieira et al. 2011]
Here’s a proxy reconstruction back to the MWP.
With projections added to about the end of the century.
“That is because there was little change in TSI”
Solar induced ionization in the upper atmosphere varies by more than a factor of two in the course of a sunspot cycle, so it is not out of the question the climate response to changes in the sun may be greater than what would be expected based solely on changes in TSI. A possible mechanism is the increased UV stimulating production of GHG’s in the upper atmosphere.
My take on the solar influence is “the jury is still out” as I’ve seen compelling arguments on both sides of the argument.
Dear Andy,
Which Judith Lean paper are you referring to?
One of her papers (I think it was Lean, J.L. and Rind, D.H. 2008, but I will have to look it up again) was nonsense.
Greg Ayers made the same mistake that they made in his paper:
Ayers. Journal of Southern Hemisphere Earth Systems Science (2017) 67:1, 2-11 DOI: 10.22499/3.6701.001.
Their independent factor ANTH embedded the same trend as deltaT, which was the dependent variable. Hence the high R^2 value. (If you expand ANTH you will see what I mean).
Yours sincerely,
Dr Bill Johnston
http://www.bomwatch.com.au
I was referring to Lean, 2017:
Sun-Climate Connections | Oxford Research Encyclopedia of Climate Science
It’s her article for the Oxford encyclopedia.
Thanks Andy,
I can only read the overview of the Lean 2017 paper so I can’t comment on how realistic it is or how she calculated her numbers. Also, I can’t see the references. If you are relying on the paper, I would advise you download it in full and try to understand where her numbers come from.
Here is part of a discussion I had with an eminent scientist in August 2016:
Dear ???? you don’t need a paper so-badly that you publish one that is faulty or questionable.
MEI, ….. is not independent of deltaT. Also, ANTH, which I had not looked at in detail before is entirely modelled: “data” are “harmonised”, whatever that is, and who would know if there are any reliable numbers behind them.
Furthermore, I’ve just read a post and most of the comments by Tisdale on WUWT relating to Forster & Rahmstorf (https://wattsupwiththat.com/2012/01/02/tisdale-takes-on-taminos-foster-rahmst).
F&R include a “linear time trend to approximate the global warming that has occurred during the 32 years subject to analysis, but they don’t say or are vague about what this linear time trend is or where it comes from. The approach is contentious. (Although its hard to take it all in a single read, a comment near the end by Manfred Jan 9, 2012 at 2:02 am, seems to present a condensed overview.)
In Lean & Rhind there is no year or deciyear, thus no time coefficients. A (ANTH) is graphed over time, thus it embeds time as pseudo-trend inserted as an independent variable. (Lean & Rhind describe ANTH as: The anthropogenic influence, A, is the net effect of eight different components, including greenhouse gases, land use and snow albedo changes, and (admittedly uncertain) tropospheric aerosols.)
[If you chase down ANTH it disappears into the murk that is a paper by Hansen et al (Clim Dyn (2007) 29:661–696 DOI 10.1007/s00382-007-0255-8), which has 37 co-authors (amongst them being Rhind). The paper is a simulation exercise, involving much bullshit-baffles-brains reasoning, including pages of graphs as big as postage stamps representing the whole world.]
Yours sincerely,
Bill Johnston
http://www.bomwatch.com.au
Part 2 of the above reply:
In another part of the discussion, I said:
I read the JL paper; there is another Lean & Rind attached. Solar is highly variable; its also smoothed and filtered by the atmosphere and not much of that variation gets inside a Stevenson screen. JL also makes the point that she is looking at relatively small variations in a mass of cycling noise and admits there is a need for greater precision. She used SD to specify uncertainties, and builds a model using off-the-shelf data:
T ~ Volc + (ENSO_MEI) + ANTH + Solar (So that’s the JL model; also used by Foster and Rahmstorf, isn’t it?)
I tried to see what the off-the-shelf components were:
MEI ~ SLP + wind + Tland + Tsea + cloud
ANTH ~ CO2 + CFC + aerosols + land use + snow albedo
I don’t know anything about relative weightings, but its obvious T is on both sides: T ~ Tland + Tsea + … and therefore likely to grossly inflate R2; and if all the separate terms were tossed-in together, many may not be significant. I would expect poor direct T correlation with wind, SLP, cloud, land-use, snow albedo; and high correlation of T with Tland & Tsea.
There is a problem isn’t there? T is being used to predict T! <<<——- NOTE
Foster and Rahmstorf did the same thing, how incredible is that? Some of the factors in MEI and ANTH, must actually reduce T’s sensitivity to Tland & Tsea.
We need to be very careful that out terms are independent; also, that indices are data per se. and not describing a process. SOI does not have a true frequency for instance; however, as years pass, the more likely it is that another will happen (it has a return period). Some say it is internal to the climate, some say exogenous; which is it??
….. rules/assumptions are important if we are using a statistical approach. It’s misleading to confuse cause and effect (the classic nonsense that low rainfall is caused by high temperature); or use inflated measures of confidence (r and R2). It’s also important not to confuse trends and steps (inhomogeneties) and to remove cycles that mesh; when the data are actually random.
My take on all this from 2016 to now, is that solar represents a very big number, that due to other influences shows variation that is measurable, but the coefficient of variation (Variation/TOTAL*100) is so small as to be irrelevant in the overall scheme of things.
I have a model that calculates TOA radiation by latitude and day-of-year.
Compared to the Bureau’s Solar exposure for a particular place, transitivity works out to be about 0.6*TOA, can be 0.4 or 0.7, depending on season, aridity etc, but it is about 0.6. Given everything else, I expect delta-transitivity probably drowns-out the relatively tiny interannual or even cyclic variations in TOA as they may affect temperatures measured in Stevenson screens.
All the best,
Bill Johnston
http://www.bomwatch.com.au
Bill,
I’ve had the full paper for many years, I don’t even remember who sent it to me. If you want a copy, email me, I can send you a copy one on one. My email is on my web site.
Thanks Andy,
I have a folder of papers by Judith Lean et al, that in response to discussions with someone else I studied in 2016. So thanks for the offer but I will leave it for now.
For the reasons I outlined, I came to the conclusion that her methods were not statistically valid.
Yours Sincerely,
Bill Johnston
Those GCM’s do a good job of modelling ice ages and the inevitability of the next one. What’s your prediction on the arrival date and what will cause it?
Only one thing is certain in climate science about the onset and disappearance of ice ages –
the sun has nothing at all to do with them.
(when I say “sun”, I mean the modeled sun, not the real sun. The real sun starts em up and shuts em down at its whim.)
“The real sun starts em up and shuts em down at its whim”
Only under the control of Milankovitch cycles
‘Those GCM’s do a good job of modeling ice ages…’
???
See [Willeit et al. 2019] as an example.
Nonsense. Are you not aware that temperature change lead CO2 change throughout the Pleistocene ice core record?
Yes. I’m aware of the timing relationships between CO2 and temperature during the Pleistocene era which, I suspect, is more nuanced than you realize.
Anyway, that is irrelevant. What specifically are thinking is nonsense?
‘What specifically are thinking is nonsense?’
I didn’t have to read very far into the abstract to find this gem of ‘control knob’ nonsense:
‘The long-term CO2 decrease leads to the initiation of Northern Hemisphere glaciation and an increase in the amplitude of glacial-interglacial variations, while the combined effect of CO2 decline and regolith removal controls the timing of the transition from a 41,000- to 100,000-year world.’
Perhaps your friends have never heard of plate tectonics and the closing of the Panama Seaway, but then, they are affiliated with the Potsdam Institute.
They are talking about the mid-Pleistocene period (it’s in the title), well after the closing of the Panama SEaway.
I thought that quoting ‘initiation of Northern Hemisphere glaciation’ would be sufficient to convey the geological time frame.
Please allow me to make my point even more obvious by including the prior two sentences:
‘Here, we present transient simulations of coevolution of climate, ice sheets, and carbon cycle over the past 3 million years. We show that a gradual lowering of atmospheric CO2 and regolith removal are essential to reproduce the evolution of climate variability over the Quaternary. The long-term CO2 decrease leads to the initiation of Northern Hemisphere glaciation and an increase in the amplitude of glacial-interglacial variations, while the combined effect of CO2 decline and regolith removal controls the timing of the transition from a 41,000- to 100,000-year world.’
So how do you think plate tectonics and the closing of the Panama Seaway affect that timescale?
Over the entirety of the Quaternary? Sure, why not?
They correctly modeled both CO2 and T with enough skill that even the mid-Pleistocene transition from 41k to 100k glacial cycles. That’s hardly what I’d describe as “nonsense”.
That has nothing to do with the publication.
‘They correctly modeled both CO2 and T with enough skill that even the mid-Pleistocene transition from 41k to 100k glacial cycles.’
Oh, please! The transition occurred because the NH cooled to where whatever warming was triggered by the Milankovitch cycles around 41k was no longer able to cause a significant reduction in NH glaciation.
Your friends insist that the transition occurred because of reduced CO2, which ignores the inconvenient fact that temperature changes LEAD CO2 changes.
A more rational explanation would be that the same closure of the Panama Seaway that initiated NH glaciation would eventually cause NH glaciation to increase until negative feedback, e.g., a reduction of ice albedo due to increasing dust cover, caused the 100k cycle to become dominant.
‘That has nothing to do with the publication.’
Of course not. And CO2 has nothing to do with NH (or SH) glaciation.
A 3 million year simulation. How accurate do you think that model is?
It looks reasonably accurate to me. It correctly simulates both CO2 and T and the mid-Pleistocene transition from 41k to 100k glacial cycles.
You mean at some arbitrarily low resolution the fit correlates?
’Accuracy’ is irrelevant to the Alarmists. The point is that any valid challenge to the narrative literally has to be papered over in the Alarmist-controlled literature.
The Potsdam Institute should relocate to the Netherlands where they could do something useful like plugging holes in dikes.
The model temperature is in green, the proxy temperature is in black. This is from Javier Vinós‘ first book.
WRONG, It has been shown that the important UV range changes a lot more.
It is the penetration of energy into the tropical oceans that warms the planet.
It has also been shown that absorbed energy continues to increase because of cloud changes etc.
Models know absolutely ZERO about any of this.
Exactly, some of the solar frequencies penetrate the ocean surface. None of the GHG frequencies do. More in part 3.
The greenhouse gas hypothesis does not account for the LIA, or the Medieval Warm Period, so something else is going on.
Your figure 1 has an important feature, the T rise from roughly 1915 to 1945. The SPM to AR4 WG1 had a very important figure 4. In an attempt to prove that the post 1975 rise was attributable to CO2, they inadvertently ALSO showed that the rise from 1915-1945 WASN’T. Direct admission of naturally variable temperature rise. Natural variability also shows up in the T decline from ~1945-1975 despite rising CO2.
BIG logical problem for the IPCC and its SPM is that one cannot assume natural variability magically stopped in 1975—yet that is exactly what they do. Oops.
It’s hilarious how they twist themselves into knots trying to justify their 100-year-old hypothesis. It must be very painful for them.
They must have a high pain threshold, particularly as mother nature is a major CAGW denier !!!
They get paid to take the PAIN
Can you post the page number where the IPCC said that natural variability magically stopped in 1975? I’d like to review that if you don’t mind.
Posted the AR4 WG1 SPM fig 4 chart in a previous WUWT post on this same topic. You can find it here if you search hard enough on this topic under my many previous posts from years ago. As always, footnote referenced.
You also have had the specific coordinates since my comment to look it up via Google for yourself. Go to |AR4 WG1 SPM fig4| ( or something like that) and voila there it is. The SPM is an official public record. Cannot be altered ex post. The text accompanying the figure gives the logical fallacy context. Indelible.
Do your own homework, like I did mine.
No where in that graphic does it say natural variability stopped magically or otherwise in 1975. On the contrary you can clearly see that natural factors (in blue) continue through the period of analysis.
The is no climate change in GCM control runs. The result you’re quoting is by definition.
Irrelevant. The graphic clearly shows natural forcings continuing past 1975.
What do you mean irrelevant? The natural forcings are
“models using only natural forcings”
…and that’s a control run. At best. The only other possibility is a run with aerosols and that again by definition is at most neutral climate change or more probably decreasing temperatures because that’s what the models are designed to do.
The problem is much bigger. The NH had basically all the pollution (and still has). If the IPCCs relation of warming GHGs and cooling pollution was to hold true, the NH should only have cooled until the mid 1970s. No warming before 1945, none thereafter! And that is the beauty over Mann’s “hockey stick”, that portrays NH warming. It proudly presents a warming right after 1900. This should never have happened.
It would seem most involved in climate research have never really understood just how H2O magically exists at the bubble point of 4 states of matter on this planet and is in complete control of climate in all four states. Without proof that CO2 has the ability to warm a single H2O molecule to cause this grade school guess about climate sensitivity, a doubling of the rare gas known as CO2 according to its absorptivity spectrum, indicate that a doubling of atmospheric CO2 would equate to something, well less than a 1/10th of a degree of warming.
Hide the decline, hide the decline. I love that song.
Since about the mid-20th century, natural forcing has been in the wrong direction to cause the observed warming:
Thus there is no doubt whatsoever that human activities are responsible for the observed trend. Even if you cast aside all modern GCMs you cannot escape this reality.
That is not an assumption any of the models make. The model warming is produced by the input forcings in concert with the model physics. That human contributions of CO2 are driving the warming trend is an output of the models, not an implicit assumption.
You are assuming that the climate effect is instantaneous, which is highly unlikely. The climate effect may be delayed as much as 60 years in some cases and in some places. It will not occur with the same delay everywhere on the planet. Attached is the effect observed over one solar cycle, trough to peak. Due to atmospheric dynamics the effects are different everywhere.
Climates are different everywhere.
And there’s hundreds of the buggers.
Sure, atmospheric temperatures could be delayed due to the dispatching of energy to/from the various heat reservoirs in the climate system. What isn’t delayed is the total heat uptake of the planet which lines up pretty well with expectations.
“which lines up pretty well with expectations.”
A really stupid comment.
Real temperatures are totally NON-ALIGNED with model fabrications.
Instead of real, use objective measurements, such as by satellites
except observed TOA imbalance is overwhelmingly positive in the SW, and negative in the LW. This does not align with model expectation.
That is because of aerosol reduction and the shortwave feedback…both expected.
not expected no.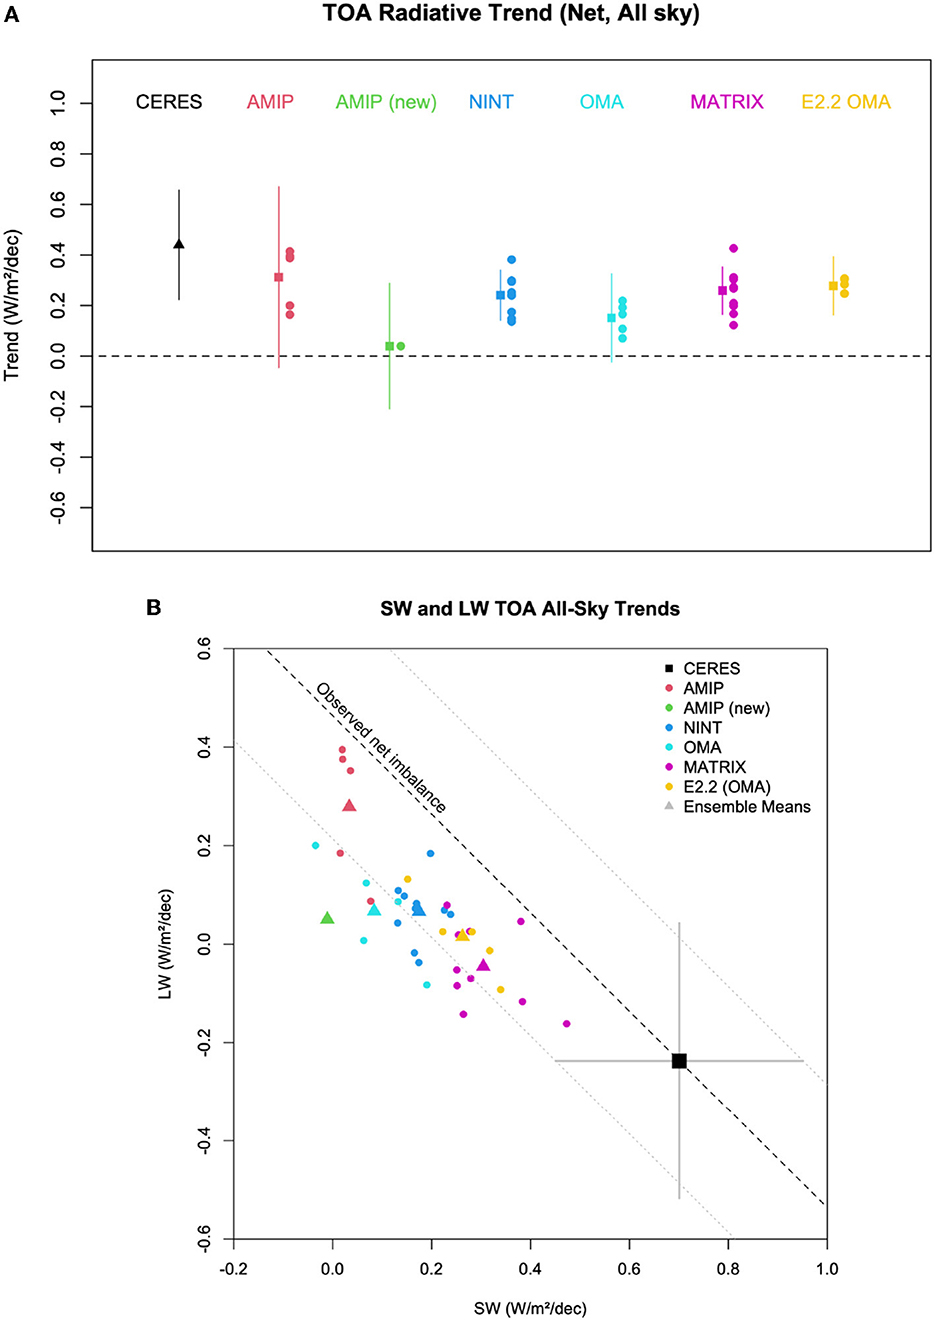
from https://www.frontiersin.org/articles/10.3389/fclim.2023.1202161/full figure 2.
as discussed elsewhere here, the forcing mechanism has important implications for climate response.
You’re own citation says it is expected. Literally panel B of figure 2 all but 2 of the simulations have positive SW trends. [Donohoe et al. 2014] have a more intuitive visual depiction of this in figure 1. Notice that GHG forcing is expected to increase ASR due to the shortwave feedback.
It may well be true that the classical picture of an increased greenhouse effect from increases in greenhouse gases is correct, however, it is getting cancelled precisely by increased surface and atmospheric emission (GFDL AM4 clear-sky LW ERF ∼0.35 W m−2 decade−1 and clear-sky LW λΔTs ∼ −0.38 W m−2 decade−1). Neat coincidence. There can be little doubt that this was not expected. Nor the magnitude of ASR trends, given MATRIX pushes aerosol to the max and still cannot close the gap, nor any other feedbacks illustrated in the atmospheric models depicted. I could not think of anyone more qualified to comment as Schmidt in his own article: “Given the importance of the science questions raised by the recent divergence of models and observations, we think that this should be tackled as early as possible”. I’m not sure where anyone could get the idea that the model-observation divergence was expected. That’s just nonsense.
to further ruffle the feathers of the WUWT crowd, Clauser is obviously wrong as clouds are not stabilizing anything and there is no foundation to suggest they will. He suggests no climate problem but obviously things are changing. Happer is wrong as the greenhouse effect appears stable and stationary in the presence of clouds. The only thing actually happening is cloud disruption, and this is the most unknowable thing going. As Schmidt acknowledged, whatever is going on was not predicted by state of the art models. This cannot be denied.
This is a serious conceptual flaw in understanding climate. It is physically impossible for heat to get from ocean surface to the abyss in a matter of decades. Increase in ocean heat content is a result of more heat retention.
The difference between heat uptake and heat retention is a key distinction that climate modellers have not grasped.
The notion that oceans have uptaken heat below 700m in a matter of decades is unphysical.
Oceans have retained more heat as summer advection to land has slowed as observed by the reducing trend in summer precipitation across the northern hemisphere.
The retained heat in the oceans directly reflects the increase solar input to the global land.
Solar input to land bottomed in 1537. It has been increasing since.and the oceans retaining heat in step with the increase in solar input to land. In 2023 the global land mass received an average of 109TW more than in 1537. The accumulated heat input to land was 1115ZJ. This is not stored on the land but is reflected by the heat retained in the oceans as advection slows down. The oceans are doing less warming of the land. And the warming is increasingly dominated by winter advection; meaning more snow on land below 0C.
Hardly. It’s the 1st law of thermodynamics.
Irrelevant. The capture energy is still in the climate system regardless. Just because it may linger at the surface before percolating downward into the abyss does not in anyway invalidate the fact that the heat is captured somewhere in the climate system instantaneously.
Again – this shows a lack of understanding of the physical process of getting heat into the abyss.
It is not energy being captured through the surface. It is energy that is not being released as fast as it was due to evaporation slowing down as more ocean surface reaches the 30C limit.
Abyssal heat comes from the poles due to the thermohaline potential that drives the circulation this has time constants of up to 2000 years.. The mid-level ocean heat comes from the ocean MOC. These have time constant of hundreds of years.
https://www.nature.com/articles/s41467-021-24648-x#Fig5
Irrelevant. The energy is in the ocean. It doesn’t matter what depth it is at. It’s still in the climate system since the ocean itself is in the climate system.
It is a key distinction that you clearly fail to grasp. The extra ocean energy is due to the water cycle slowing down in the NH summer. There is more energy being retained. That is vastly different to the energy coming in from the surface.
The cause of the water cycle slowing down is due to more sunlight over land. Sunlight over global land bottomed in 1537. It has been trending up since and will trend up for another 9,500 years.
You need to look very carefully at what actually happens. The very surface of the ocean is the coldest part.
https://en.wikipedia.org/wiki/Sea_surface_temperature
The depth at which the DLR is absorbed is colder than the water beneath it.
The energy doesn’t migrate downward warming the ocean. Where the energy is absorbed, is colder than the ocean directly below it. Instead it forms part of the energy the ocean radiates and/or evaporates.
That’s the process. The effect is a warmer ocean because it doesn’t have to supply as much energy from the bulk to radiate according to S-B or to evaporate.
But its important to understand why it happens or you’ll get the wrong idea about how warming occurs and what impacts that.
The alarmists always try to act like the planet is a single thermodynamic object, which it isn’t. Thankfully, AR6 does look at patterns of warming, they don’t see it for what it is, a refutation of their hypothesis, but they supply us with some comparisons. See the attached comparison of model results to actual for the Pacific Ocean. The colors are scaled to match.
AR6, figure 7.14, page 990.
“The alarmists always try to act like the planet is a single thermodynamic object, which it isn’t.”
That’s my point exactly. Thermodynamic intensive properties, like temperature and pressure, apply to the entire system which also must be in equilibrium. If it was in equilibrium, you’d only need one thermometer and one barometer to measure the entire system.
You don’t provide a source, but seem to be suggesting that every pattern of change observed in the graph is directly attributable to the solar cycle, which seems… speculative, to say the least.
Surely there is some delay in climate response to forcing – the ocean is absorbing a lions share of the heat increase resulting from anthropogenic forcing, after all. But that does not ipso facto mean we should always expect a delayed onset for every possible mode of climate forcing.
Nope, not saying that. I’m saying that because most solar radiation is absorbed by the oceans at varying depths, according the frequency, and circulated by ocean currents and the atmosphere, delays vary by location and time.
The climate system is complicated, and it is not a simple thermodynamic object as modeled by the CMIP models.
That is an awfully cavalier statement. GCMs are the most complicated models of climate there is. It’s not even remotely reasonable to say they treat the climate system as a simple thermodynamic object given their profound complexity that touches upon knowledge in many (most?) disciplines of science.
An example of a model that you could reasonable say treats the climate system as a simple thermodynamic object are the 3 layer energy budget models.
The biggest problem is garbage into the system. You never address the information that is not input from measurements but instead are input parameters that are likely not correct over any span of time.
Can a current GCM accurately forecast a El Nino 3,4,5 years from now? Has one of the past GCM’s ever done so? If they can’t, then the earth’s system is not well enough known to make any predictions. GCM’s have predicted a hot spot for what 30 years? It is yet to appear. On that alone, one can say GCM’s are not accurate. If accuracy is lacking, rationalizing it away does not help anyone.
Andy, is trying to tell you that the models just don’t perform well and increasing their complicated coding will not fix anything.
The source is:
The Sun-Climate Effect: The Winter Gatekeeper Hypothesis (II). Solar activity unexplained/ignored effects on climate – Andy May Petrophysicist
figure 2.2
The fact is that there is absolutely ZERO POSSIBILIITY of using urban surface data and coming up with a realist representation of “global average temperature.
The “temperature” in AJ’s post is a totally meaningless fabrication
As is the “natural forcing”
As is the “GHG forcing”….. PURE FABRICATION, based on anti-science conjectures..
The whole chart is a TOTAL FANTASY ! .
Ok red thumb. Please explain how you get a meaningful realistic global temperature from surface sites that are KNOWN to be highly compromised by urban warming and thermometer changes.
This will be hilarious. !! 🙂
How is ‘Natural Forcing’ (green curve) determined? How is it measured or calculated? What physical mechanisms does it represent?
“What physical mechanisms does it represent?”
It doesn’t. any more than the temperature line can even remotely represent global temperatures.
We could make the argument, bnice, that we don’t know anything with perfect certainty and therefore we can never be justified in drawing any conclusions, even tentatively.
A spatially averaged temperature anomaly means something even if it is imperfectly adjusted to account for urban heat island effects and even though it mixes desert anomalies with rain forest anomalies ignoring massive latent heat differences. You can think of it as an index.
As you may recall me saying, there is NO CLIMATE EMERGENCY. The slight warming that this index implies, as through a glass darkly, is wholly beneficial. It doesn’t serve our skeptical case to try to argue that there hasn’t been any warming.
I guess AllanJ doesn’t know the answer, does anyone?
They want the planet to be warming from man made CO2…..therefore, it shall be done…..becuz it means power and money for those who propose to save the planet. H2O is a much more potent GHG but no one can do anything to reduce H2O so CO2 must be the villain. Silence! Do not question Scientists. You must pay the price or you will die.
The Arrhenius quote about “more equable and better climates” is spot on.
Yes! And when old Svante thought 4°C was the number, he was excited about the potential benefits. Later deciding that ECS was lower was a disappointment for him.
Today the alarmists are wetting the bed over maybe having achieved 1.5° of warming.
We don’t have enough fossil fuel left to achieve the redoubling of CO2 (280ppm -> 560ppm -> 1120ppm) that would likely be necessary to achieve the beneficial 4° of warming that Arrhenius hoped for.
That makes sense to a casual observer.
Wiki tells me: “The radiative forcing caused by a doubling of atmospheric CO2 levels (from the pre-industrial 280 ppm) is approximately 3.7 watts per square meter (W/m2). In the absence of feedbacks, the energy imbalance would eventually result in roughly 1 °C (1.8 °F) of global warming. That figure is straightforward to calculate by using the Stefan–Boltzmann law and is undisputed. A further contribution arises from climate feedback, both exacerbating and suppressing”.
Historical temperature proxy studies show the climate has never been in a state of equilibrium, it’s always warming or cooling in response to ‘forcings’ known and unknown.
The IPCC says the warming since the 1950s and ‘many of the observed changes are unprecedented over decades to millennia’ a claim that even the HadCRUT4 graph above shows is false.
Good lead in to my next post, should be up on Sunday.
With respect to the zero feedbacks CO2 doubling case, three data points. Some years ago Judith Curry posted her analysis at Climate Etc. It was 1.1C. In 2011, Lindzen posted his analysis giving 1.2C as part of a talk to the British House of Commons. A few years back, I used Monckton’s published ‘irreducibly simple’ equation (and his numerical inputs to it) to compute 1.16C, neatly between Curry and Lindzen. My calculation is in comments to Monckton posts over at Judith’s.
There is an important sequlae. IPCC WG1 figures say the net of all feedbacks other than clouds and water vapor is about zero (in both AR4 and AR5). Dessler first showed that cloud feedback was about zero, even tho his 2011 paper erroneously (via faulty statistics) concluded it was meaningfully positive. We know the water vapor feedback must be positive. So we know TCR and ECS must be something >1.2C, and NOT less as many skeptics have unfortunately argued.
Rud,
We’ve had this discussion before. I don’t accept the assumption (and it is an assumption) that net feedback is zero or that water vapor feedback is zero or positive. See this post on total precipitable water data.
Atmospheric water vapor (TPW) and climate change – Andy May Petrophysicist
Feedback to warming and CO2 is unknown. Clausius-Clapeyron does not work. Net feedback could just as easily be negative as positive. Climate sensitivity is likely between 0.5 and 1.5, but no one really knows. 1.2 is a reasonable guess, but less than one is possible. Remember Nic Lewis’ work assumes that all the warming since 1870 or so is due to additional CO2, he does not consider the possibility that something other than the AMO has any influence.
“We don’t know” is the correct answer.
I developed great respect for a retired physics professor who gave a series of lectures about the scientific method at our local (woke) university.
His response to so many questions (actually assertions) about climate behaviors was –
“we just don’t know”
It is indeed unfortunate that you can take two aspects of feedbacks, neither of which are particularly well understood, ignore the myriad other feedbacks and come to such a strong conclusion.
Post says:”…using the Stefan–Boltzmann law…”.
What is the correct emissivity for CO2 at present part pressure and altitudes from surface to 30,000 feet? If your going to use SB you need to know n this.
I don’t deal with Stefan-Boltzmann in this post, that is the next post, up tomorrow.
But Mr. Hanley did.
The quote is from Wikipedia, take it up with them.
Which was probably written by the Google AI.
“Arrhenius’ conclusions were mostly accepted as the world warmed from 1908 to 1945…..”
I’m not so sure that his model was so well received. August Krogh who went on also to earn a Nobel Prize was skeptical. I only know about this because after Krogh briefly worked on atmospheric gases he maybe did the easier and became famous with his work on osmoregulation in marine animals. I had to learn about his 1939 book, reprinted in 1965.
(Wang, T. and M. S. Hedrick. 2021. Introduction to the special issue: Comparative physiology and the legacy of August Krogh, 1920–2020. Comp. Biochem. Physiol. Part A:Mol. Integrat. Physiol. 256:110930. https://doi.org/10.1016/j.cbpa.2021.110930). I was curious and easily found this. (Krogh, A. 1904. The abnormal CO2 – percentage in the air in Greenland and the general relations between atmospheric and oceanic carbonic acid. Meddelser om Grönland. 26(7):409-434.)
Also Moberg, et al., 1934 (The buffer mechanism of sea water. Bull. Scripps Inst. Ocean. 3(11):231-278.) cited Krogh but don’t recall the details. We have been living in a ‘homework desert’ at least in some areas for a long time but maybe some references knew about this.
Interesting that Svante Arrhenius was elevated as the founder of AGW belief system. He was ignored for many decades after Knut Ångström and his assistant Herr Koch showed that reducing CO2 concentrations did not affect the amount of IR absorbed by the air. That’s almost as interesting as discovering that shutting down the global economy over fear of Covid19 had little effect on atmospheric CO2 concentrations.
As a fellow Scandinavian, Ångström agreed with Arrhenius that his projected warming would be a good thing, even in the lower estimates Svante made later on. Still, Ångström had two objections to Arrhenius’ conjecture about global warming from increasing CO2. In 1900, Herr J. Koch, laboratory assistant to Knut Ångström, did not observe any appreciable change in the absorption of infrared radiation by decreasing the concentration of CO2 up to a third of the initial amount. This result, in addition to the observation made a couple of years before that the superposition of the water vapour absorption bands, more abundant in the atmosphere, over those of CO2, convinced most geologists that calculations by Svante Arrhenius for CO2 warming were wrong.
Ångström’s 1900 paper (english translation) was About the importance of water vapor and carbon dioxide during the absorption of the Earth’s atmosphere Title is link to pdf.
Conclusion:
Under no circumstances should carbon dioxide absorb more than 16 percent of terrestrial radiation, and the size of this absorption varies quantitatively very little, as long as there is not less than 20 percent of the existing value. The main alteration caused by a decrease in atmospheric carbon dioxide content, is that the absorption exerted by the carbon dioxide (about 16 percent of the radiation) is only completed by a thicker atmospheric layer, so that the heat is a little more dispersed in the atmosphere.
Thanks!
In ähnlicher Weise berechne ich, dass eine Verminderung des Kohlensäuregehalts zur Hälfte oder eine Zunahme desselben auf den doppelten Betrag Temperaturänderungen von -1,5° C. bzw. +1,6° C. entsprechen würde.
Similarly, I calculate that reducing the carbon dioxide content by half or increasing it to twice the amount would correspond to temperature changes of -1.5° C. and +1.6° C., respectively. http://treibhausdenker.de/arrhenius/1906/index.html
Andy, Arrhenius’ estimate of the climate sensitivity to a doubling of CO2 of 4°C, falls within the IPCC AR6 estimate of the likely range of this value, which they abbreviate as “ECS” or the equilibrium climate sensitivity.
Noticed you didn’t reference the 1906 Arrhenius paper where he amended his view of how increased carbon dioxide would affect climate. Might be because he published in German and it was never translated until 2014.
The Probable Cause of Climate Fluctuations – Svante Arrhenius
A Translation of his 1906 Amended View of Global Warming
A more detailed account of the low emission of CO2 is taken into account, the details of which are in my 1901 research.* Of the 22.5% of the Earth’s radiation which is absorbed by the atmospheric CO2 in the present state, 3.8% is re-emitted from the CO2 into the atmosphere, so that the real reduction of the Earth’s radiation would be 18.7%. Rather than the current temperature of 15 degrees C = 288 degrees absolute, we have, with the disappearance of CO2, an absolute temperature T, where:
T4 : 288 4 = (1 – 0.187) : 1
whereby T = 273.4 abs. = 0.4 degrees C
The current quantity of CO2 would then raise the temperature of the Earth’s surface to 14.6 degrees C; its disappearance from the atmosphere , would consequently cause a three times greater temperature reduction, which is characteristic of the Ice Age.
In a similar way, I calculate that a reduction in the amount of CO2 by half, or a gain to twice the amount, would cause a temperature change of – 1.5 degrees C, or + 1.6 degrees C, respectively.
https://www.friendsofscience.org/assets/documents/Arrhenius%201906,%20final.pdf
A lie that just keeps on going, despite being refuted so often. What they never quote is the very next sentence:
“In a similar way, I calculate that a reduction in the amount of CO2 by half, or a gain to twice the amount, would cause a temperature change of – 1.5 degrees C, or + 1.6 degrees C, respectively.
In these calculations, I completely neglected the presence of water vapour emitted into the atmosphere.“
or the real conclusion further down
“For this disclosure, one could calculate that the corresponding secondary temperature change, on a 50% fluctuation of CO2 in the air, is approximately 1.8 degrees C, such that the total temperature change induced by a decrease in CO2 in the air by 50% is 3.9 degrees (rounded to 4 degrees C). “
Sorry Nicki, but to get those numbers you have to increase / decrease Water Vapor by 50%.
Under the assumption that water vapour is distributed in the atmosphere as indicated by the calculation by v. Bezold from the results of the German air ships, I have determined the decrease by water vapour of the Earth’s radiation. Because of the high concentration of water vapour in the lower air layers, the radiation is not reduced by the action of the water vapour in the same proportion as it is by the action of CO2. The calculation shows that under the conditions of the quantity of water vapour in our atmosphere, almost exactly 1/3 of the radiation absorbed by the atmospheric water vapour is retained. The average water vapour content of the whole atmosphere corresponds to approximately an absorbent layer 4 cm in length. Thus the water vapour would reduce the Earth’s radiation by 1/3 x 61.6 = 20.5%. If one uses this correction, one finds that with a change in the quantity of CO2 in the ratio of 1:2, the temperature of the Earth’s surface would be altered by 2.1 degrees. It is assumed that the radiation that is absorbed by the water vapour is not influenced by the CO2.* 8
Added to this is still the increased heat protection through the uptake of water vapour. The water vapour in the atmosphere does not only keep back the Earth’s radiation, but also absorbs a large part of the solar radiation. This last circumstance works in opposite directions, but not nearly as vigorously as the former. For this related correction, I have used the data of Ångström and Schukewitsch. * The calculations show that a doubling of the quantity of water vapour in the atmosphere would correspond to raising the temperature by an average of 4.2 degrees C. For this disclosure, one could calculate that the corresponding secondary temperature change, on a 50% fluctuation of CO2 in the air, is approximately 1.8 degrees C, such that the total temperature change induced by a decrease in CO2 in the air by 50% is 3.9 degrees (rounded to 4 degrees C). My first calculation of this figure gave a slightly higher value – approximately 5 degrees C. In this older calculation, the influence of CO2 was too large, for that the influence of water vapour was valued too low, as Ekholm already commented. This situation was caused in general from Langley’s data, where the quantity of CO2 increases with the quantity of water vapour, so that a slight shift in favour of one results in experimental errors. However, the resulting errors compensate each other for the most part.
To get your 3.9 rounded to 4, you have to double the water vapor content. Don’t see that happening long term on a continent sized area.
Question: Could the warming of the 1930s have aftershocks in climate metrics? Or is everything treated as contemporaneous.
If I understand your question correctly, everything is treated as fairly contemporaneous. I know that is true for the various climate model documentations I have dug into in depth. I cannot think of a non-model example that isn’t.
There is a different sort of climate ‘aftershock’ that Tony Heller goes after frequently over at his ‘RealClimateScience’. The warming from ~1915-1945 is most inconvenient for alarmists, so a lot of places like NOAA and NASA GISS cool the past to remove it in their ‘adjusted’ datasets.
This probably arises from the same reason that the estimate of temperature rise from a doubling of CO2 is 1.5°-4.5° and has been in every IPCC AR since the first one.
What other field has made no progress on their central question in 30 years?
And why have the climatologists failed despite huge investment, growth in numbers of researchers and new information from ARGO buoys and satellites?
Is it because climate is too complex to be modelled at all?
Is it because the climate is just a chaotic random walk that needs a huge range to capture all possibilities, for 30 years at least.
Is it because the basic premise of the models is wrong?
Is it because the climate scientists are just not very good at what they do?
The last one certainly explains the divergent models.
No. The funding is driven by a belief and the research outcomes support that belief.
If there was more focus on real physics than conceptually flawed nonsense then the money spent would be providing useful insights.
Why have they persisted down this blind alley so long? Clearly, they have failed, why persist? Money and power, I suppose.
‘Clearly, they have failed, why persist?’
The Alarmists have certainly failed to produce any evidence that our CO2 emissions have caused any warming beyond natural variation, but there’s no doubt that they have succeeded wildly in obtaining money and power to support the Left’s goal of destabilizing Western civilization.
They have failed to model the climate, sure. But that was never their objective.
No, they have not failed in their objective. They have built and are sustaining a multi-trillion dollar wealth transfer engine, hollowing out the West of its industrial base and empowering hostile adversaries.
So yes, money and power.
When I think of all the resources that have been put into modeling, salaries, computers, IPCC, why has none of it has resulted in the betterment of the inputs to the models, i.e. weather stations?
I don’t agree that temperature is an adequate proxy for the amount of heat being moved around the globe. When dry deserts and humid water regions can have similar temperatures something is amiss. Enthalpy is the only measurement that explains the amounts of heat that is at any location at any time. Even Tmin is more controlled by the dew point that actual energy being radiated.
1980 saw the advent of better thermometers but little attention to siting of them. As far as I know, the U.S. is the only nation that has created a network of stations with attention to limiting UHI. Why is that? Using data that is truly unfit for purpose is a precursor to failure of anything to do with analysis. You can put lipstick on a pig, but it is still a pig. You can “adjust” or “correct” all the data you want to show what you want, but you’ll still have unfit data to use.
A global ΔT that does not use a global baseline absolute temperature essentially equates a 1 degree rise at -50 and 0% humidity as having the same impact as 1 degree +80 at 60% humidity. It is no wonder no one can make heads or tails of what is truly occurring.
Jim,
As I commented to bnice2000 further up-thread, it’s unfortunate that we don’t account for latent heat (or enthalpy) and ask the question whether there is an increasing or decreasing trend in enthalpy
But the anomaly metric serves as an index that tells us something albeit an uncertain picture of reality.
When alarmists quote Arrhenius’ work as proof that the “science is settled” regarding the effects of CO2 in the atmosphere, they never seem to include the quote below:
“By the influence of the increasing percentage of carbonic acid [CO2] in the atmosphere, we may hope to enjoy ages with more equable and better climates, especially as regards the colder regions of the earth, ages when the earth will bring forth much more abundant crops than at present, for the benefit of rapidly propagating mankind.”
Andy, it is remarkable to me that the Le Châtelier Principle (LCP) does not get mentioned as a factor in the models or even in a discussion on the atmospheric/oceanic dynamics. LCP states that in an interactive system of components (T°, P, V, Chem composition, biological actors, oceans, enthalpy components, …) if one of the components is perturbed by a ‘forcing’, say an increase in T°, all the other components of the system react to resist the change and the resulting final change is lower than was expected from ceteris paribus models (or lab experiments).
When IPCC model predictions proved to be 300% too high compared to observations (Gavin Schmidt: “Models are runninga way too hot and we don’t know why.”) I suggested that models needed to incorporate an LCP coefficient of ~0.33 into their models. Arhenius’s lab experimental 4°C could be reduced to a respectable 1.33°C per doubling of CO2.
LCP is not a maybe. Here is a simple example beyond dispute. If you heat the atmosphere by any means, one of the myriad changes is the atmosphere expands, which is a cooling process. Another: warming of the atmosphere promotes photosynthesis in plants and phytoplankton. Photosynthesis is an endothermic reaction which means it cools. These examples are not in dispute.
That adding CO2 (change in chem composition of atmosphere) stimulates plant growth using up ~30% of the added CO2, and increased solution of CO2 in the oceans, removing another 30% of additions to the atmosphere, where, in turn, it increases the mass of plankton, are also not in dispute.
If we go looking for the CO2 we emitted to the atmosphere and only find half or less of it there, is it too much of a stretch to find only a third of the expected T° anomaly we calculated?
Neither – all natural warming. A result of the precession cycle and the distribution of land over the globe.
The solar intensity over global land bottomed in 1537. It has been trending upward since then with some slight acceleration. The land surface temperature is well correlated to the accumulated solar energy on land per attached.
Oceans warm the land on average but oceans are limited to 30C so retail more heat due to reduced evaporation once adjacent land reaches 30C.
Four precession cycles back, the earth was in a similar state and that marked the shift to glaciation. One cycle back, the ice shelves started breaking off and the rising sunlight over the NH resulted in deglaciation because the ocean surface could not warm enough to produce the snow needed to overcome the rapidly increasing melt as rising oceans destabilised ice shelves.
You will see that summer precipitation in the NH is declining as more ocean surface goes to the 30C limit. But winter precipitation is increasing as warm oceans advect heat to the land and it results in more snow. It is only a matter of time before the snowfall overtakes the snow melt.
All climate models warm the lower southern latitudes and cool the high northern latitudes relative to measured. These gross spatial errors are explained by understanding the precession cycle and the distribution of land across latitudes.
The land surface temperature change is most pronounced in January in the high northern latitudes per attached. This is where “global warming” is occurring and consistent with accelerating winter advection. Greenland is gaining elevation at 17mm per year and will reach 100% permanent ice cover by 2100.
The northern oceans are 500 years into a 10,000 year warming trend. The land will eventually cool once the ice accumulates again causing increase in land elevation and decrease in water elevation so the lapse rate causing increasing difference between ocean and land temperature.
Dear RickWill,
But your own work shows the 30 degC limit is due to precipitation – that is the feedback. So how can precipitation be declining while the 30 degC limit remains the same??
Also how can the ocean ‘advect’ heat to the air, when over most of the globe (particularly the tropics), Air-T is warmer?
All the best,
Bill
Here is their model. I see more than just CO2 controlling things.
Again, there is no evidence that there is any effective radiative forcing from CO2.
The IPCC model is based on NON-FACTUAL suppository nonsense.
Thanks Andy! Another great post.
What if we could measure and visualize the longwave radiation emitted by the planet in, say, one of the regions of the IR spectrum where incremental CO2 should produce its “warming” effect? We could see how the emitter works, and assess whether it is likely to ever be able to isolate this effect for reliable attribution of reported surface warming.
Oh, wait, we DO have such capability from the imagers on geostationary satellites. This is band 16 for NOAA’s GOES East satellite. NOAA calls it the “CO2 Longwave IR” band. This link is for an 8 hour animated time series.
https://www.star.nesdis.noaa.gov/GOES/fulldisk_band.php?sat=G16&band=16&length=48&dim=1
The color scale of “brightness temperature” in deg C is such that the radiance at 50C (red) is 13 times the radiance at -90C (white) in these images.
The effect of the dynamic formation and dissipation of clouds dominates the visualized scene of highly variable emitter performance. Because GCMs cannot directly simulate clouds, then using a tuned parameterization scheme as they must, they cannot possibly possess ANY diagnostic or predictive authority to then estimate a theoretical value of ECS.
Here is a link to a plot of 560ppmv vs 280ppmv CO2 from Modtran to illustrate where in the IR spectrum Band 16 falls and why it is relevant. Band 16 is centered at a wavelength of about 13.3 microns. This band produces about a quarter of the widely stated static warming effect of 3.7 W/m^2 for 2XCO2.
https://drive.google.com/file/d/175qnVngPPfZJKUPUH13u6t5wolTBl0qi/view?usp=drive_link
Here is a time-lapse Youtube video I posted with a full explanation in the details. It shows 7 days of hourly images. https://youtu.be/Yarzo13_TSE
GOES channel 16 is sensitive to 12.9-13.7 um radiation. It is only a minor active band of CO2. Essentially none of the warming due to CO2 is the result of what channel 16 is detecting. You can use spectralcalc.com to plot the active lines of CO2 (and other molecules) and their heights. Notice that 12.9-13.7 um is orders of magnitude lower than the lines between 14-16 um.
“Notice that 12.9-13.7 um is orders of magnitude lower than the lines between 14-16 um.”
So what? Look at the plot at the second link in my comment, from a simple Modtran exercise taking the clear-sky differences for 560 ppmv v 280 ppmv. Centered at 15 microns, there is actually a bit of a negative “warming.”
Band 16 is relevant to the incremental effect. Blue vs Red in the plot. The difference is plotted at the bottom.
No dispute that the strongest absorption and emission for CO2 is between 14-16 microns as you say.
My point was only that GOES is not designed to measure the longwave radiation in the regions of the IR spectrum where CO2 produces its warming. That’s not say that channel 16 isn’t useful. It obviously is.
Yes, Band 16 is obviously useful for meteorological purposes. You are ignoring the point that – coincidentally – it lines up with one place in the spectrum where incremental CO2 produces its incremental static “warming” effect which is the basis of the “climate” movement to begin with!
The clouds over 30C warm pools show the reflected SW increases at twice the rate of the fall in OLR. A very powerful negative feedback that limits ocean temperature to 30C. Cloud parameterisation can never capture that.
The models would do better if they clamped ocean surface temperature to 30C rather than the cloud parameterisation rubbish.
Quite apart from the inputs, assumptions, maths, and equations etc. to General Climate Models, they all rely on computer code.
There is presumably a large amount of legacy code, written in various languages by coders of variable skill. The Community Earth System is a hodgepodge of components from the 90’s and noughties. It’s the result of “extensive collaboration between researchers and institutions worldwide.”
What could go wrong with that?
Imagine a professional scientist trying to communicate a complex idea to a professional coder to write a function which integrates with a huge mess of code. What if it is written in Rust and the code it interacts with is in a module written in Fortran77 and leads to small errors which accumulate over iterations?
Computers don’t like floating point arithmetic and can’t generate real random numbers.
The machine spews out answers to the tenth of a degree?
No wonder none of these models ever approach reality.
We can’t take the input data seriously. The maths may be wrong. The code is spaghetti. Therefore the answers can never be right.
It’s self-evident that the planet’s “climate” system is too complex to describe in computer code.
If you believe it can, you may as well become a Postmaster or an epidemiologist.
Computers like floating point just fine, it’s the users that can get into the trap about error propagation due to the limitation of floating point representation of floating point numbers. Good point on pseudo-random numbers, many “secure communication” protocols rely on the use of a noise source to generate true random numbers.
The recent claim of AI being used for more accurate weather prediction, if it holds up, might lead to better climate models. (VERY strong emphasis on “might”.) This could be from a better job of parameterizing macro weather systems and thus avoiding the numerical analysis problems with climate models. In other words, the AI models may not be losing sight of the forest because of the trees.
“The Community Earth System “
The CESM is not a front line ESM. It is a program written by students for students.
[QUOTE FROM ARTICLE] “Arrhenius’ estimate of the climate sensitivity to a doubling of CO2 of 4°C, falls within the IPCC AR6 estimate of the likely range of this value, which they abbreviate as “ECS” or the equilibrium climate sensitivity. The AR6 range is 2.5 to 4°C/2xCO2.”[4] [END QUOTE]
I seem to remember reading a later Arrhenius article (ca. 1906?) in which he decreased his estimate of the ECS to 1.8 C per doubling.
[QUOTE FROM ARTICLE]”When a favored model, such as the IPCC model that CO2 is the “control knob”[22] for climate reaches its end, it is common to reach for any idea that can save it from extinction (overelaboration).” [END QUOTE]
The fact that temperatures decreased from 1945-1976 during a period of increasing CO2 concentrations tended to discredit Arrhenius, and the theory that CO2 concentration was the only “control knob” for the climate. Changes in solar activity, cosmic rays, volcanism, and changes in ocean currents (El Nino/La Nina, etc.) can have much larger influence over the climate than CO2 concentration.
[QUOTE FROM ARTICLE]”Laboratory measurements show that infrared active gases, like CO2, water vapor, and some hydrocarbon gases selectively absorb some of the infrared radiation emitted by Earth’s surface.” [END QUOTE]
A simplified IR absorption model assuming blackbody radiation through a dry atmosphere and CO2 absorption in the 15 um band would result in an ECS of about 1.40 to 1.55 C per doubling, as I posted yesterday. This would only apply to clear skies on dry land. In this model, increasing the CO2 concentration only increases temperatures up to about 20 meters above the ground, while temperatures at higher altitudes tend to decrease, because most of the available IR radiation is absorbed in the lowest layer of the atmosphere.
[QUOTE FROM ARTICLE]”AR6 does mention that observation-based studies exist that produce estimates of ECS below 2°C/2xCO2 but dismisses them because they believe that the feedback to increasing CO2 and warming increases with warming.[20]“ [END QUOTE]
Some of the IPCC models assume that increasing air temperatures due to increased IR absorption by CO2 would increase evaporation of water, and additional water vapor in the air would increase IR absorption. However, if we assume constant relative humidity (an assumption frequently used for feedback calculations), the heat required to evaporate water from a body of water into the lowest part of the atmosphere represents a negative feedback of 50% to 70% of the additional radiation absorbed by the CO2. An ECS of 1.40 to 1.55 C/doubling over land would be reduced to about 0.45 to 0.78 C per doubling over the oceans, depending on ocean temperature, which is a function of latitude and season.
[QUOTE FROM ARTICLE]”Plants are more abundant and robust when the atmospheric CO2 concentration is high and less so when it is lower. He [Arrhenius] notes that all CO2 sinks increase in strength as the CO2 concentration increases.” [QUOTE FROM ARTICLE]
A mass balance over the atmosphere shows that, if CO2 emitted to the atmosphere remained there forever, about 8 gigatonnes (Gt) of CO2 emissions would raise its concentration by 1 ppm. Worldwide human emissions of CO2 were estimated at 36.8 Gt in 2022, which would result in an increase of 4.6 ppm/yr if there were no sinks. However, the concentration of CO2 at Mauna Loa is increasing at a rate of only 2.5 ppm/yr, meaning that a net 2.1 ppm/year (16.8 Gt/yr) is removed by natural sinks.
If the “strength of the sinks” (CO2 removal rate) was linearly proportional to CO2 concentration (first-order reaction), we would expect the removal rate by the sinks to catch up to the emission rate when the concentration reached 4.6 / 2.1 times the current concentration, or about 920 ppm, after which the CO2 concentration would level off and reach equilibrium. But if plants grow faster in a CO2-enriched atmosphere, we could expect crop yields to more than double over their current yields.
If we assume a “dry-atmosphere” sensitivity of 1.5 C per doubling, the temperature increase from today would be 1.5 * ln (4.6/2.1) / ln(2) = 1.7 C. However, if the sensitivity over the oceans is only 0.45 to 0.78 C per doubling over 70% of the earth’s surface, the average sensitivity over the entire surface of the globe would be closer to 1.0 C per doubling, resulting in a warming at equilibrium of about 1.1 to 1.2 C.
At the current rate of increase in CO2 concentration (2.5 ppm/yr), it would take another 200 years to reach 920 ppm. However, as the removal rate approaches the emission rate, the rate of increase in CO2 concentration would slow down, so that it might take 300 or 400 years to reach equilibrium at 920 ppm.
A future century when food production has doubled, the world is about 1.1 C (2 F) warmer than today is not really a scenario to be feared, but to be welcomed.
Good points!
Arrhenius originally calculated an ECS of about 5.4 C in 1896. He performed the same calculation again for his 1908 book Worlds in the Making using updated lunar radiation data and reported 4 C. BTW…some estimates suggests he toiled with as many of 100,000 individual calculations in these efforts.
Arrhenius’ calculations are ceteris paribus. The post WWII era saw a significant increase in aerosols which more than offset the radiative forcing of CO2.
Ceteris Paribus. Feedbacks amplify the effect.
That’s not how that works. Evaporating water does not reduce the planetary energy imbalance since the accumulated energy goes into making water change phases as opposed to increasing its temperature thus the upwelling radiation stays the same. In fact, not only does evaporating water not reduce the energy imbalance, but it actually amplifies the energy imbalance since water vapor is a GHG. Thus water vapor is a positive feedback that amplifies the effect of any agent that creates the initial energy imbalance. The ECS is higher because of water vapor; not lower.
Exactly. That is indisputable and unequivocal evidence that humans the cause of the increase in carbon mass in the atmosphere.
“I seem to remember reading a later Arrhenius article (ca. 1906?) in which he decreased his estimate of the ECS to 1.8 C per doubling.”
Wrong
Ok, so this is something that has troubled me for a while. How do we justify the assumption that 100% is the upper limit on the warming due to the enhanced greenhouse effect (eGHE)?
AlanJ’s chart above shows a green curve for ‘Natural Forcing’ which is trending negative. I do not know how it is defined. However, it implies that the eGHE was recently more than 100% of the actual warming, due to some natural cooling factors offsetting the eGHE warming.
Is it intellectually honest for us to claim that the transient climate response based on observed temperatures is the maximum value? If natural forcing were to have swung from the current supposedly cooling trend back to early twentieth century conditions, the implications are that warming rates would have been even faster than were actually observed.
The natural warming or cooling, absent human influences is unknown. That is one of the key points of this series of posts.
I get that, but why did you say:
I don’t trust anything pushed by AlanJ, but his chart implies that over the past few years, eGHE warming has been something like 150% which doesn’t fall in the middle somewhere.
In theory eGHE could be greater than 100% if the natural trend were negative. But the data we have suggests we are in a natural warming trend coming out of the Little Ice Age and that eGHE is less than 2. More here:
The Mysterious AR6 ECS, Part 4, converting observations to ECS – Andy May Petrophysicist
Also see part 3 of that series.
I agree with that and my mantra is “There is NO CLIMATE EMERGENCY!” I just want to see that our climate realism is as accurate and persuasive as possible.
If we argue that the empirical evidence shows that ECS can’t be more than 2, then we’re open to a justified attack. In many places you make the case that we just don’t know, but in that instance I think you made an unsupported claim that shouldn’t be repeated.
It’s a multi-front war and some of our forces should battle with the AlanJ’s about whether all natural effects have been identified and how those effects should be quantified. Some of the effort should go to how the temperature record is corrupted.
There are many areas of uncertainty in the realm of science that should continue to be argued, but I maintain that the political realm is so far out of hand that it must be our primary focus. We need to demonstrate to a reasonable public that the costs of ‘mitigation’ are far too severe and the effects of the warming are likely to be mostly beneficial.
It is because I prioritize being politically effective over being scientifically perfect that I don’t think climate realists should expend the bulk of their energy trying to hit a home run by ‘proving’ that ECS is less than 1. It is far easier to convince someone that they can’t afford to heat their home and feed their family than it is to get them to even grasp the meaning of equilibrium climate sensitivity. This is all the more important when we can plausibly argue that a 4° warmer world would be largely a far more prosperous world where we could easily afford adaptation.
They’re taking the piss or this is from The Onion-
NASA plan to fight climate change by injecting ice into atmosphere (msn.com)
It is becoming necessary to decide if global temperature reconstructions are correct and accurate or wrong and misleading. Remember that many proxy studies are calibrated against some version of historic temperature trends- if the trend is wrong, the proxy study misleads.
Already mentioned are some temperatures from 45 “pristine” weather stations that I selected in Australia, with its low population density and hence good hunting for pristine stations.
Here are the Tmax time trends of those stations over the past 110 years or part thereof.
The question is, why do their trends differ overall and in the details of their textures (wriggle matching is poor). How can one calculate a meaningful average?
Geoff S
It was too quick for me.

Geoff S
In few words: convection and atmospheric and oceanic circulation. The Earth is not a uniform thermodynamic body.
Andy,
Yes, convection and circulation are intuitively plausible, but proof comes from measurement. Fully agree that we do not have a uniform thermodynamic body. (Vive la difference).
One conclusion to date is that the main cause of the wriggle mismatch is measurement error, particulary station shifts. I have provided some clear examples of this effect over the years for Australian data. Colleague Dr Bill Johnson on bomwatch many others. Not sure how often this happens in other countries, foggy information here in Australia because detailed metadata are typically not available.
Currently, I have a crazy idea that variation in atmospheric water and CO2, close to weather stations, needs a deeper look.
Some authors of CO2 radiative effects have mentioned that much of the energy transfer happens rapidly in the first 10m or so above the ground, where the thermometers are. If there are changes to this shallow CO2 or water concentration over months to years, perhaps from nearby vegetation growth patterns and/or perhaps from changes in local water abundance, then an effect might be found in local thermometry. I suspect though, that the T change would be small. Early days.
But, something is creating those bumps and dips on the graph and it is not clear to me what their best explanation is. Geoff S
You bring up another important problem. One degree over 100 or so years is tiny. Too small to be significant over so long a period of time.
Andy May’s proper conclusion as stated in his above article:
“While reading this quote from AR6, we need to remember Box’s cautions about “overelaboration and overparameterization.” It is also worrying that even after refining the IPCC/CMIP models for over 30 years, the spread in model results is not converging, it is increasing. This is a sign that the model premises and/or design are flawed. It is also a clue that the conceptual IPCC model that human activities are controlling climate change has reached the end of its useful life.”
I will just add that Nobel Prize-winning physicist Richard Feynman phrased the matter slightly differently:
“It doesn’t matter how beautiful your theory is, it doesn’t matter how smart you are. If it doesn’t agree with experiment, if it doesn’t agree with observation, it’s wrong. That’s all there is to it.”
Let me also say that the “experiment” doesn’t need to be contrived and controlled. GCM’s can be validated by the outputs they show. If they can’t accurately predict the climate even a year from now, they don’t pass the test.
Yes . . . Mother Nature is continuously in the process of “running experiments” for us (i.e., varying the inputs and boundary conditions for various natural processes), if we humans would only take careful note of such.
One glaring example of such: How nature has varied atmospheric CO2 concentration over the last 600 million years or so since the Cambrian “explosion” of life on the planet . . . all but the last 200 years or so without any significant input from humans.
But, but, but conditions were different!
It is dangerous to challenge the “scientific consensus” on Climate Change. The data generated is Above Refute, the projections not to be questioned and the remedies being mandated are Proven Safe and Effective and therefore any resistance to them will be considered an antisocial Threat to Society. Isn’t that how this works?