An article published in Popular Mechanics magazine titled, “Oops, Scientists May Have Miscalculated Our Global Warming Timeline” with the subtitle “Clues have emerged that reveal a much hotter history than we thought” makes a refreshing admission that confirms what Climate Realism has pointed out since its inception – Earth has already surpassed the arbitrary 1.5°C limit imposed at the 2015 Paris Climate Accords.
It is important to note that the 1.5°C threshold is an arbitrary number, not one established or defined by science. It was defined by political negotiations in the Paris Accord agreement of 2015. An Associated Press article, The magic 1.5: What’s behind climate talks’ key elusive goal, admits this stating, “in a way both the ‘1.5 and 2 degree C thresholds are somewhat arbitrary,’ Stanford University climate scientist Rob Jackson said in an email. ‘Every tenth of a degree matters!’”
The Popular Mechanics article, by writer Darren Orf published on February 9th says this:
A new study from University Western Australia Oceans Institute studied long-lived Caribbean sclerosponges and created an ocean temperature timeline dating back to the 1700s.
. . .
By analyzing strontium to calcium ratios in these sponges, the team could effectively calculate water temperatures dating back to 1700.
The study concludes that the world started warming roughly 80 years before the Intergovernmental Panel on Climate Change (IPCC) has maintained throughout its history, reports, and treaty negotiations, and that the Earth had likely already experienced more than 1.7 degrees Celsius by 2020.
While some scientists are questioning the validity of that data and conclusions of the article, since it goes against the dominant narrative, it does in mesh with the instrumental temperature record from Europe which ClimateRealism has written about extensively.
Climate at a Glance: Tipping Point – 1.5 Degrees Celsius Warming, succinctly sums up the issue, pointing out: climate alarmists (and the IPCC) say we need to limit global warming to 1.5°C above pre-industrial times to avoid disastrous consequences, but data show we have already exceeded such temperatures, with no confirmed ill effects.
As seen in Figure 1 below we’ve actually exceeded 2.0° C rise in temperature according to the European temperature data.
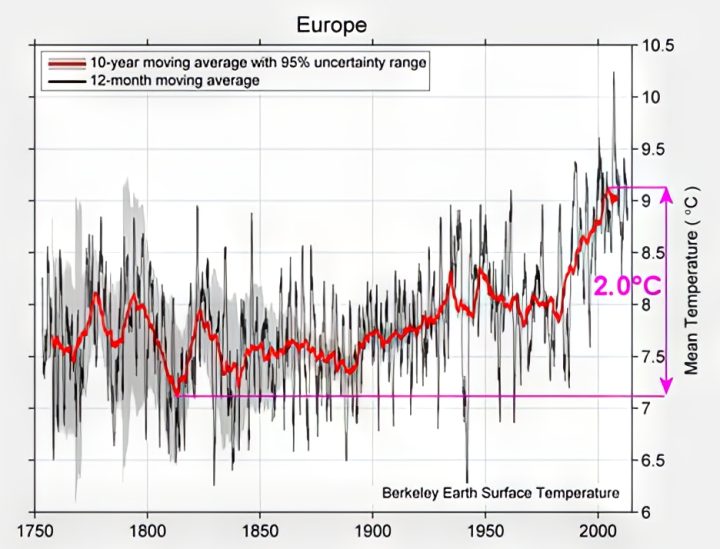
The European temperature data show temperatures began rising about the year 1820. Note that this was 130 years before the large modern rise in carbon dioxide emissions began, that are claimed to to be driving dangerous warming.
Going hand in hand with the arbitrary 1.5°C temperature limit, climate alarmists warn we must take drastic steps within the next 10 years to keep warming to below or near 1.5°C above pre-industrial conditions. They claim that warming beyond that 1.5°C threshold will unleash a crisis of substantially worse extreme weather events and other climate harms. Yet the evidence suggests that we have already exceeded the much hyped 1.5℃ threshold, and data shows no disasters are arising.
Extreme weather is not becoming more common or severe, and fewer people every year are dying due to temperature and weather-related causes. Those predicting disaster from 1.5℃ have been wrong for decades. Climate Realism reported on the lack of “tipping point” occurrences in the article, Media Can’t Agree on the Number of Climate Tipping Points, Much less When, for example.
The bottom line is that climate science is very likely wrong on both the temperature record as well as the catastrophic predictions that are made from extrapolations into the future by climate models and other predictive methods. Kudos to Popular Mechanics for highlighting research which undermines this climate catastrophe narrative.
“climate alarmists warn we must take drastic steps within the next 10 years to keep warming to below or near 1.5°C above pre-industrial conditions”
hmmm… maybe we could build thousands of gigantic air conditioners to cool the Earth- using of course, only clean and green energy! No problemo! /sarc
Just take some of the extra electricity wind and solar are claimed to produce to the grid and turn some of the pinwheels into giant fans!
Nothing useful about temperatures can be gleaned from a bogus temperature record like Berkeley Earth.
The Popular Mechanics author should study how the Berkeley Earth temperature data was gathered.
Then he could declare the whole thing a fraud.
First hint: Sea surface temperatures are made up out of thin air, and land surface temperatures in the past are “adjusted” to make the past appear cooler, which makes the present appear warmer.
The Popular Mechanics author needs to do a little more homework on this subject.
The whole article is like FBI Director James Comey explaining at length why not to believe Hillary Clinton and at the very end saying, “But this doesn’t matter.”
The article goes on at length the explain why claims of “the increase in global temperature” are dodgy and how according to the latest revision, the Earth has been warming decades before industrialization could have had an impact. The last paragraph springs on us, “We still have to do NetZero to Save the Planet.”
“Nothing useful about temperatures can be gleaned from a bogus temperature record like Berkeley Earth.”
Well said Tom.
All the WORST data, fudged and adjusted and mal-manipulated to make up whatever they want.
Tom Abbott
” Nothing useful about temperatures can be gleaned from a bogus temperature record like Berkeley Earth. ”
Any really consistent proof for this harsh claim?
*
” … and land surface temperatures in the past are “adjusted” to make the past appear cooler, which makes the present appear warmer. ”
Let’s look at a graph comparing Berkeley Earth to raw data from the GHCN daily station set
*
We see how wrong you are: the Berkeley evaluation shows exactly the opposite.
Significantly warmer in the past, slightly cooler in the present, which the trends below show perfectly.
Linear estimates for 1850-2020 in °C / decades
… for 1979-2020
*
The superficial way you disparage other people’s work makes it seem like you lack 100% the technical skills needed to reproduce what they do.
*
One of my former university professors said decades ago:
“Anyone who is unable to contradict scientifically or technically will soon begin to discredit polemically. ”
True more than ever.
By the way, it is often amazing to see how two so completely different time series (generated out of very different data sources and by using completely different processing techniques) nonetheless are so similar in many places:
Don’t look only at the series, but also at their (240 month) running means.
“Let’s look at a graph comparing Berkeley Earth to raw data from the GHCN daily station set”
Where’s your evidence that either one of those data bases uses raw (unmodified) data? Where did they get their sea surface temperature data?
They all use Phil Jones version of the past temperature record. You know, the Phil Jones that won’t tell anyone how he reached the temperature conclusions he reached. The one that hides his methods in case someone tries to prove him wrong.
All the written, historical regional unmodified surface temperature charts from around the world that were available to these data mannipulators show it was just as warm in the Early Twentieth Century as it is today. none of them show a “hotter and hotter and hotter” Hockey Stick profile. So how do you get a Hockey Stick profile out of a chart that doesn’t show a Hockey Stick profile?
So, if the data mannipulators want to cool the past and make the present look a lot warmer, then they can’t use the raw (unmodified) data because the unmodified data does not show that it was cooler in the past than it is in the present.
So, they either bastardized the written temperature record, or they add in bogus sea surface temperatures that are cooler than the land temperatures to bring down the land temperatures in the past to make it look like today is the hottest times in human history.
And we all know that sea surface temperatures from 1800 are for the most part non-existent. A few ships here and there on the vast oceans is all that exists. So the temperature data mannipulators just made up the global sea surface temperatures out of thin air.
Show me where I’m wrong.
Show me that raw, unmodified data you use.
Abbott
” Where’s your evidence that either one of those data bases uses raw (unmodified) data? ”
Typical for all the pseudo-skeptic people I have to do with since years.
A reply post full of polemical discrediting against people you never could yourself technically contradict, and which unsurprisingly shows a complete lack of knowledge about weather/climate data sets.
+
Here is the GHCN daily I use since 2016, the rawest data known to me:
https://www1.ncdc.noaa.gov/pub/data/ghcn/daily/
The probability that you ever would be able to process such data imho is quite near to zero, isn’it?
GHCN daily’s data for Germoney by the way is very near to the hourly data provided by the German DWD (‘Deutscher Wetterdiesnt’).
Fee free to try generating some absolute data out of GHCN daily for Europe, and come back to us when you got it right, Abbott.
I have it of course on the disk, but I prefer to await your amazing result 🙂
*
” Where did they get their sea surface temperature data? ”
That’s now the very best: since when does one use SST for an evaluation of Europe’s land temperatures?
You are of an amazing incompetence, Abbott.
What is the measurement uncertainty of the raw values inGHCN? Is the data uncertainty even fit for calculating a temperature gradient of 1C?
How good is the strontium method for calculating water temperatures?
Assuming it’s very good- the increase in ocean temp. in that area doesn’t necessarily correlate with the planet’s temperature. Or so I’d think, not being a scientist.
How many samples and from how many locations does it take to estimate temperatures from 300 years ago? Could it be people are deceiving themselves?
Could also be that the numbers 1.5ºC and 2ºC are utterly meaningless and have zero scientific relevance to anything. 😉
iirc, they are political agenda numbers pulled from the nether regions of some Klimate Kook at Potsdam.
C’mon now, man! I have it on good authority that 1.5 and 2.0 were ascertained using chicken entrail divination! That is the preferred method of zany political scientismists everywhere! It might become the standard for determining the gender of newborns as the Great American Empire decides to let their freak flag fly forever!
No one proxy covers the entire planet. It would take a large number of proxies scattered all over the planet to do that.
Fortunately, we have them.
About a million- uniformly distributed across the planet- might be a good start. And that’s assuming the proxie method is valid- or reasonably valid within certain error bars.
More likely, if this method is reliable, they are measuring shifting currents more than global average air temperature.
Bingo!
The Vikings grew crops in Greenland.
No thermometers there then but they claim it’s warmer now.
Where are the farms in Greenland now?
They’ll reappear once today’s temperature reaches the past temperature.
Here’s another indication of the warming cycles. Other glaciers in North America show several warming cycles with forest remnants exposed from both Medieval and Roman warm periods.
https://www.nps.gov/glba/planyourvisit/maps.htm
To your point Jeff:
Yes, the letter sent to Nixon from scientists in early 1970s was right about our heading towards another ice age. They were just a little premature on the when it will happen.
It was a significant dip in temperatures. especially in the NH.
Wiped from the “official” records now, of course..
Wiped from the official NASA page about 2017.
U.S. chart shown beside Hockey Stick chart
It used to be at the link just below, but if you go there you will see that NASA removed the page. I guess it was too embarrassing for James Hansen to try to explain why the U.S. regional chart profile looks so different from the bogus Hockey Stick chart profile.
Here’s his lame explanation: James Hansen: “How can the absence of clear climate change in the United States be reconciled with continued reports of record global temperature? Part of the “answer” is that U.S. climate has been following a different course than global climate, at least so far”
See what I mean.
Here’s the graphic from the wayback machine:
Here’s the text from the wayback machine:
https://web.archive.org/web/20050112211708/http://www.giss.nasa.gov/research/briefs/hansen_07/
For some reason, when the Wayback Machine archived this page they put the graphics on one page and the text on another.
The graphic shows a U.S. regional chart (Hansen 1999) next to a bogus, bastardized Hockey Stick chart.
In the text portion, James Hansen gives a lame explanation for why the U.S. regional chart temperature profile and the bogus Hockey Stick Chart temperature profile look so different.
The unmodified, regional written land temperature records from all over the world show the same temperature profile as the U.S. regional chart where it shows it was just as warm in the Early Twentieth Century as it is today. This means there is no unprecedented warming today and therefore, no need to worry about CO2 levels in the atmosphere.
None of the unmodified, regional, written temperature records show a Hockey Stick chart “hotter and hotter and hotter” temperature profile.
The Hockey Stick chart is the Outliar.
The Hockey Stick chart is the BIG LIE of alarmist climate science.
“It used to be at the link just below, but if you go there you will see that NASA removed the page.”
Here you go.
https://www.giss.nasa.gov/research/briefs/archive/1999_hansen_07/
Glaciation is a consequence of warming northern oceans. Cooling of the land surfaces is the result of the extent of permanent ice on land in combination with the lapse rate due to increasing difference between elevation of the ice mountains and the ocean surface.
Greenland is gaining elevation at 17mm a year now. A similar rate will occur right across the land surface north of 40N progressing southward from around 2200.
Northern oceans have a lot of warming to come before the snowfall overtakes the snow melt. And, in contrast to Greenland, very little of the rest of the land north of 40N already has permanent ice. It is just a matter of time. The solar intensity shift northward began 500 years ago and is just getting into full swing. Most of the remnant permanent ice from last glaciation has now gone. It will be replaced with fresh ice over the coming centuries.
I should have pointed out to select the “Brochure “ map to see the history. Note the advances between early 20th C and 1966 surveys.
But according to the blessed prophet, Michael Mann, the Little Ice Age did not occur. Trust him!
And if you don’t, stay silent or prepare to be sued.
If I’m not mistaken, we have the Little Ice Age to thank for “Abbot and Costello meet Frankenstein”.
(In a round about way.)
Thanks Anthony.
Kudos to Popular Mechanics – – – Is this the first place of publication?
P. M. is not my regular “go to” source for science.
Nope. https://www.nature.com/articles/s41558-023-01919-7
Gee, the Berkeley Earth average European temperature dropped .25 C between 1820 and 1985. The graph looks more like a picture of the urban crime rate than a hockey stick.
Fools. These measurements cannot resolve 100mK.
Neither can we accurately state the average global surface temperature, especially down to hundredths of a degree.
Another indication that the alarmists house of cards may soon collapse? Pray.
Politics, politicians. Whenever I hear or see these words the following enter my mind: criminal, liar, felony, organized crime, scum, and somewhat more recently: pedophile.
Don’t think in such small terms, they don’t – grand larceny, conspiracy to defraud and, of course, the ever-popular nepotistic enrichment.
You have to wonder why, since global temperatures are the subject of the 1.5C IPCC target, the chart used shows Europe-only data? Especially when the data source, Berkeley Earth, produce a global temperature data set. The chart also seems to expire some time around the early 2010s.
That aside, despite the markings on it, the chart doesn’t in fact show a +2C rise in temperature. Just picking the lowest and highest points in a data series and measuring the difference between them does not give you an observed warming estimate; you have to use linear regression to do that.
By way of illustration: Berkeley don’t seem to publish their pre-1850 data any more, but they publish monthly temperature anomalies right up to end 2023. The coldest month in Berkeley’s 1850-2023 series was Jan 1861 (-1.0C) and the warmest Sept 2023 (+1.6C), both relative to the 1951-1980 average.
If you just crudely deduct one from the other, as was done in the chart above, you get a temperature difference of +2.6C; but that doesn’t tell you there’s been +2.6C warming between the two dates, because there have been many other ups and downs between those two points.
When you use linear regression, you see that in fact, the total warming between Jan 1861 and Sep 2023 is ‘only’ +1.2C, some 1.4C less than the crude method. The two methods (the right one and the wrong one used above) are illustrated in the attached chart.
All the worst data available.. They can mal-adjust it to make a baby elephant if the want.
It is utterly meaningless.
The same source used to make the point in the article, so….?
Thanks for agreeing it utterly meaningless. !
So the article is meaningless?
Probably right there.
The whole AGW scam is utterly meaningless.
The total basslessness of your chosen AGW-cult religion is being exposed by your own comments.
Well done!
Using their own meaningless concocted garbage to prove their own meaningless concocted meme is also garbage.
Seems like a very good way of showing the absolute idiocy of the whole AGW nonsense.
Only it wasn’t Berkeley that used the data in the article. It was the author of the article and the graph itself (which was made by none other than the site’s proprietor) who used Berkeley.
What didn’t you comprehend about….
Using their own meaningless concocted garbage to prove their own meaningless concocted meme is also garbage.
Are you really that mentally incapable !!
You might think this article is meaningless concocted garbage. I just think it’s misleading.
But if you don’t think the BEST data set is reliable enough to make such a claim, how would you test it? What data set would you use given you have to start before 1850?
The only real temperature data you have comes from regional, written, historical temperature records. That’s all there is.
All those records show there is no unprecedented warming today, so how do we get a Hockey Stick chart profile out of data that doesn’t contain a Hockey Stick profile?
Unless you are prepared to produce your own global temperature data set, based on all these “real temperature data”, why should anyone care what you think?
TFN,
Only an amatuer would want to fit a straight line to numbers that are clearly curvilinear.
Geoff S
Do you mean this
for example?
Or would you prefer this
instead?
Ahaaaaa!
A few members of the Gedankenpolizei came here and discreetly handed out penalty notices.
Looking at the data series would indicate to a trained data analyst that linear regression is not a good choice of method.
The fact that the Earth has had multiple glacial and interglacial periods stands as proof that the “global average temperature” is a cyclical process. You can’t use linear regression on a cyclical process to resolve *anything”. Even a 1000 years of temperature measurements wouldn’t be enough to resolve what is actually happening with the Earth’s temperature. It would be like taking 10 seconds of data from a process with a period of an hour. a natural variation of 10%, and trying to resolve the components of the cyclical process you are measuring. A linear regression of the data you have collected simply isn’t fit for the purpose of forecasting future measurements.
There was thread a few days ago about “bad scientists”. Climate “scientists” are a perfect example. They are basically carnival hucksters telling fortunes using a cloudy crystal ball. Their models are nothing more than a linear regression algorithm no matter how many “equations” they put in the models, the proof is obvious merely by looking at a graph of their output for the “future”. Pat Frank has proved this by duplicating their output with a simple linear equation.
So the science isn’t settled?
I’m always skeptical of the accuracies of the various climate proxies used to recreate past climate.
How certain can we be from limited data? I’m especially skeptical of average global temperature comparisons. We don’t really know the average global temperature. At best, we have an estimated range for average global temperatures.
Right, otherwise it would stop.
“Claimate science” has stopped, and is going backwards.
Just eyeballing, but that graph suggests we have warmed by around 1°C in the last 30 years. If this is regarded as an accurate proxy for global temperatures than all global data sets have been seriously underestimating the rate of modern warming.
Sorry, didn’t check the graph. I assumed it was the spong proxies the article was talking about. But it’s just BEST for Europe.
The point is that it’s nonsense to claim on that basis that we have passed the 1.5°C target. First because that’s based on global temperatures, not the European land figures. And secondly it’s in comparison to the 1850 – 1900 average, not compared to one low point in the 1820s.
The Berks use all the worst urban affected data they can find and then pretend that urban warming basically doesn’t exist. They have no idea where most of it comes from.
It is just pointless garbage… perfectly suited to the AGW agenda and monkeys with rulers.
Take it up with Anthony Watts. He’s the one using their data to claim that temperatures started warming before CO2 and that we are already 2°C above per-industrial temperatures. I’m disagreeing with that point.
So you agree that Berkeley is pointless garbage.
Well done
Also GISS et al .. I expect to see you stop using them.
Using their own meaningless concocted data to prove their own meaningless concocted meme.
Seems like a very good way of showing the absolute idiocy of the whole AGW nonsense.
No what’s been happening over the last 30 years and more is that the rate of warming has been seriously overestimated by the careless switch over from LIG thermometers to AWS for the recording of temps.
The Europe chart is 10-years out of date, at least. The reference link under the chart is dead.
The Europe chart is from the Berks. It is meaningless garbage.
Not surprised they removed it…
… trouble is they have almost certainly replaced it with something just as much garbage and meaningless.
If that’s the case, that the early data are meaningless, then it defeats the whole point of the article.
If we don’t know what temperatures were, even approximately, pre-1850, then there’s no basis for claiming that we have already passed +1.5C, is there?
So here is no basis for any of the AGW religion then !
WOW. you really shot yourself in the arse that time, didn’t you, gormless one.. !
Here’s the more up to date graph, but still only till 2015.
https://berkeleyearth.org/temperature-region/europe
Actually it’s up to 2020. I was looking at the 10 year average.
Why show more data that you KNOW to be JUNK ??
Seems to be all you specialise in.
Rarely do proxies have a perfect correlation with the measurand they are substituting for. That means the uncertainties in calculated estimates are larger than with a direct measurement. Yet, it is rare to see an explicit expression of the 2-sigma probability envelope when proxy estimates, purported to support a hypothesis, are presented. Do those sponge calculations have an uncertainty of +/-100%? If so, they are relatively useless, like many other measured climatology parameters. However, how would anyone even know what the uncertainty envelope is if the authors don’t provide it? That means looking at not only the analytical precision and the propagation of error in calculations, but also the r^2 value of the correlation between the proxy measurements and the desired variable. Throwing out numbers without the associated descriptive statistics is poor science because one can’t assess whether the numbers are even fit for purpose.
You encapsulated the whole problem with climate science today. They don’t even calculate the variance of their “daily mid-point” temperature let alone the variances of anything they use that data for.
The most basic of statistics textbooks will tell you that you need both the mean AND the variance in order to describe even the simplest of data distributions, the Gaussian distribution. Yet you *never* see climate science address the variance of their data, only the mean. That’s bad science from bad scientists.
And that doesn’t begin to address the issue of measurement uncertainty and its propagation into the final result.
Pre-industrial was the Little Ice Age which was very cold.
The Earth is still in a 2.56 ice age named the Quaternary Glaciation in a cold interglacial period that alternates with very cold glacial periods. https://en.wikipedia.org/wiki/Quaternary_glaciation
The data sets, like Berkley Earth, present “adjusted” data to the public. Since most of Earth has no available temperature records to use prior to WW2, we know early data is just made up. I am always amazed at how adjustments are used to create much more warming than is in the actual measured data.
Ironically, the climate catastrophe that hasn’t happened since 2000 has now become the political/economic catastrophe that is happening now.
Saying climate catastrophe is happening when it isn’t…… means there is a loss of confidence in the future warming trend. This loss of confidence in warming trend began to happen during the 2007-2010 solar minimum of the 23rd cycle when the common usage of “Global Warming” stood alone. To hedge their bets it was morph’d to “Climate Change” and the entire climate propaganda industry began to rapidly capitalize . It peaks during the pandemic when fear mongering begins in earnest…… this is an indication that the climate propaganda industry was leveraged by very powerful people with very deep pockets….. and silent agendas.
And what if we trend back to mini-ice age climate of the 19th century? All it means is the people in Richmond Virginia will be able to use Byrd Park for what it was built for, and giant outdoor skating rink….. no harm there. It might also mean that I will have snow cover from Dec-April which I would adore….and would build a ice rink on my property. Maybe the Northern Tier Wheat Industry fails maybe it just moves further south.
Yet, the status quo or warmer would be fine as well. I love cycling in Cape May in Feb and March.
Boring but Paris said two degrees. 1.5 arose from the IPCC’ s much criticised SR1.5 study produced just before the failed Katowice COP..
The Boy Who Cried Wolf has 100x more credibility than the vast majority of “climate scientists”.
And it’s the ones that have no credibility that our fake news media always trumpet.
The best thing you can do with the last 45 years of that data and that is to ignore it.
As its been utterly trashed for doing any serious study by the way the switch over from glass to AWS thermometers has been badly handled.
Because by switching over to AWS the temp data has been “running warm” for around 70% of the time when compared to the LIG thermometers, and the current study am doing suggests that this has added about 0.7C to the temp data.
So l consider that for a more realistic 10 year moving current temp for Europe it should set at 8.3C rather then that overcooked claim of 9C
The carribean sclerosponge study:
https://www.nature.com/articles/s41558-023-01919-7
Observed temlerature 1706-2022 The Netherlands (Labrijn)
Are they actually “observed” or “adjusted observed”
If it is “whole of Netherlands”, it will have been urbanised, homegenised, putrified, and mal-adjusted, by the same procedures that create warming trends everywhere else.
Very nice. We skeptics are far too forgiving, by that I mean we have allowed CAGW monsters to establish the dates to be used, the language to be used and so on. We need to hold their feet to the fire.
This post is very important and needs wide distribution. It needs to be repeated over and over. This is how you convince the common guy that he is being screwed over big time. Once he realizes that he won’t stand for it and this nonsense will end.
Popular Science leapt onto the AGW bandwagon right away, while Popular Mechanics resisted for quite a while. They’ve also run articles several times debunking 9/11 myths and conspiracy theories so they haven’t gone *completely* mad over there.
it’s a fairly safe bet now that the post-1820 warming trend is dominated by changes in the shortwave TOA budget due to increased cloud layer permeability
it isn’t just the CERES data, you can look at any region with records and correlate the increase average hours of sunlight to the decadal temperature average
so yes, we wasted tens of trillions of dollars on history’s most expensive moral panic
and as a bonus, we have almost no idea what temperatures will do over the next several decades, as no cloud-prediction models have fared particularly well
Please — we can accept that the Earth has generally and gently warmed since the most recent Little Ice Age — that is fairly well established in a qualitative sense.
What is not and cannot be established, and should not be accepted, is any quantitative statement about that gentle warming. Certainly not in degrees C of F or tenths of either of those scales. We do no and cannot know that numerical average temperature of Earth in the 1800s and, in my opinion, don’t know it, if there can be said to be an “it”, for the present.